
What are Offline Evaluations via Logging?
Offline evaluations allow you to test and validate your AI Agent before it goes live with end users. Unlike online evaluations that run in production, offline evals give you the opportunity to:- Test against a curated set of inputs with expected outputs
- Validate tool calls, retrieved context, and generation quality
- Run evaluations in a controlled environment
- Iterate quickly without impacting real users
withEvaluators function, you can capture every interaction of your AI system and automatically run evaluations against expected outcomes.
Prerequisites
Before you start, ensure you have:- Maxim SDK installed in your project
- API key from the Maxim platform
- Log repository created in your Maxim workspace
Getting Started
Step 1: Install the SDK
Step 2: Initialize the Logger
Step 3: Logging a Trace or Span
Before you log data, it is helpful to understand the hierarchy of Maxim’s logging objects:- Trace: A trace represents a single interaction or request in your application (e.g. a user query). This is the core unit of logging.
- Span: A span represents a unit of work within a trace (e.g. a retrieval step, a generation step, or a custom function execution).
- Session (Optional): A session is a logical grouping of multiple traces (e.g. a multi-turn conversation).
Basic Workflow: Trace -> Span
The most common workflow is to create a trace for a single test case and add spans to it.Session -> Trace -> Span
If you need to group multiple traces together (e.g. for a chat session), you can wrap them in a session.Step 4: Log Generations, Retrievals, and Errors
Detailed logging allows you to debug issues and run granular evaluations. You can log LLM calls (Generations), context fetching (Retrievals), and any errors that occur.Generations (LLM Calls)
Track each LLM call within your trace to capture detailed information about model interactions, including prompt, completion, and usage stats.Retrievals (RAG)
For RAG systems, logging retrieval steps helps you evaluate the quality of your context separately from the generation.Tool Calls
If your agent uses tools (e.g., function calling), logging these interactions allows you to evaluate tool usage accuracy.Custom Metrics
In addition to running evaluators, you may want to log custom numeric metrics such as cost, latency, or pre-computed scores. You can use theaddMetric method (or add_metric in Python) on any entity (trace, generation, retrieval, or session).
Errors
Capturing errors is crucial for debugging. You can log errors on any entity (trace, span, generation, or tool call).Running Evaluators
You can configure evaluations to run on logs pushed via the SDK. To configure this, in your log repository dashboard, click on “Configure evaluation”. Here, you can choose the evaluators to run on your traces or sessions. Set the sampling to 100% and remove all applied filters so that evaluations are run on all the logs.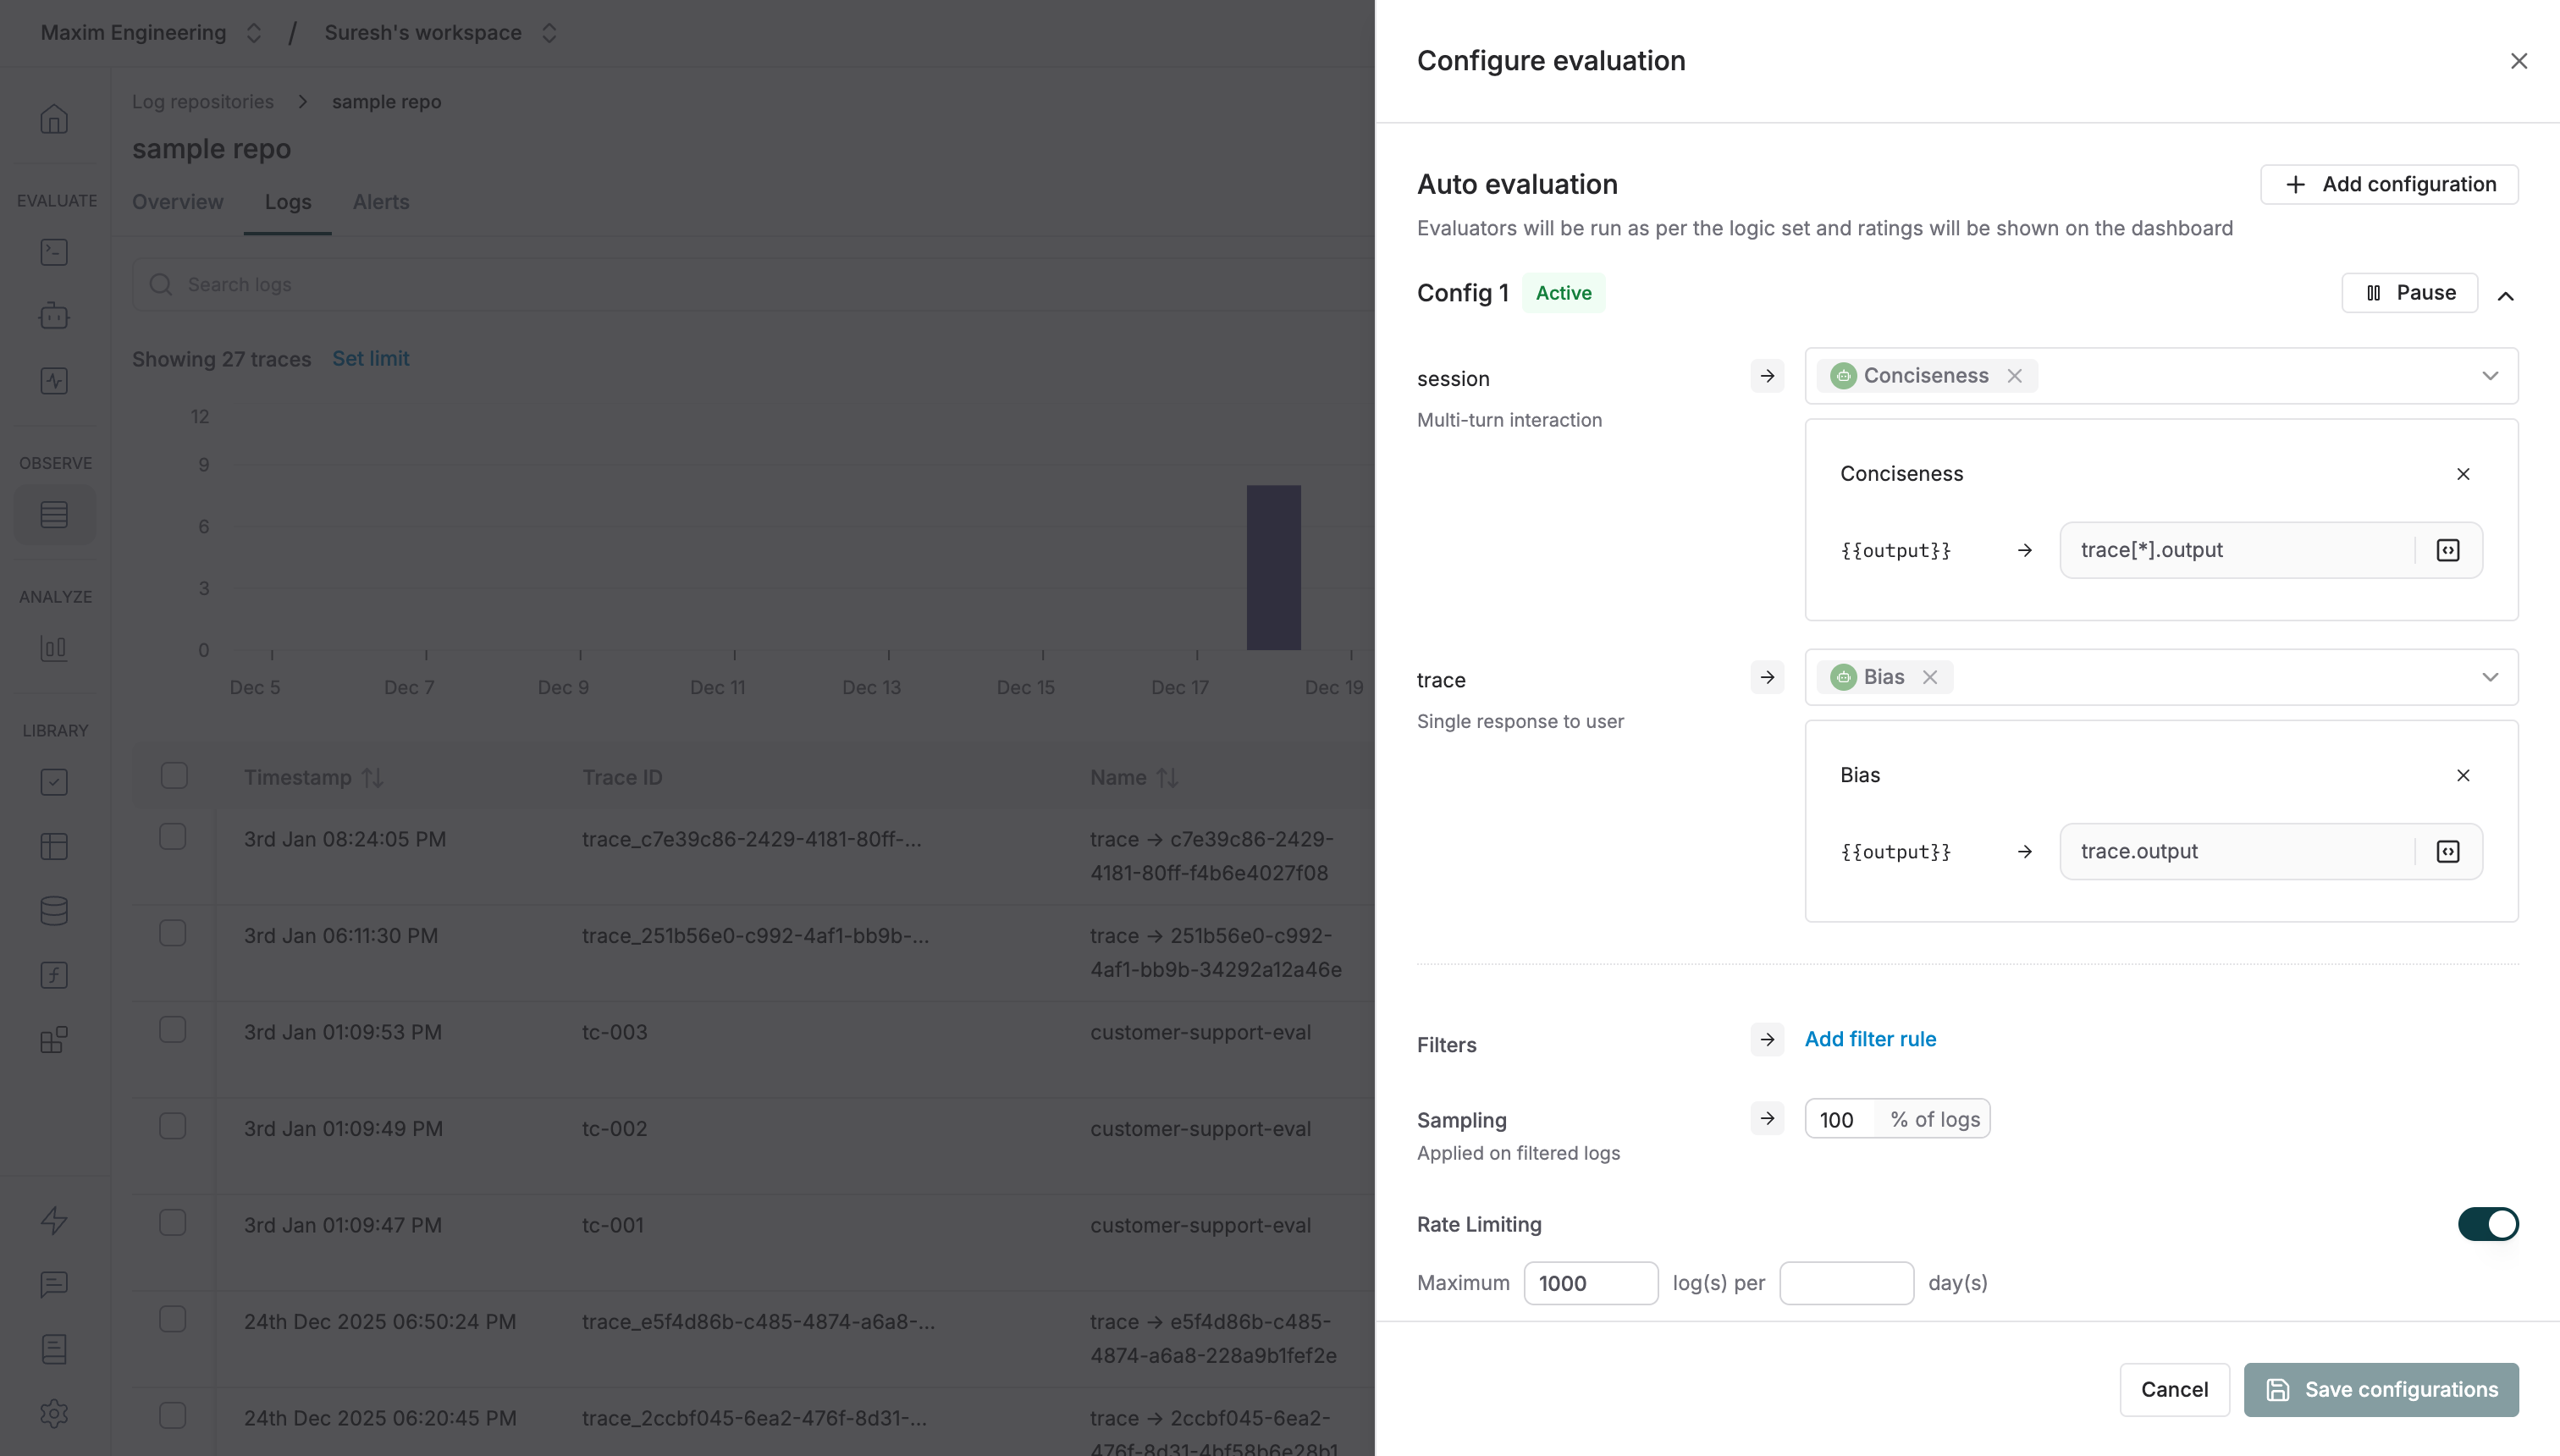
Attaching Evaluators via SDK
ThewithEvaluators function allows you to attach evaluators to any component of your trace (trace itself, spans, generations, or retrievals). Evaluators run automatically once all required variables are provided.
Providing Variables for Evaluation
Evaluators require specific variables to perform their assessment. Use thewithVariables method to provide these values:
Chaining Evaluators and Variables
You can chainwithEvaluators and withVariables together for cleaner code:
Putting it all together
Here’s a comprehensive example that demonstrates running offline evaluations with expected outputs:Example: RAG System
For RAG (Retrieval-Augmented Generation) systems, you can evaluate both retrieval quality and generation accuracy:Example: Tool Calls
For agent workflows that include tool calls, you can validate that the correct tools are being called:Viewing Evaluation Results
After running your offline evaluations, view the results in the Maxim dashboard:- Navigate to your Log Repository
- View the Logs tab to see all logged traces
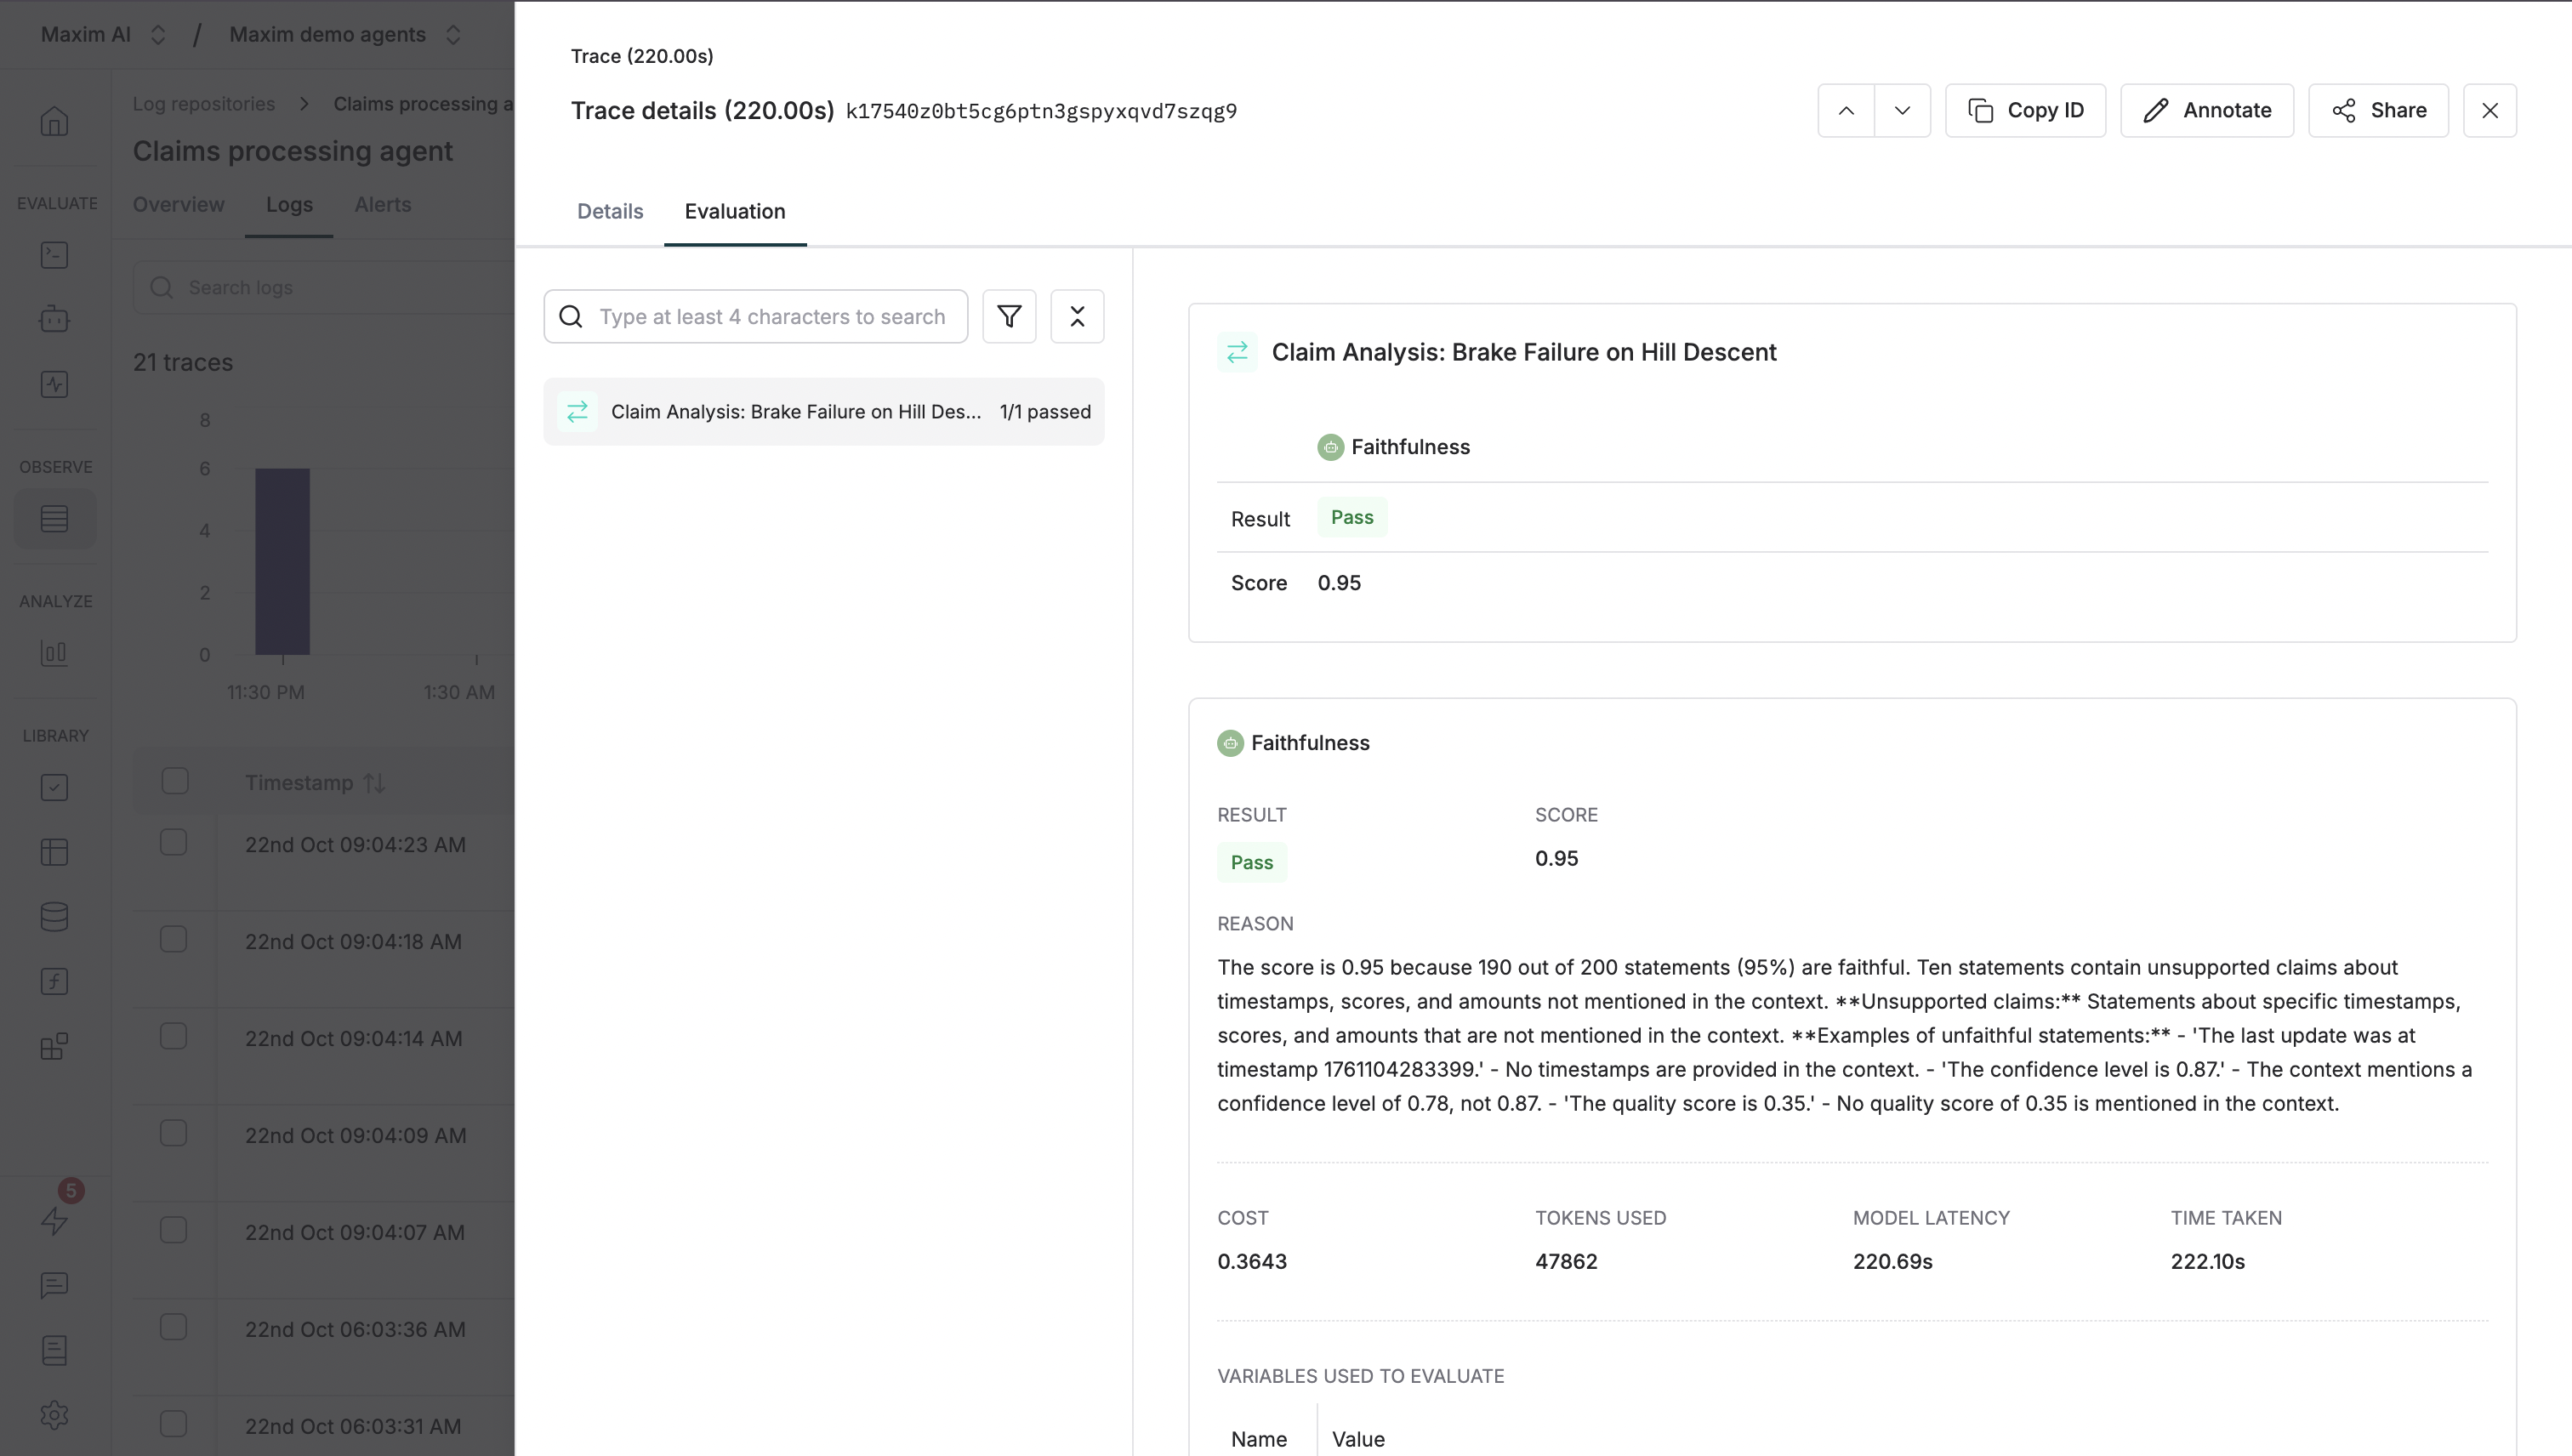
- Click on any trace to see detailed evaluation results
- Use the Evaluation tab to see scores, reasoning, and pass/fail status
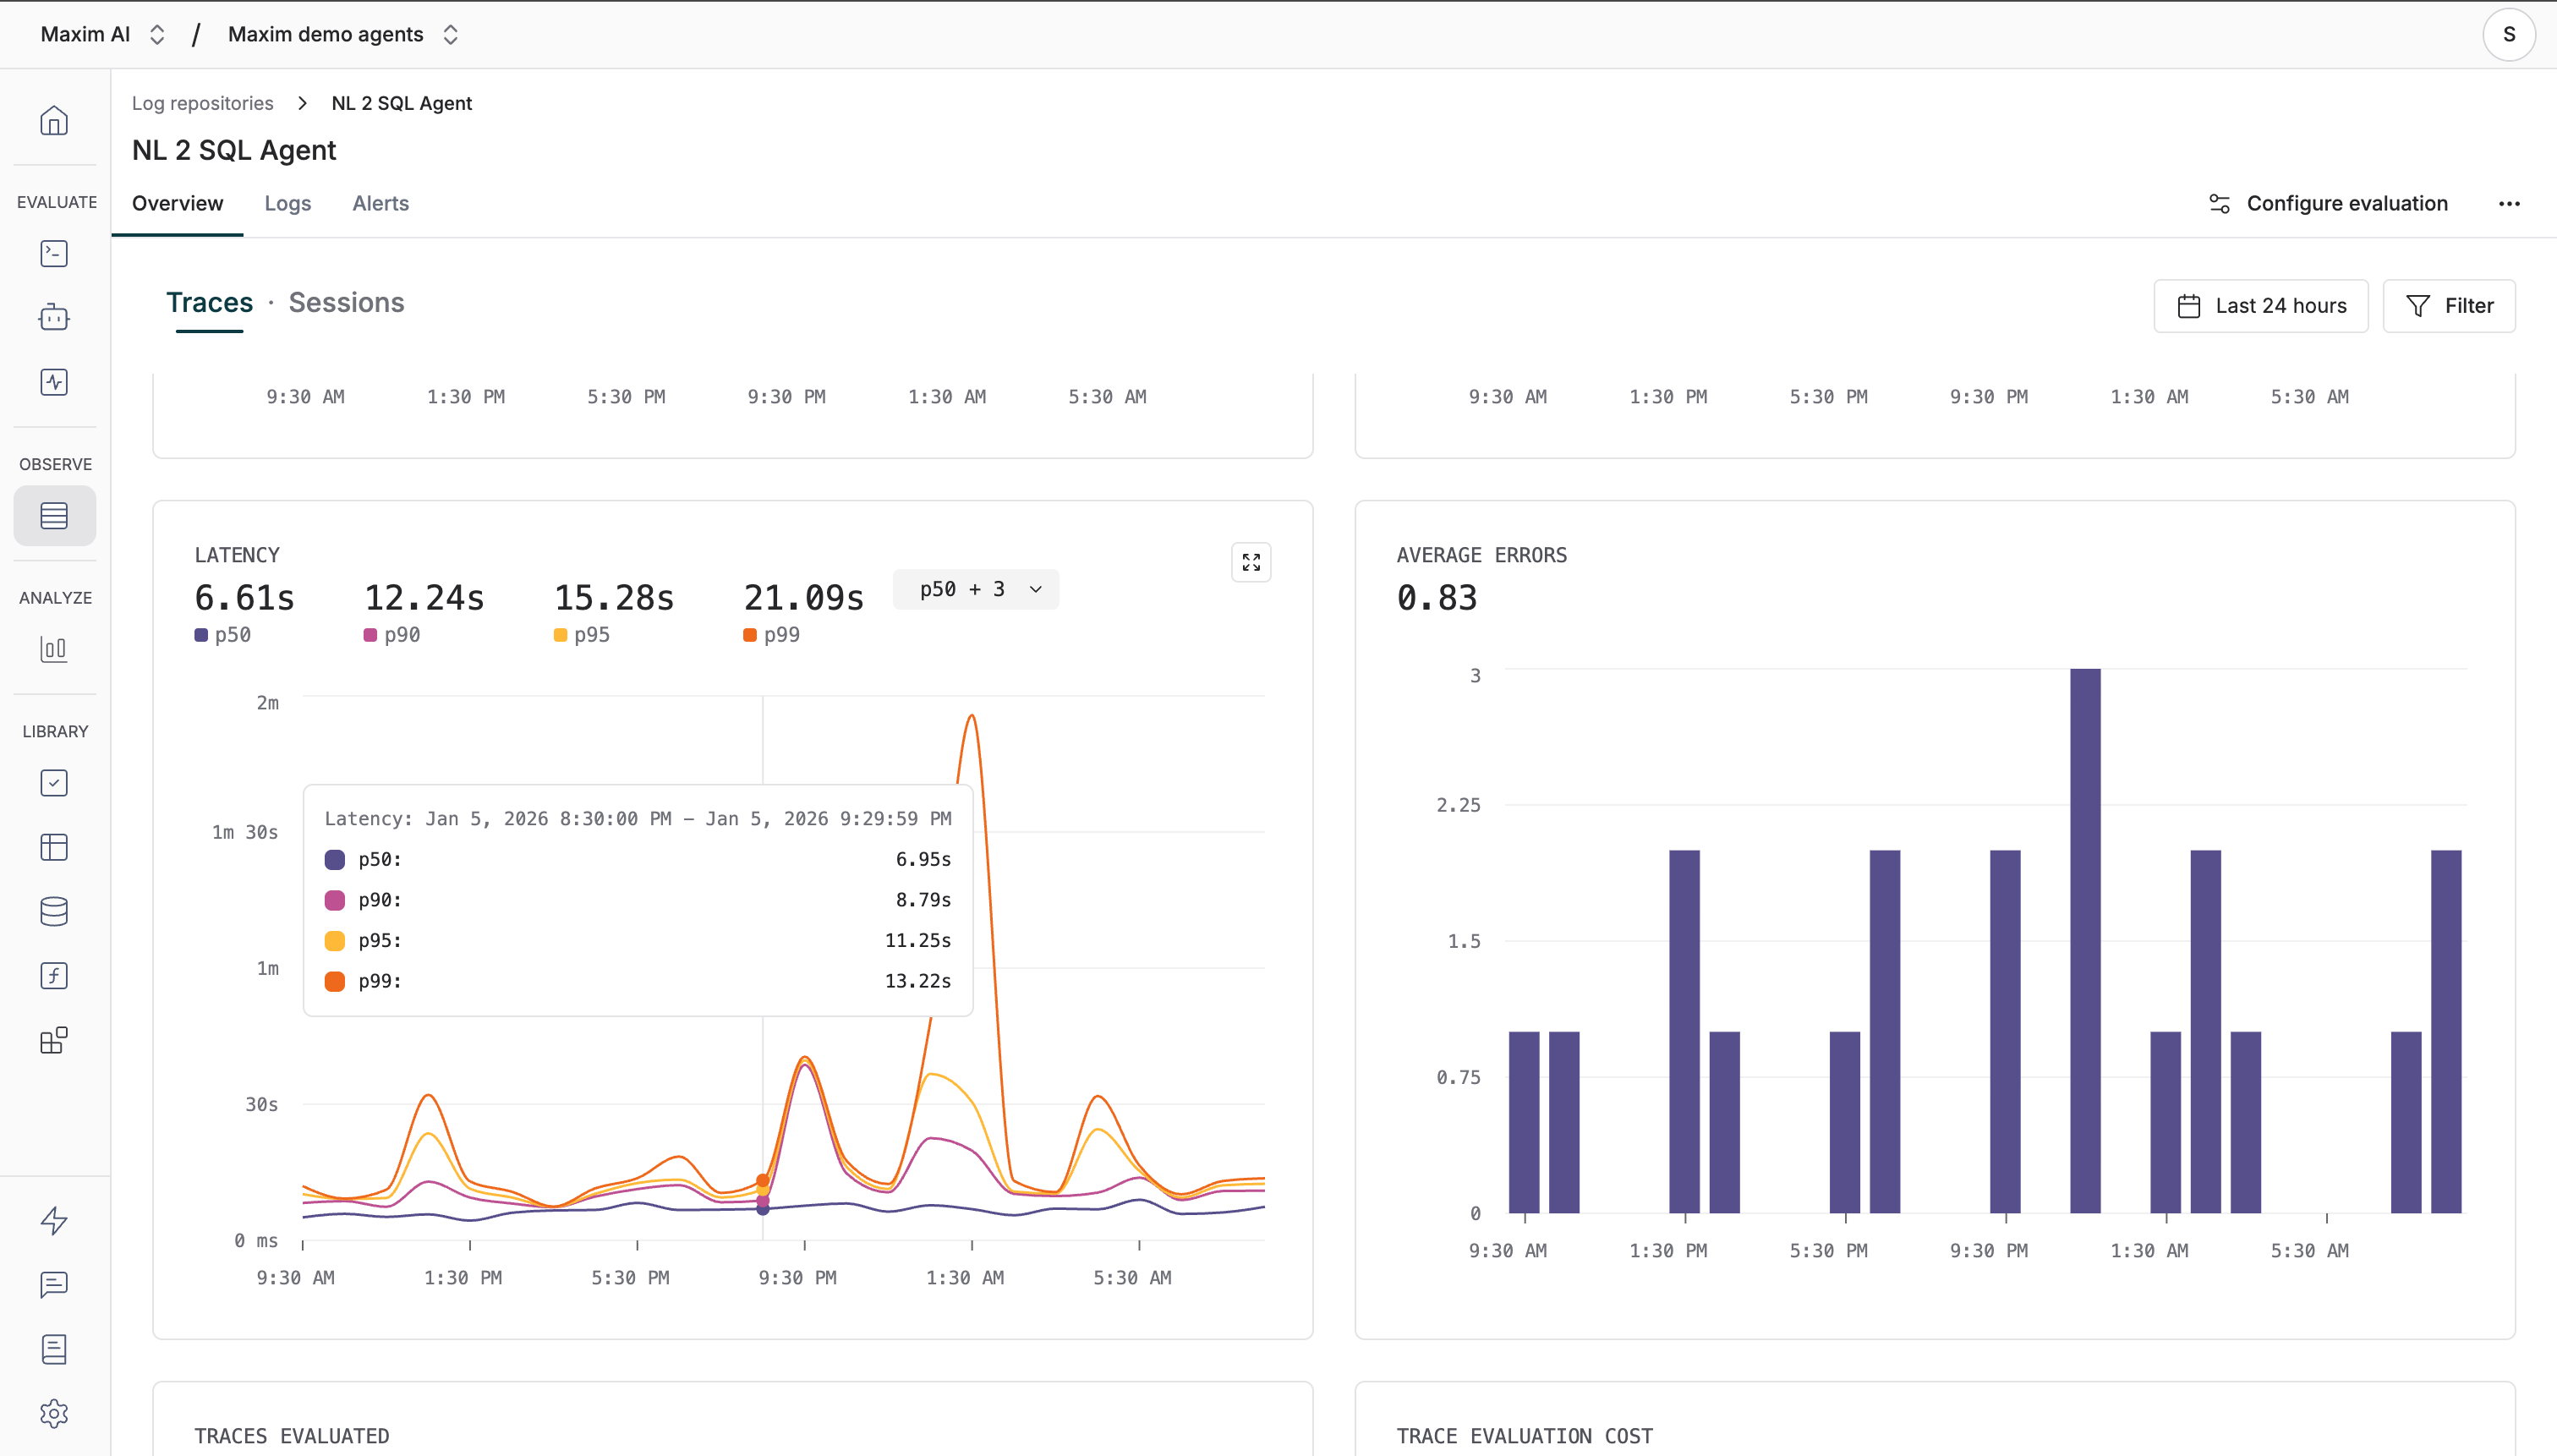
- The “overview” tab in your logs repository provides insights on your logs and evaluation runs, including metrics like latency, cost, score, error rate, and more. You can filter your logs by different criteria, like tags, cost, latency, etc.
Best Practices
1
Use deterministic test IDs
Use consistent, meaningful IDs for your test cases to make it easy to track and compare runs over time.
2
Include expected outputs
Always include expected outputs in your test cases for comparison evaluators like
semantic-similarity to provide meaningful scores.3
Tag your traces
Use tags to categorize your offline evaluation runs (e.g.,
test_type: offline_eval, version: v1.2.0) for easy filtering.4
Choose appropriate evaluators
Select evaluators that match your use case:
- Semantic Similarity: Compare output against expected output
- Faithfulness: Ensure answers are grounded in provided context
- Tool Call Accuracy: Validate correct tool selection
- Context Relevance: Assess retrieval quality in RAG systems
Next Steps
- Node-Level Evaluation - Learn more about programmatic evaluation
- Pre-built Evaluators - Explore available evaluators
- Custom Evaluators - Create your own evaluation logic
- CI/CD Integration - Automate your evaluation pipeline
Schedule a demo to see how Maxim AI helps teams ship reliable agents.