
How does Maxim’s observability platform work?
Maxim’s observability platform builds upon established distributed tracing principles while extending them for GenAI-specific monitoring. Our architecture leverages proven concepts and enhances them with specialized components for AI applications. Our observability features provide a comprehensive view of your AI applications through monitoring, troubleshooting, and alerting capabilities.Log Repository
The most central component of Maxim’s observability platform is the Log Repository, as it is where logs are ingested. It allows for ease of searching and analyzing.How should you be structuring log repositories?Split your logs across multiple repositories in your workspace based on your needs. For example, you might have one repository for production logs and another for development logs; or you could have a single repository for all logs, differentiated by tags indicating the environment.We recommend implementing separate log repositories for separate applications, but also separate log repositories for separate services that managed by distinct teams. Trying to keep logs that are related to different applications or services in the same repository can lead to difficulties in analyzing and troubleshooting.
Overview Tab
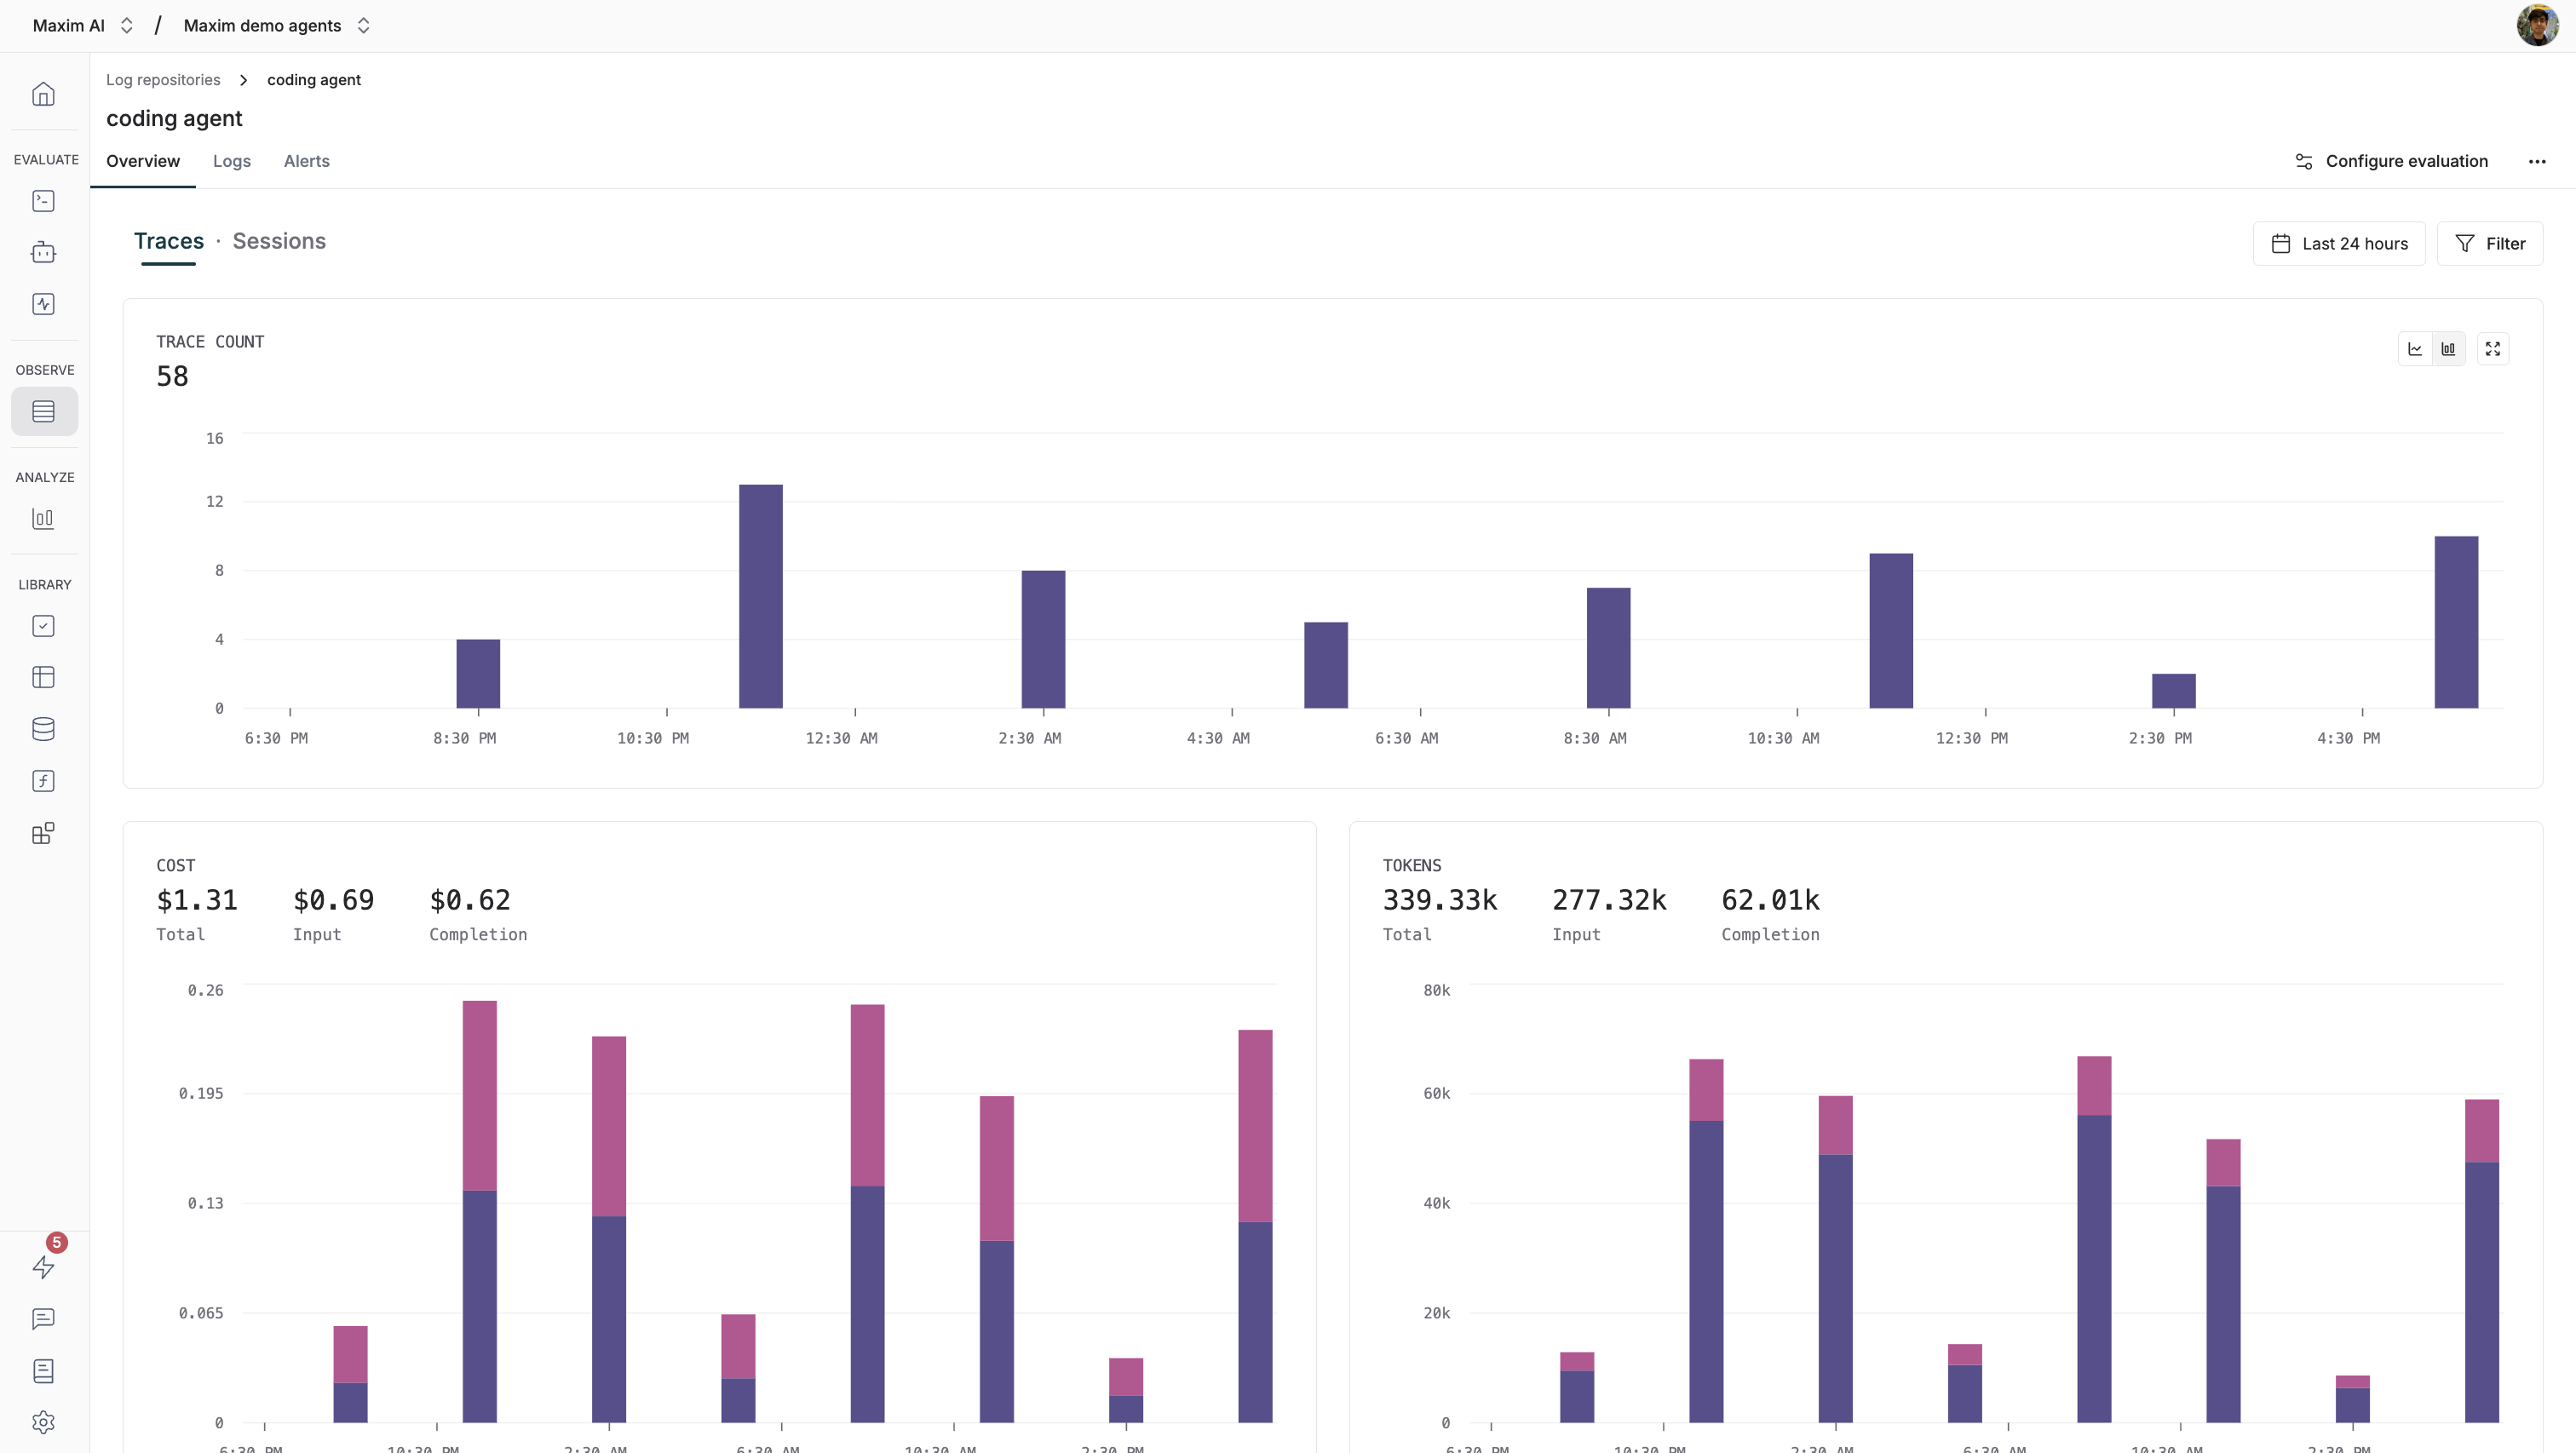
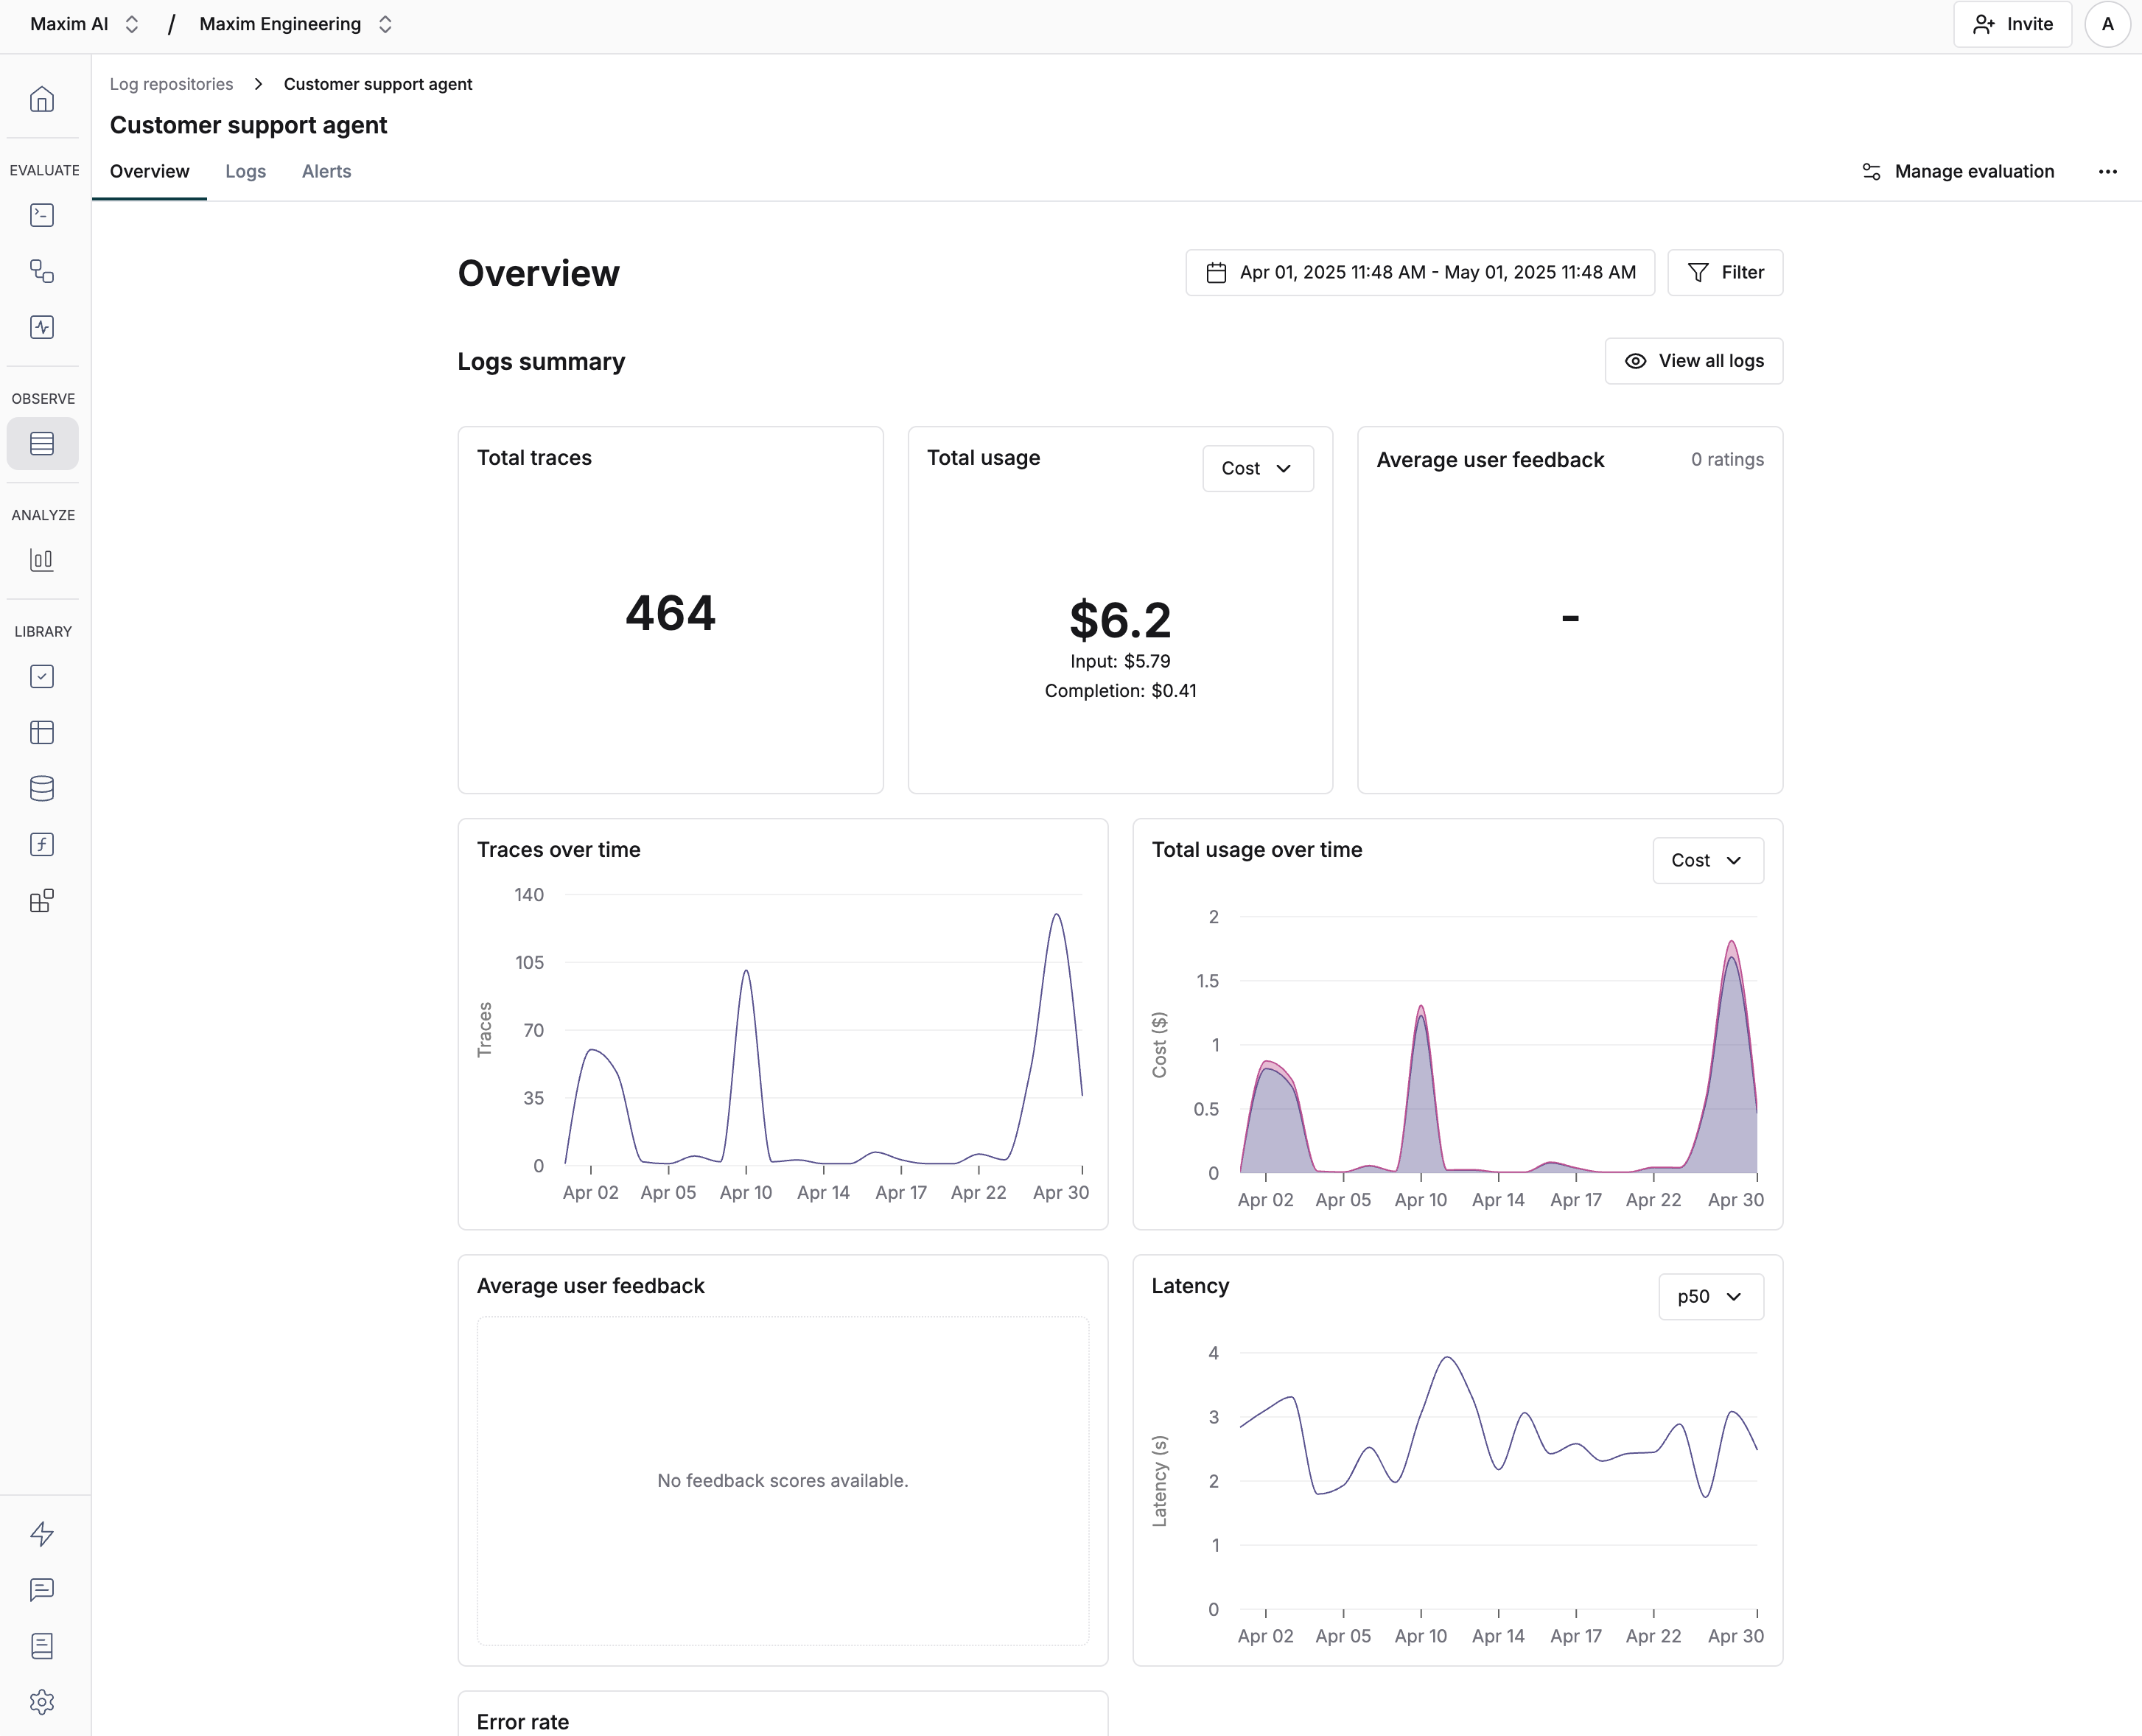
The Overview tab provides a comprehensive snapshot of activity within your Log Repository for your specified timeframe. The metrics that are displayed in the overview include:- Total traces
- Total usage
- Average user feedback
- Traces over time (graph)
- Total usage over time (graph)
- Average user feedback over time (graph)
- Latency over time (graph)
- Error rate (graph)
- No of traces evaluated
- Evaluation summary
- Mean score over time (graph)
- Pass rate over time (graph)
We will talk more about evaluation logs in How to evaluate logs section of the documentation.
Logs Tab
Logs Tab is where you’ll find all the ingested logs in a tabular format, it is a detailed view where each log is displayed separately with it’s own metrics.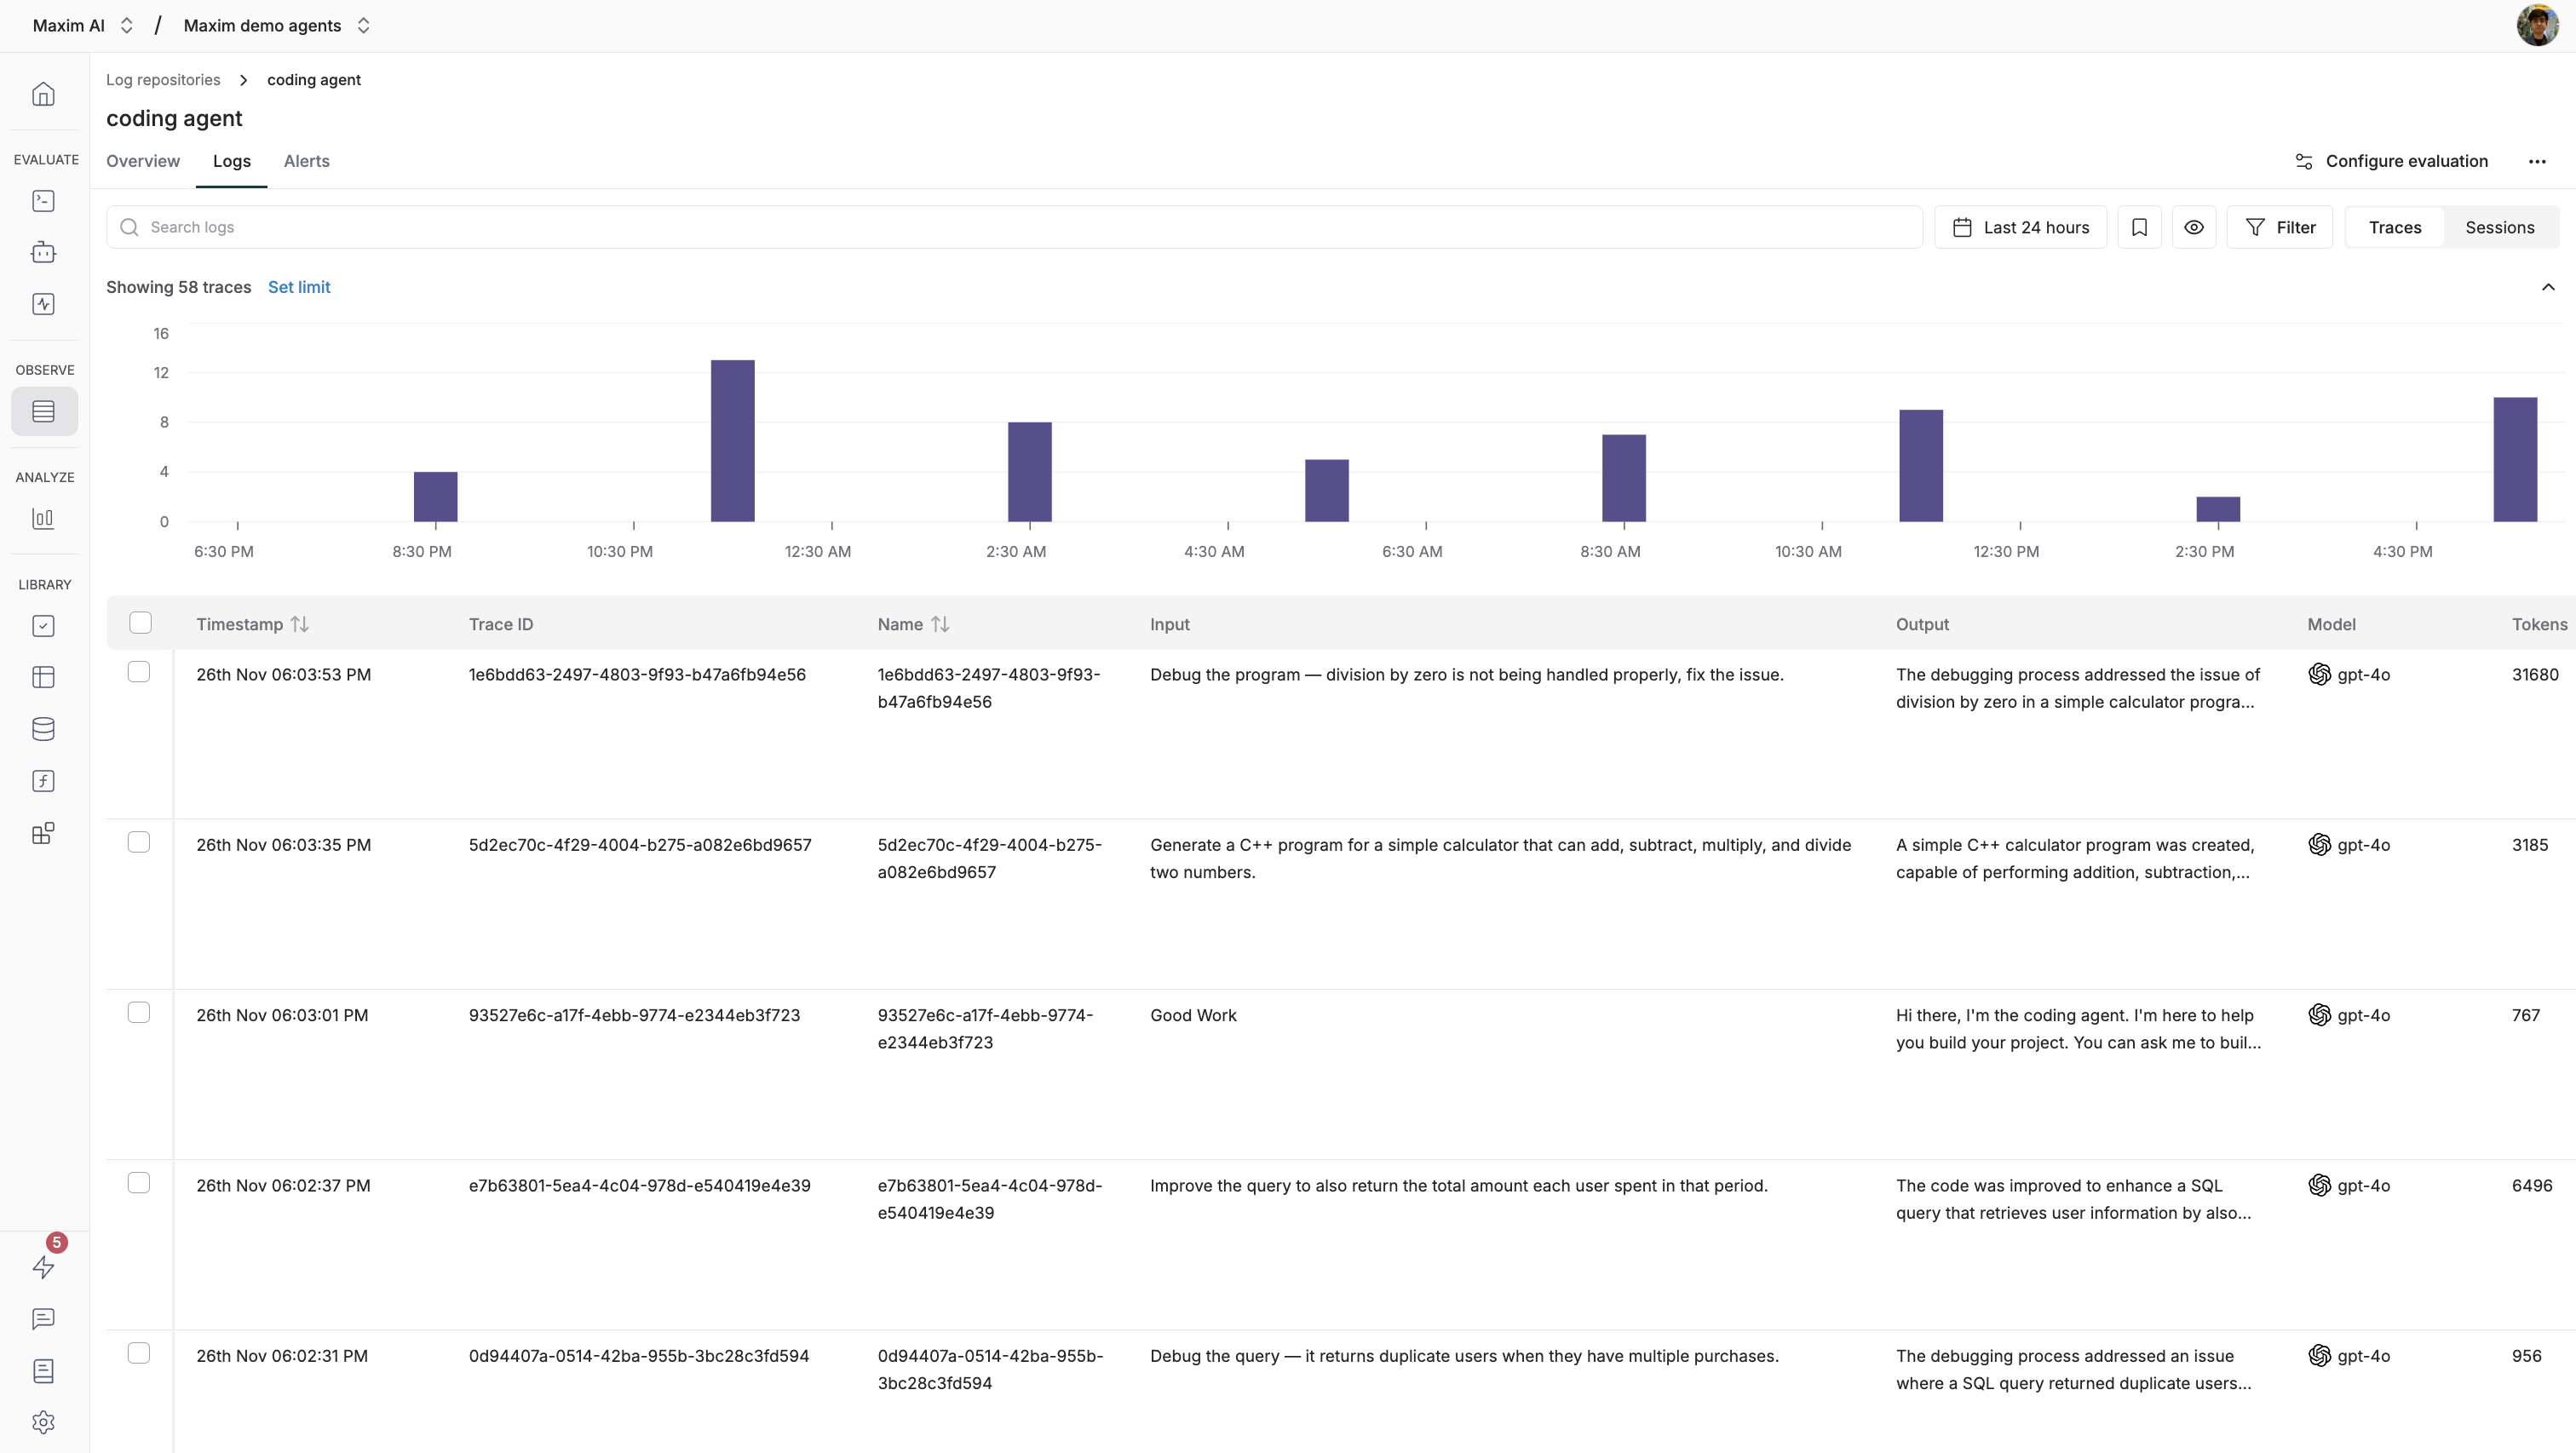
Apart from the above fields, there are Evaluation score fields per evaluator too, these display any evaluation done on the trace and what score was obtained for that evaluation.
Each trace can be clicked to see an expanded view of the trace in a sheet. It displays detailed information on each component of the trace and also the evaluations done on each component.
Learn more about logging in the How to log your application section of the documentation.
Alerts Tab
Once you start logging, you can set up alerts to monitor specific metrics. Alerts are triggered when the metric exceeds a certain threshold, and they can be configured to notify you via slack, pagerduty or opsgenie.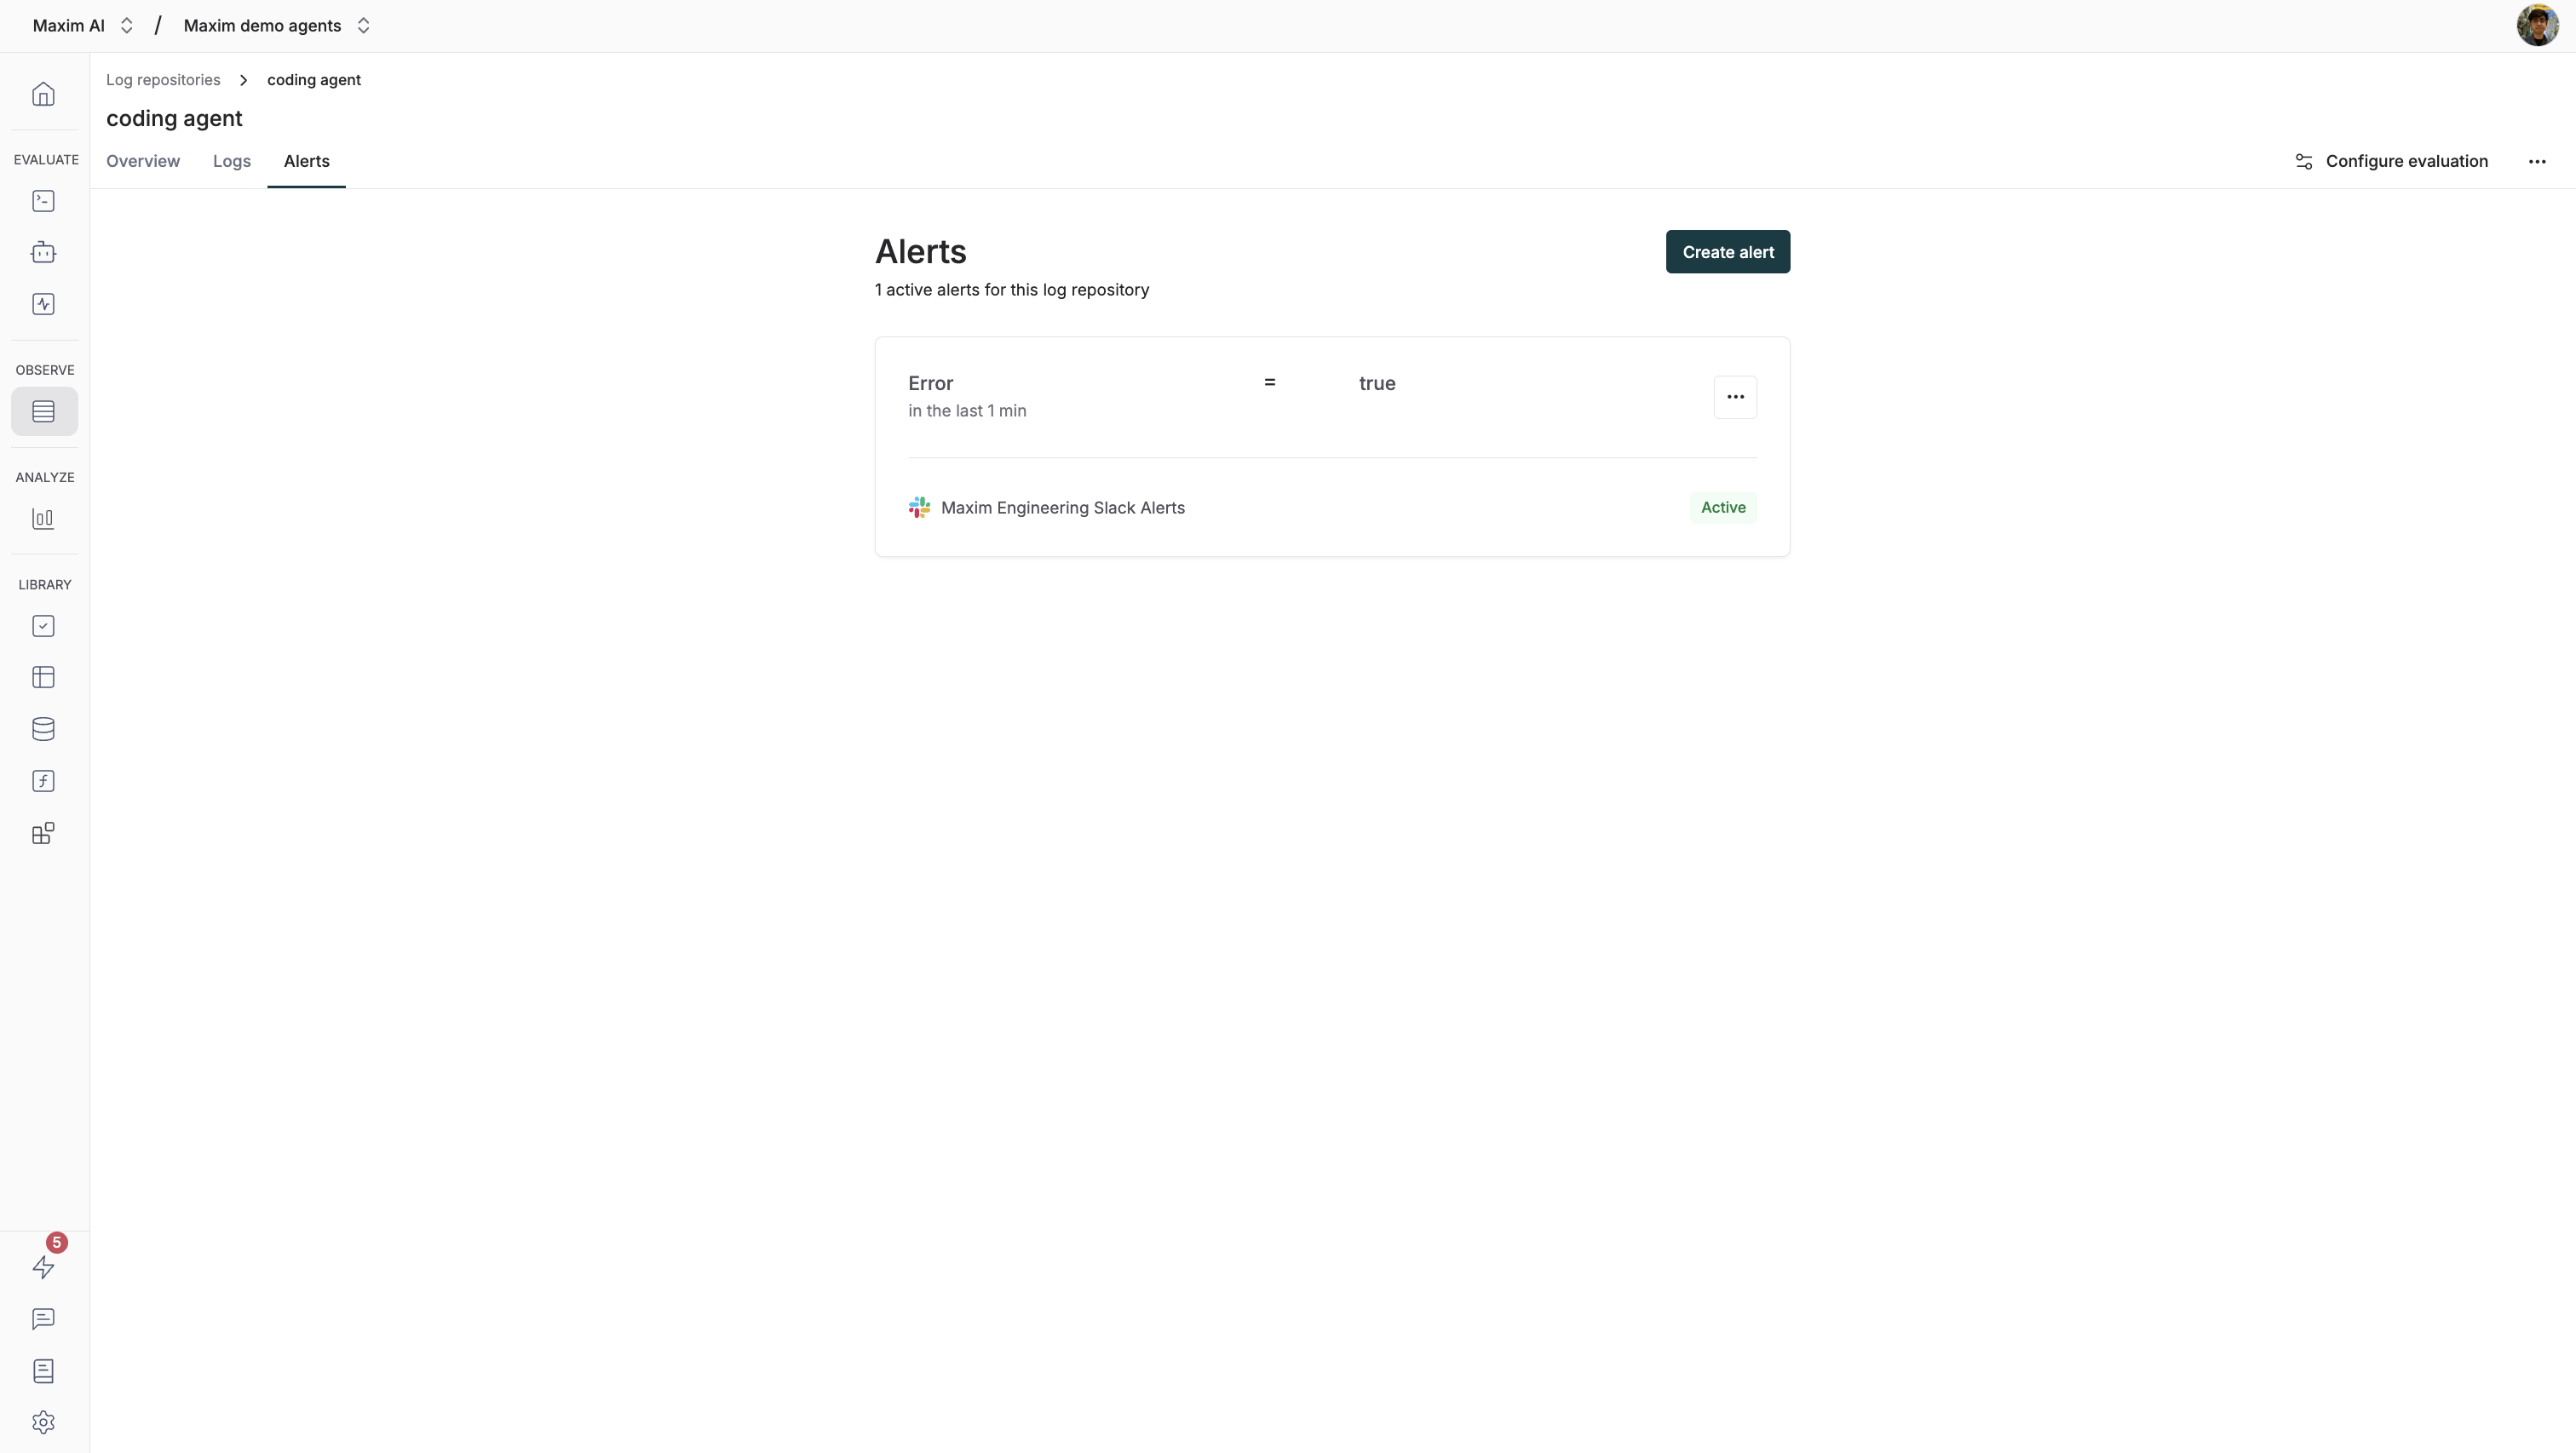
You can learn more on configuring alerts in the How to set up alerts section of the documentation.
Components of a Log
Now that you know how to navigate through a Log Repository, let us discuss what each log contains and what each component of the log and their properties represent.Session
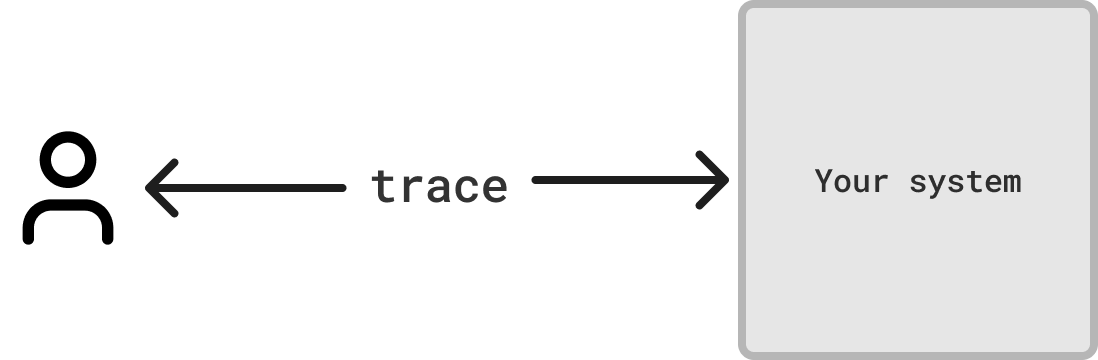
Session is a top level entity that captures all the multi-turn interactions of your system. For example, if you are building a chatbot, a session in Maxim logger is an entire conversation of a user with your chatbot. Sessions persist across multiple interactions and remain active until explicitly closed - you can keep on adding different traces to it over the course of time unless you want to explicitly close the session.Trace
Span
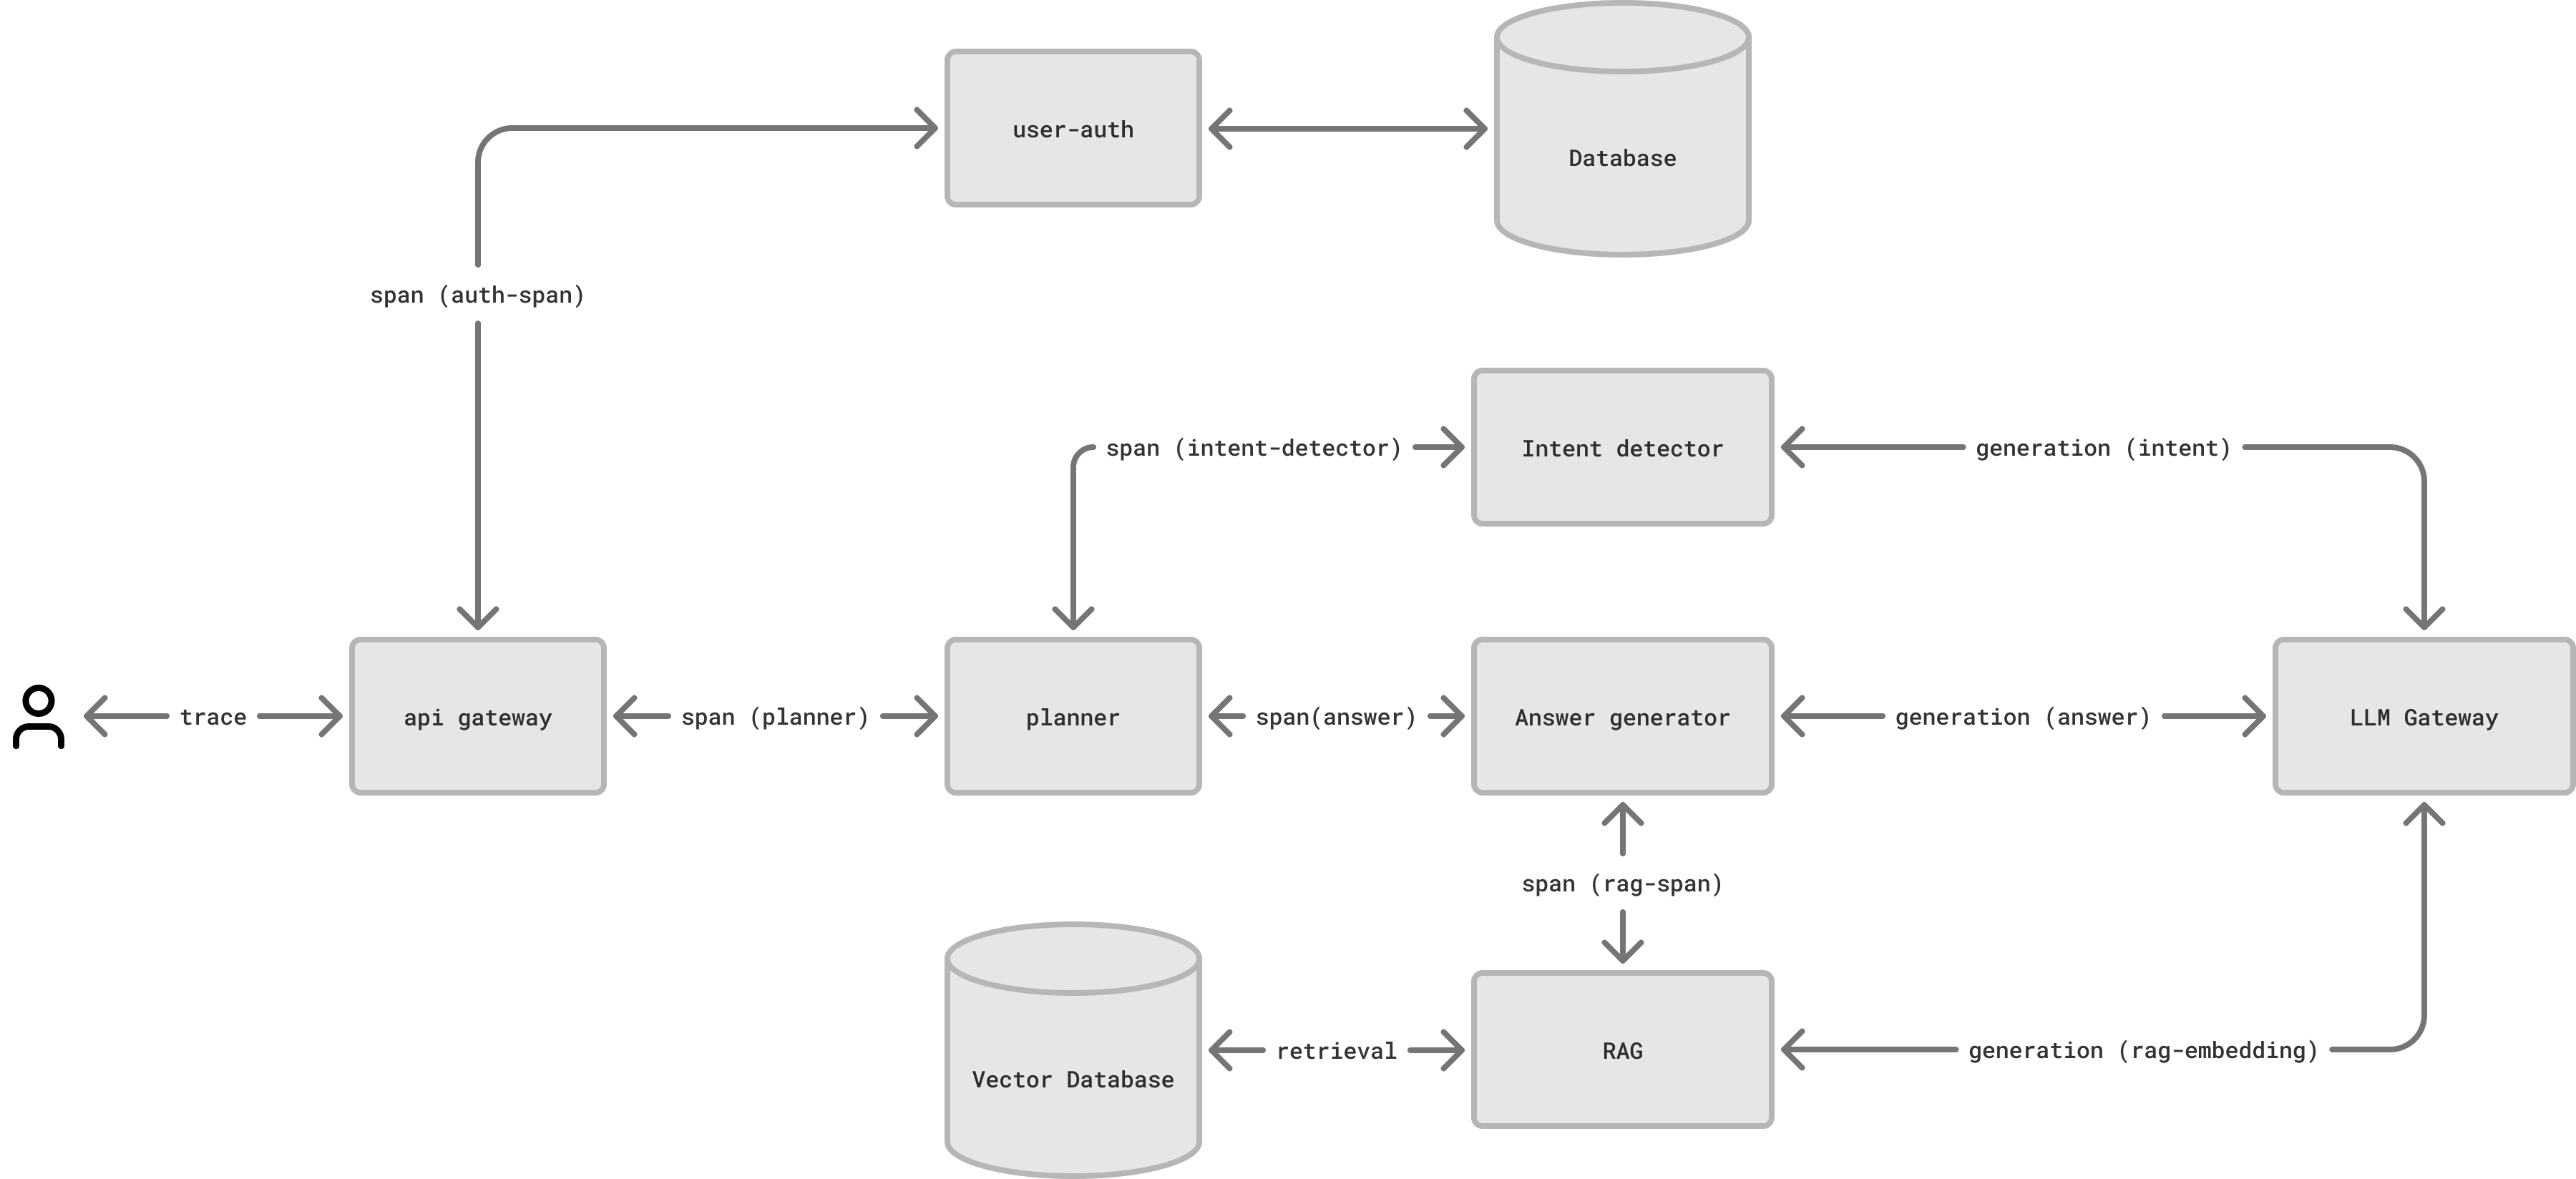
A span can have other spans as children. You can create as many subspans as you want to logically group flows within a span.
Event
Generation
A Generation represents a single Large Language Model (LLM) call within a trace or span. Multiple generations can exist within a single trace/span.Structure
- Maxim SDK uses OpenAI’s LLM call structure as the standard format.
- All incoming LLM calls are automatically converted to match OpenAI’s structure via SDK.
- This standardization ensures consistent handling across different LLM providers.
Retrieval
A Retrieval represents a query operation to fetch relevant context or information from a knowledge base or vector database within a trace or span. It is commonly used in RAG (Retrieval Augmented Generation) workflows, where context needs to be fetched before making LLM calls.Tool Call
Tool Call represents an external system or service call done based on an LLM response. Each tool call can be logged separately to track its input, output and latency.Schedule a demo to see how Maxim AI helps teams ship reliable agents.