Log dashboards help you visualize key metrics from your production logs. Create custom views by combining data from multiple repositories and applying filters to track what matters most.

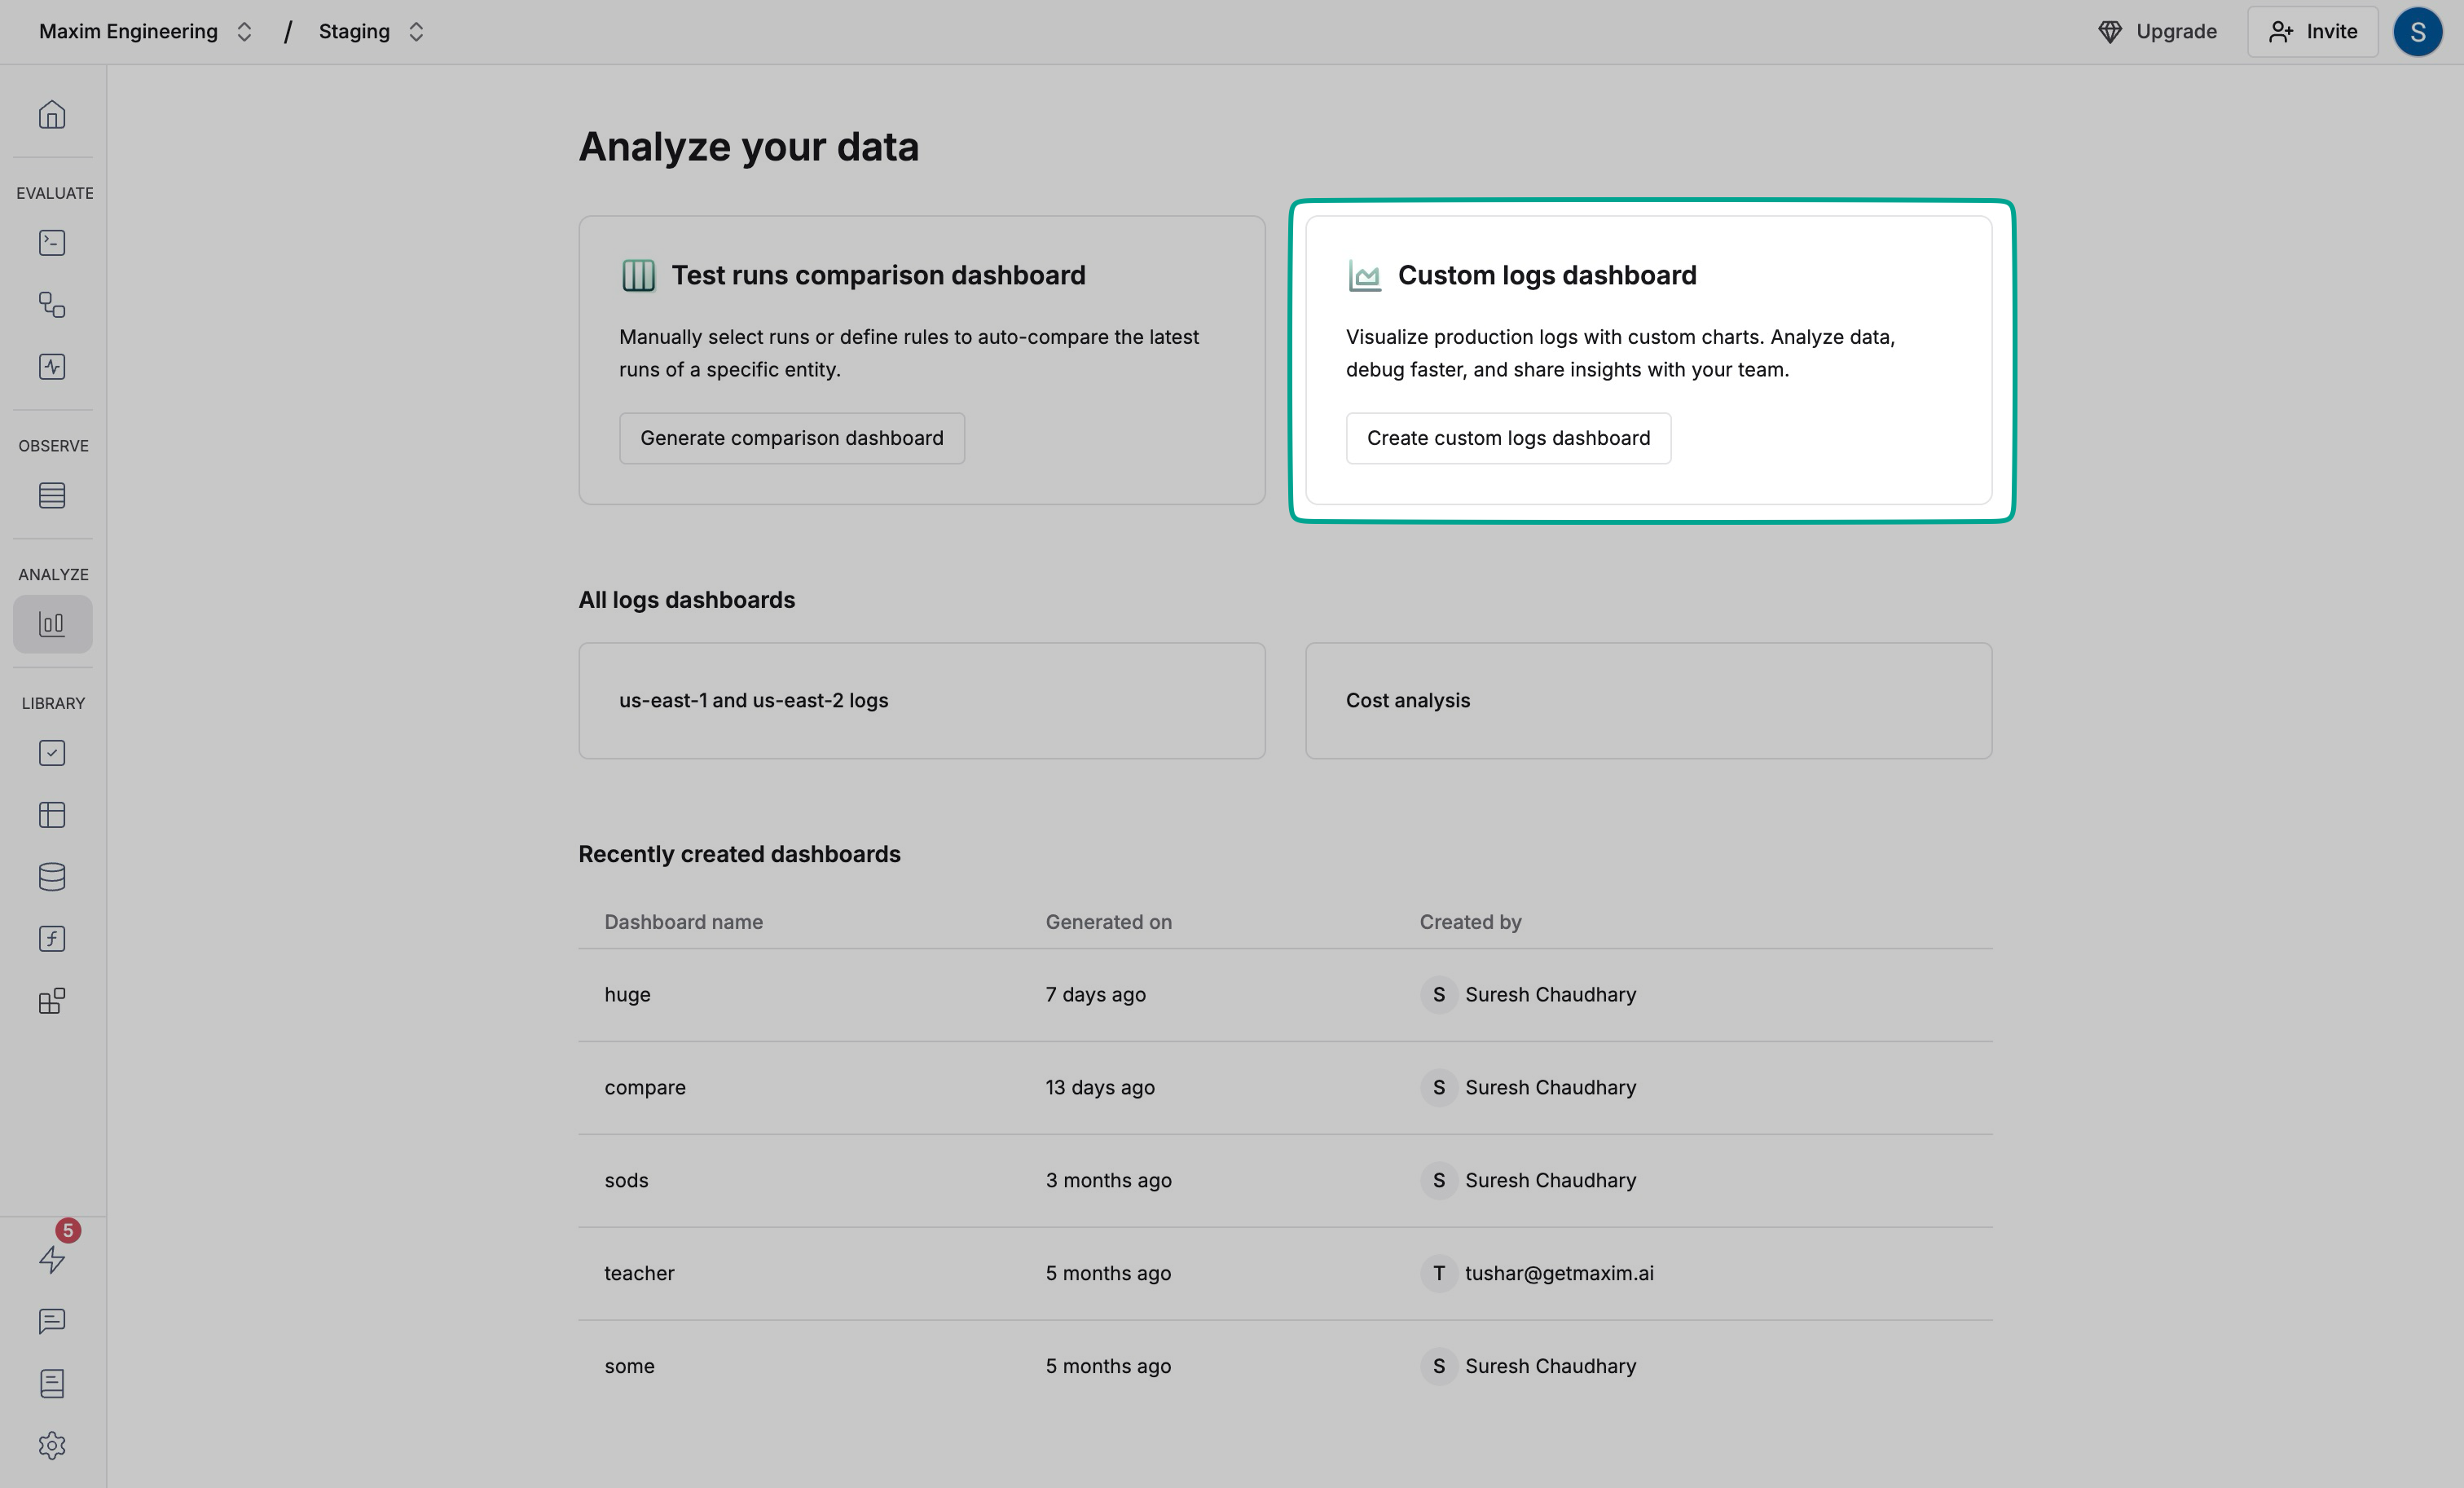
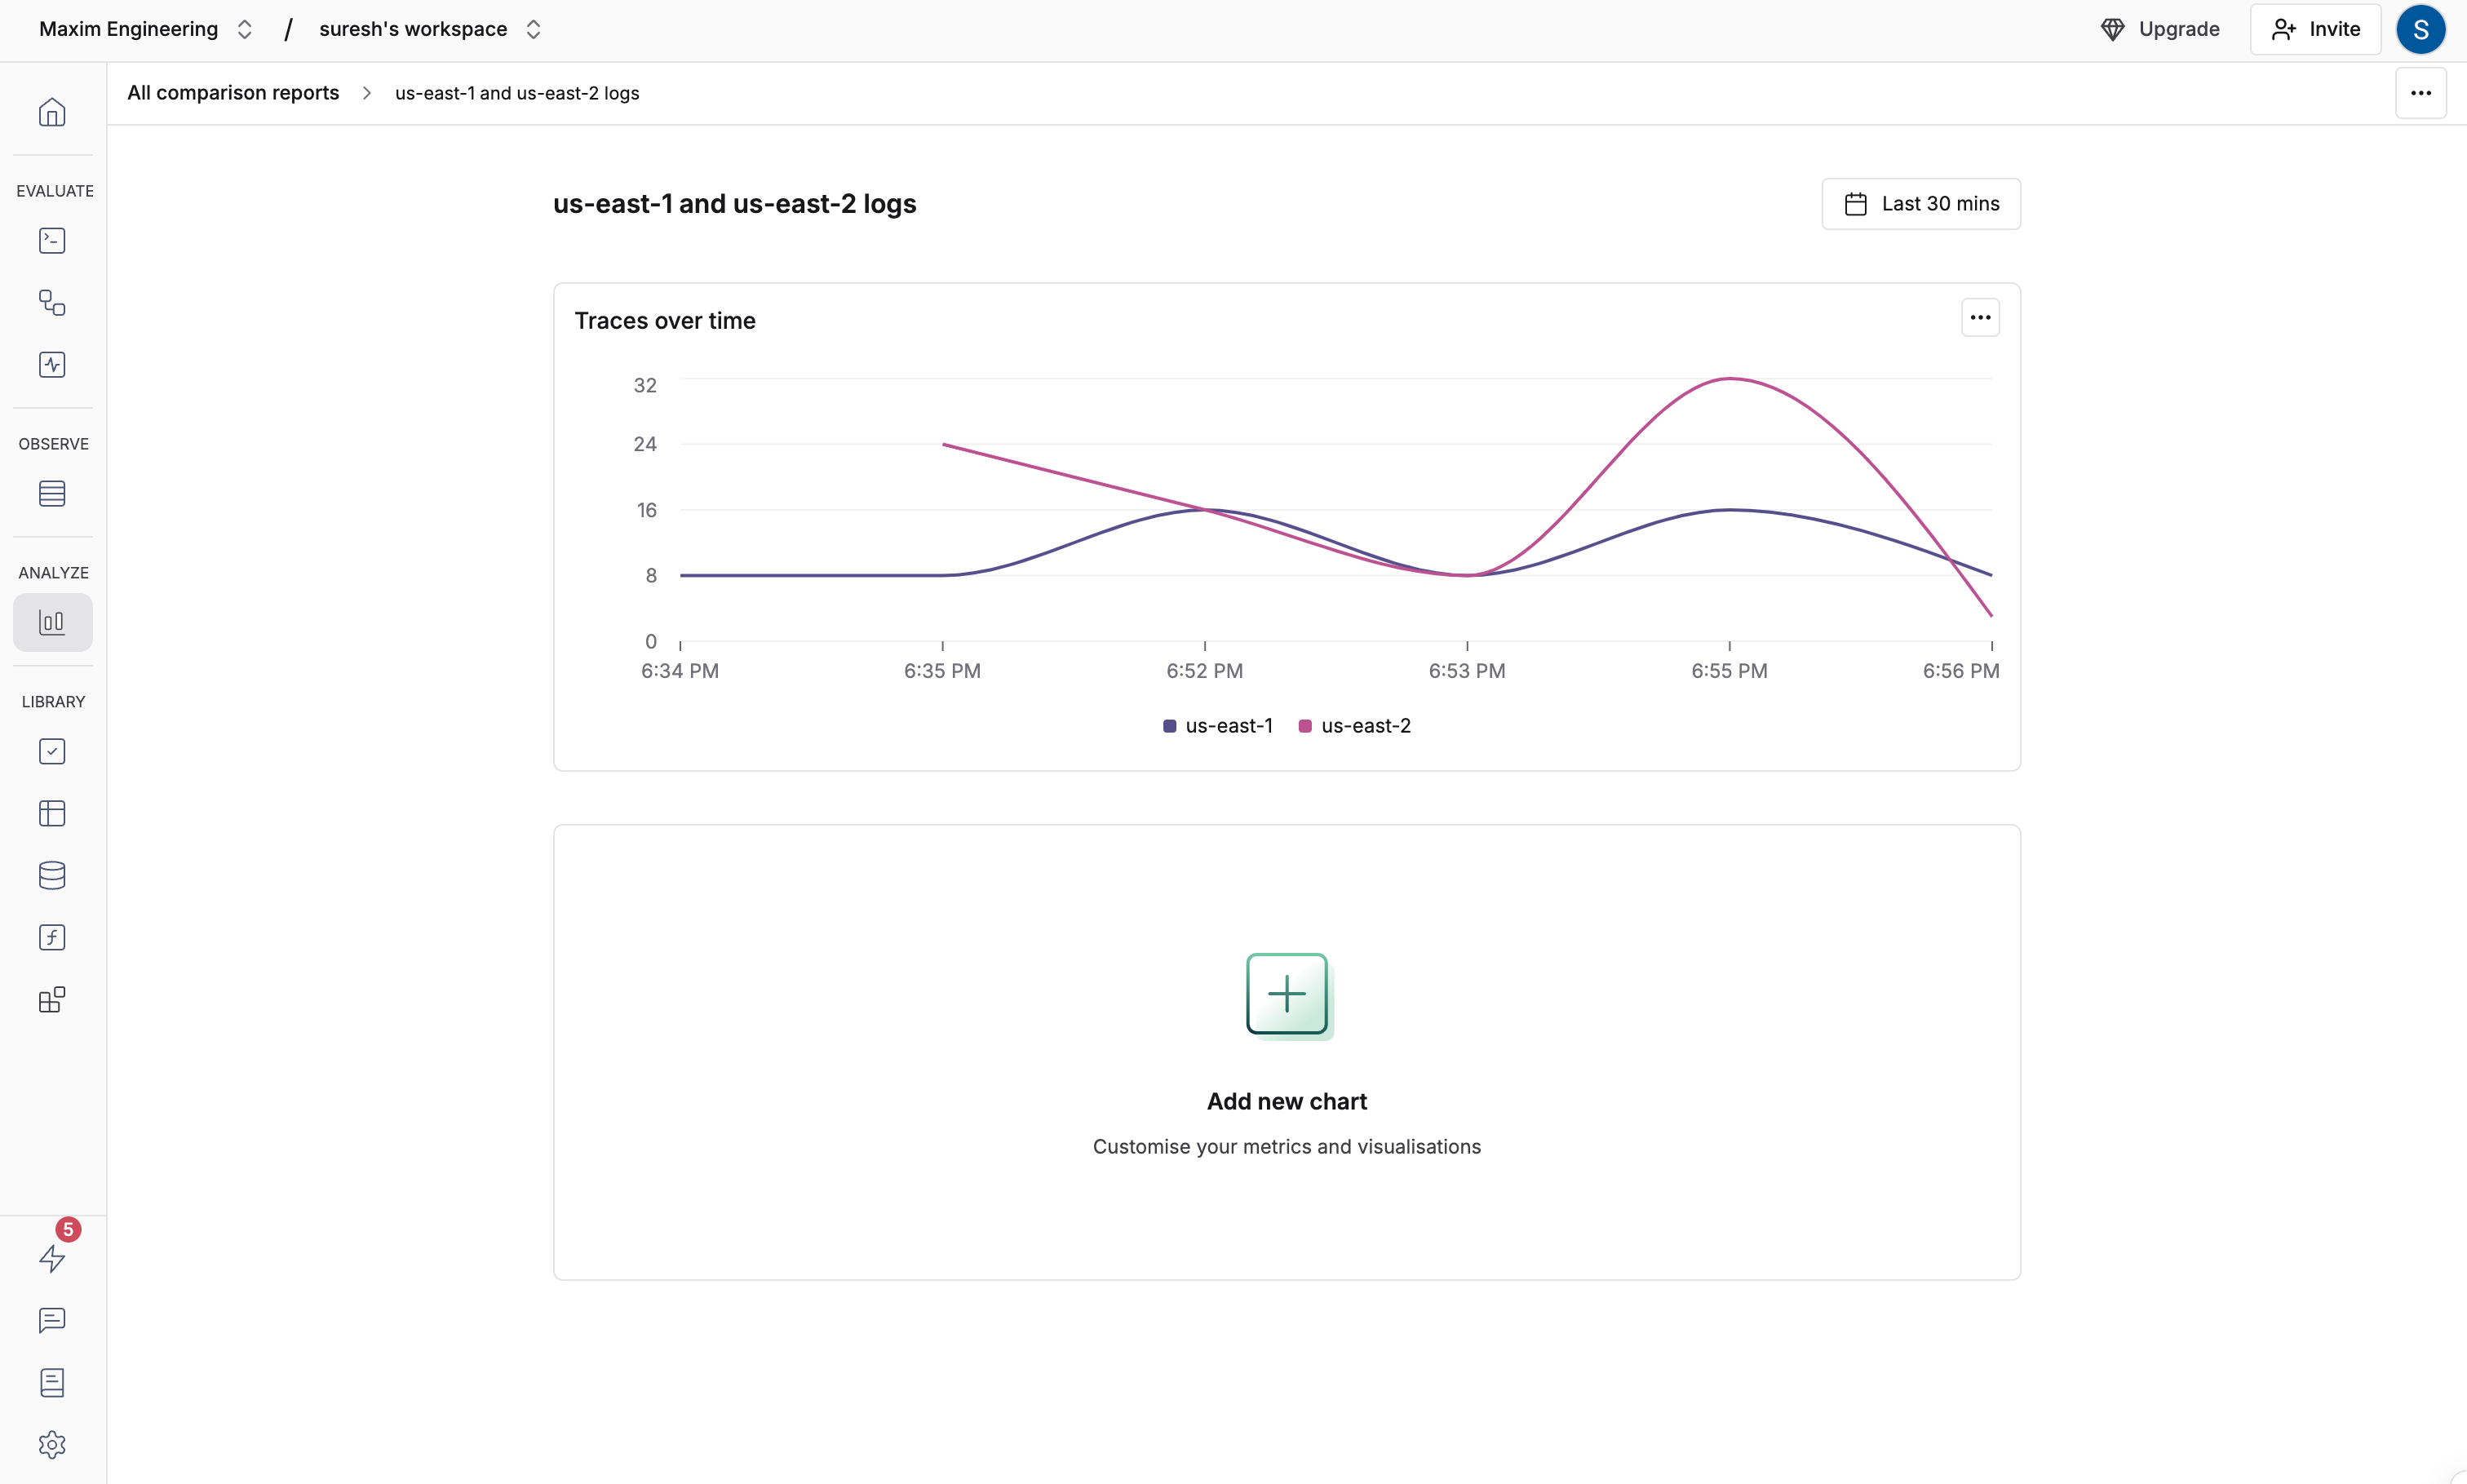
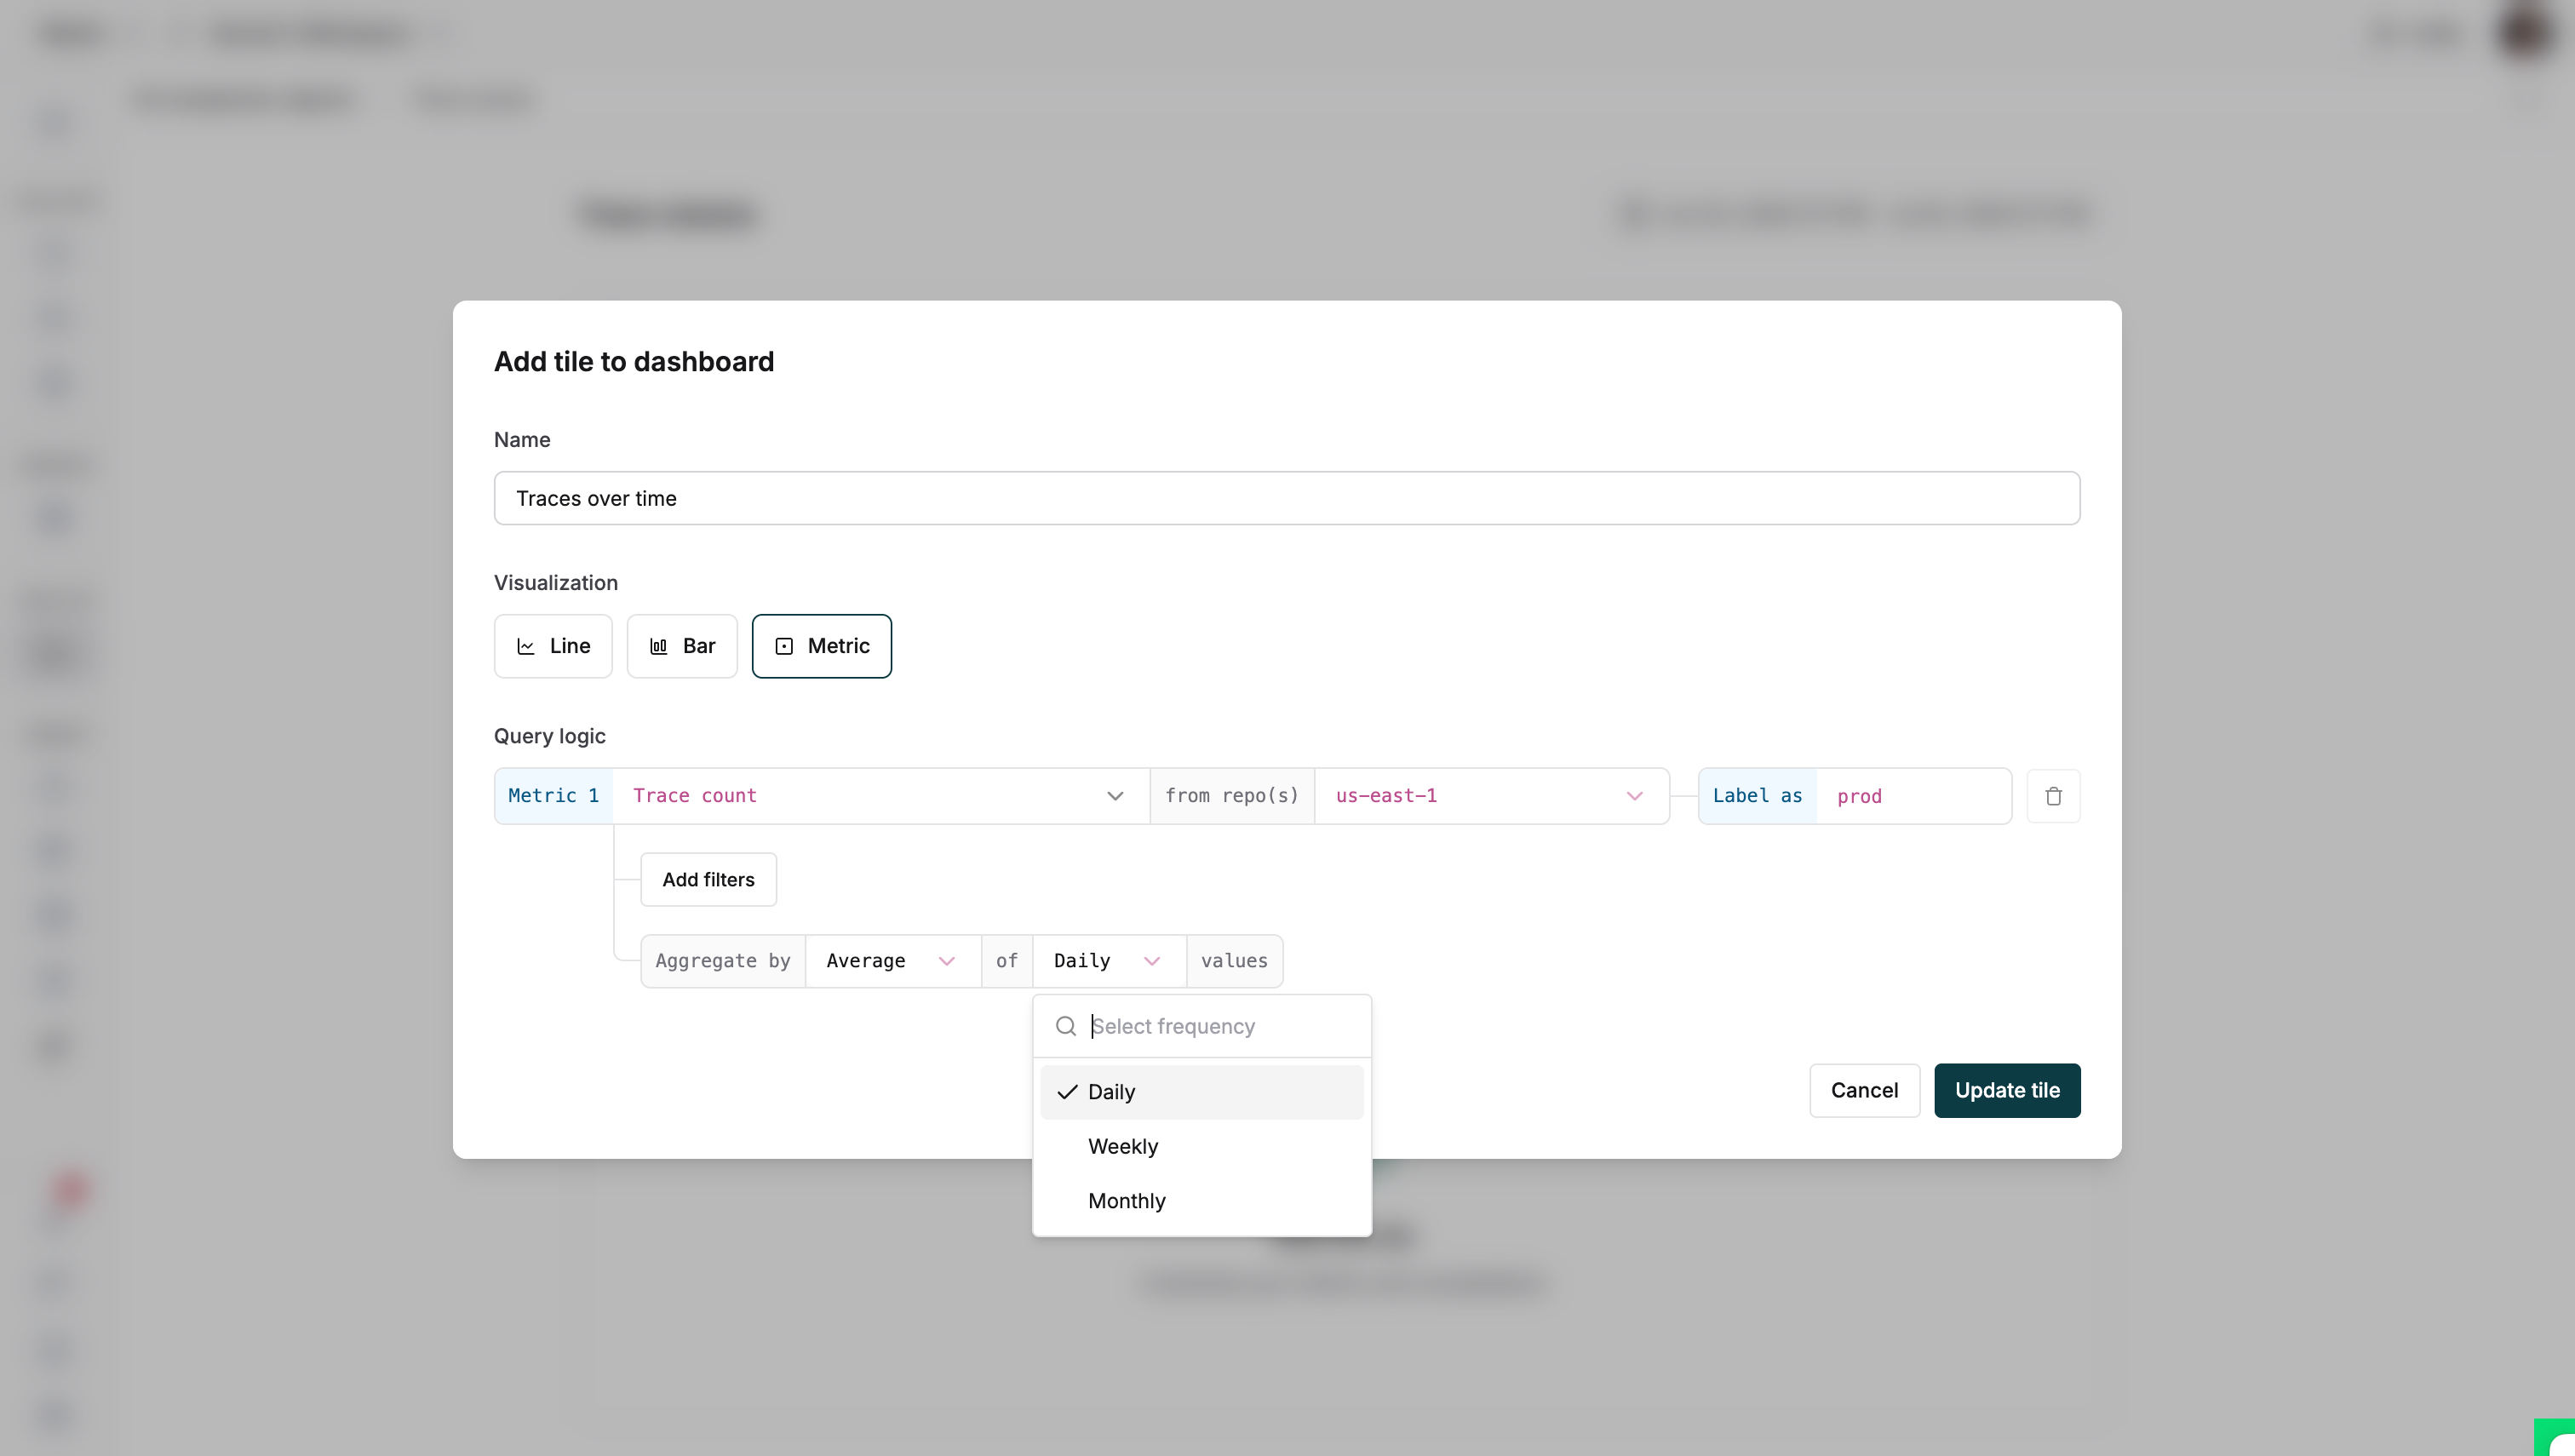
Creating your first custom dashboard

1

Create a dashboard

Select Dashboards in the left sidebar and click “Create custom logs dashboard” Create dashboard
2

Name your dashboard

Enter a name that describes the dashboard purpose Name your dashboard
3

Configure metrics

Add charts to monitor key metrics:
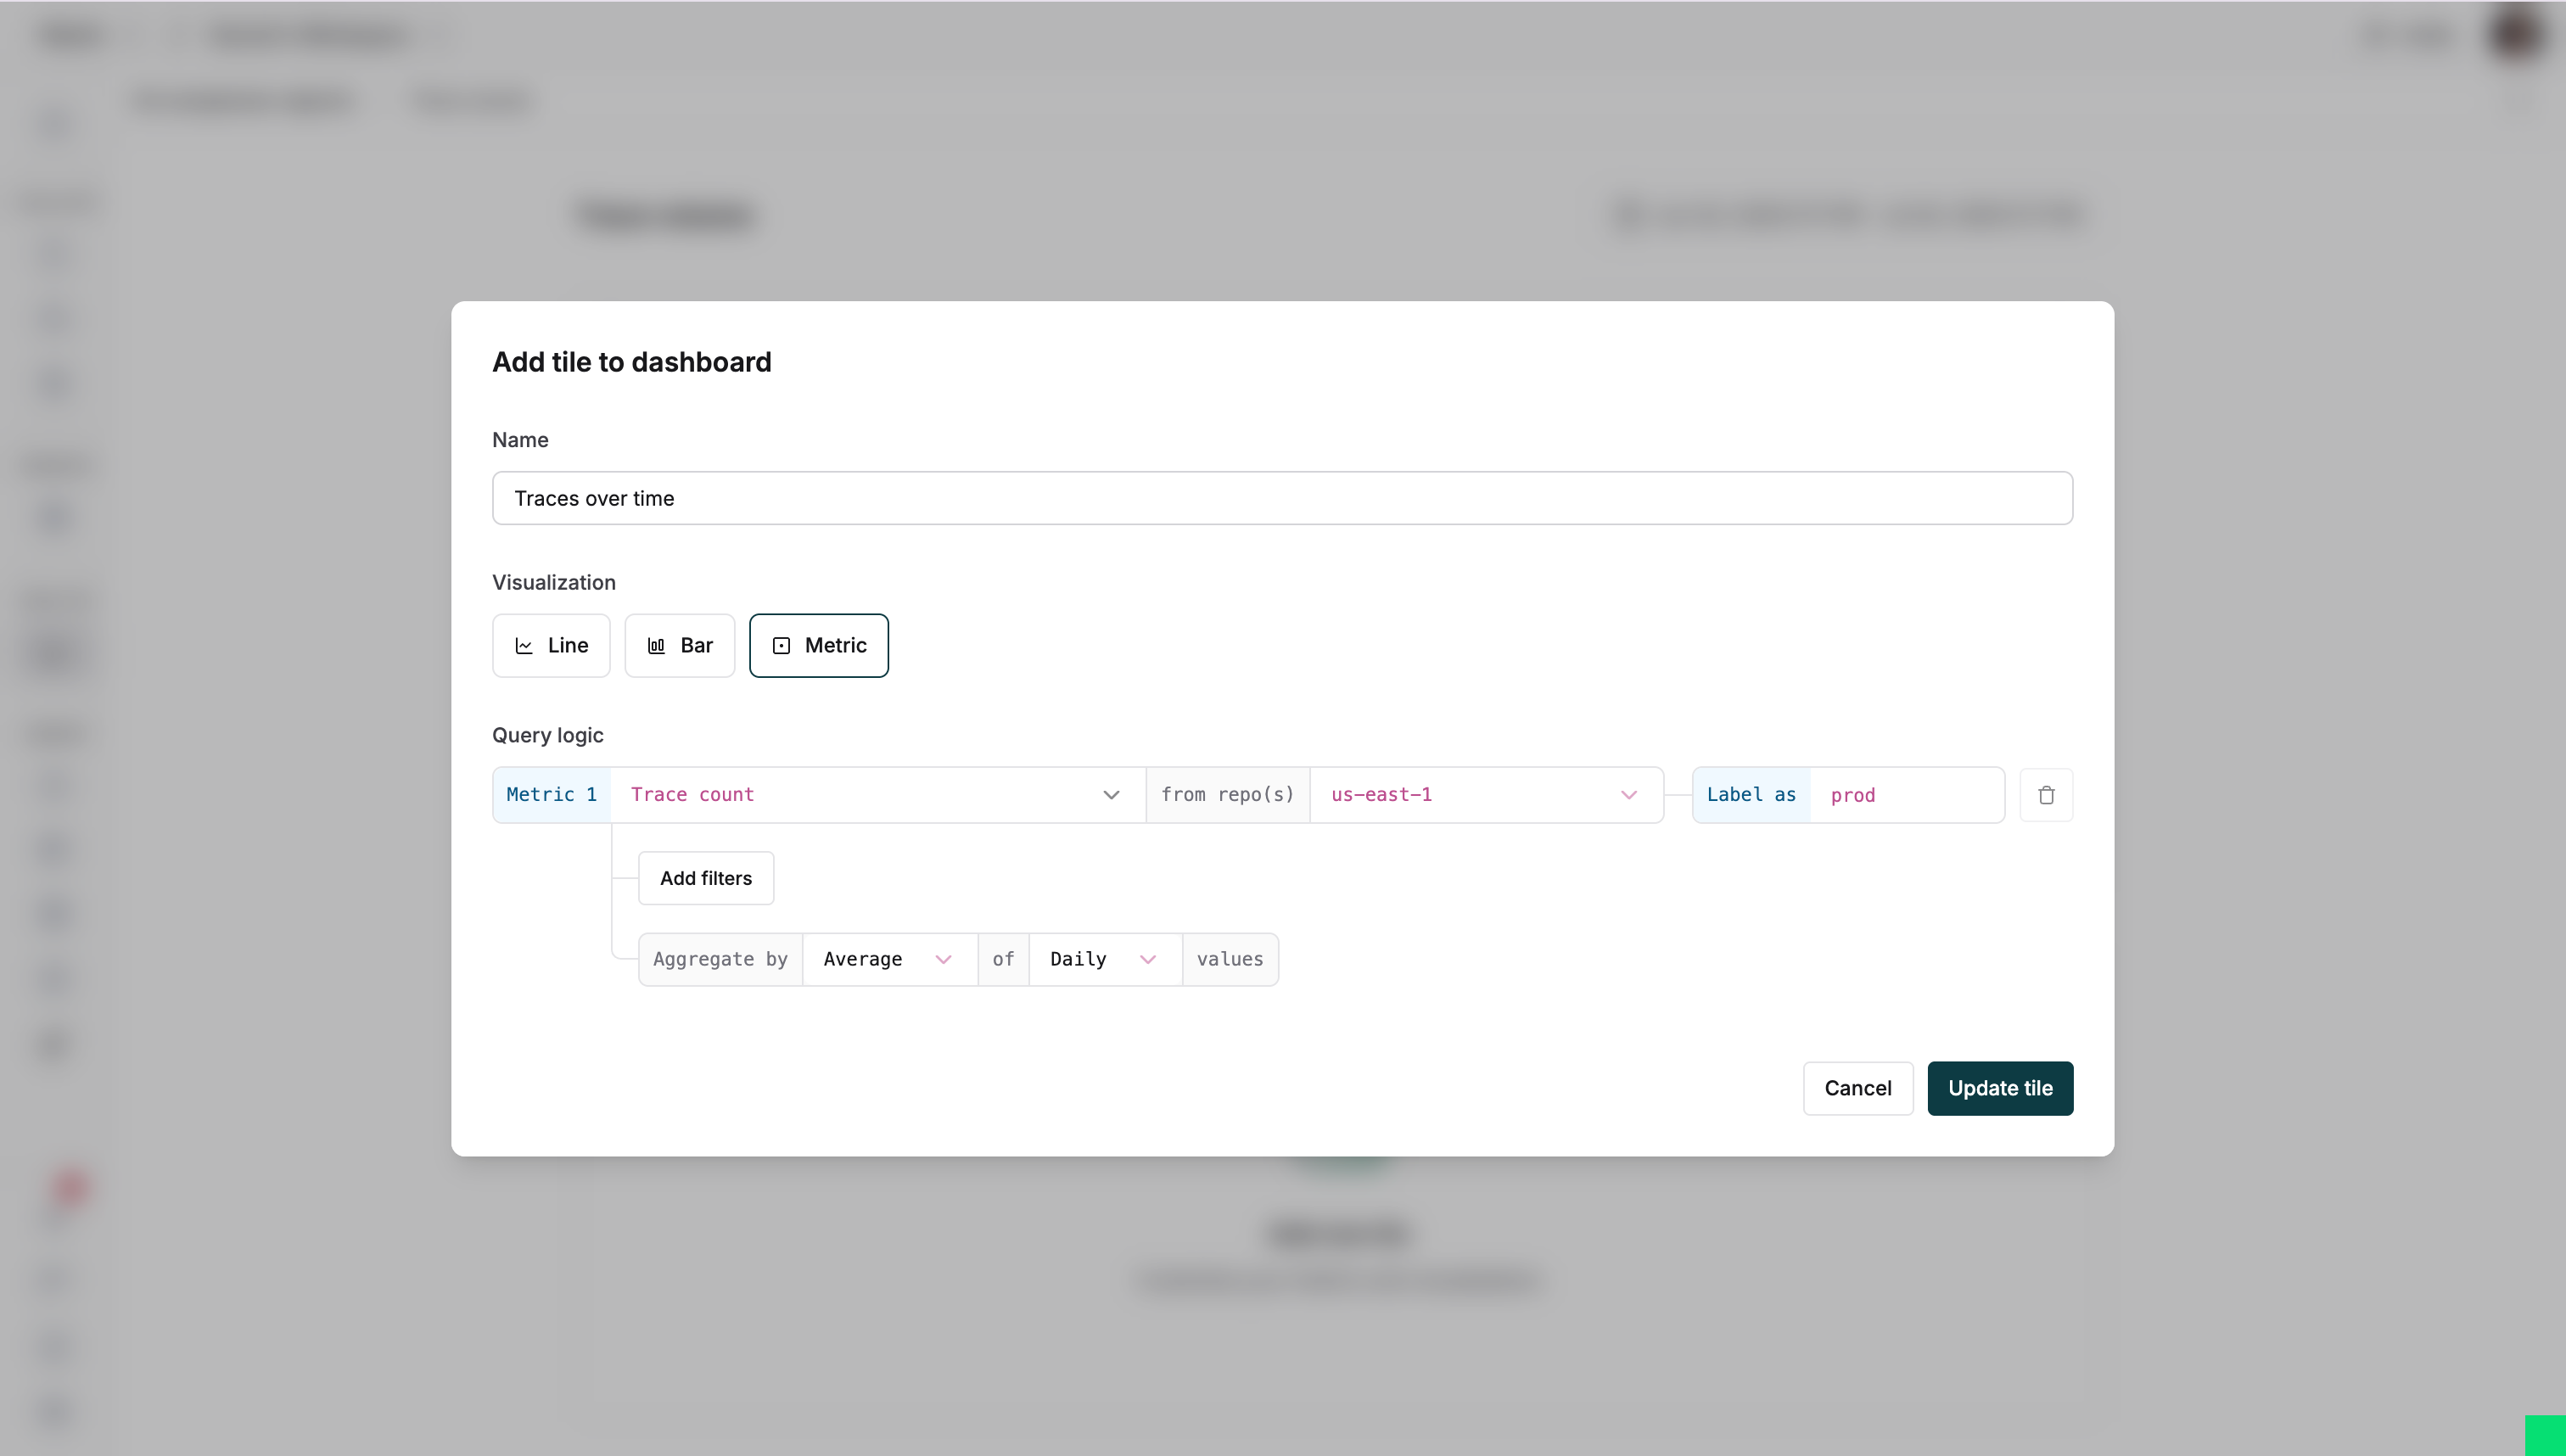
  1. Choose a visualization type
  2. Select metrics (trace count, latency, token usage)
  3. Pick repositories to analyze
Compare metrics across applications by selecting multiple repositories
Add chart to dashboard
4

View your dashboard

Track metrics over time with real-time updates Log dashboard trace count chart
5

Analyze log details

Interact with charts to dive deeper:
  • Hover to see exact data points
  • Click any point to view corresponding logs
  • Apply filters and time ranges to identify specific logs

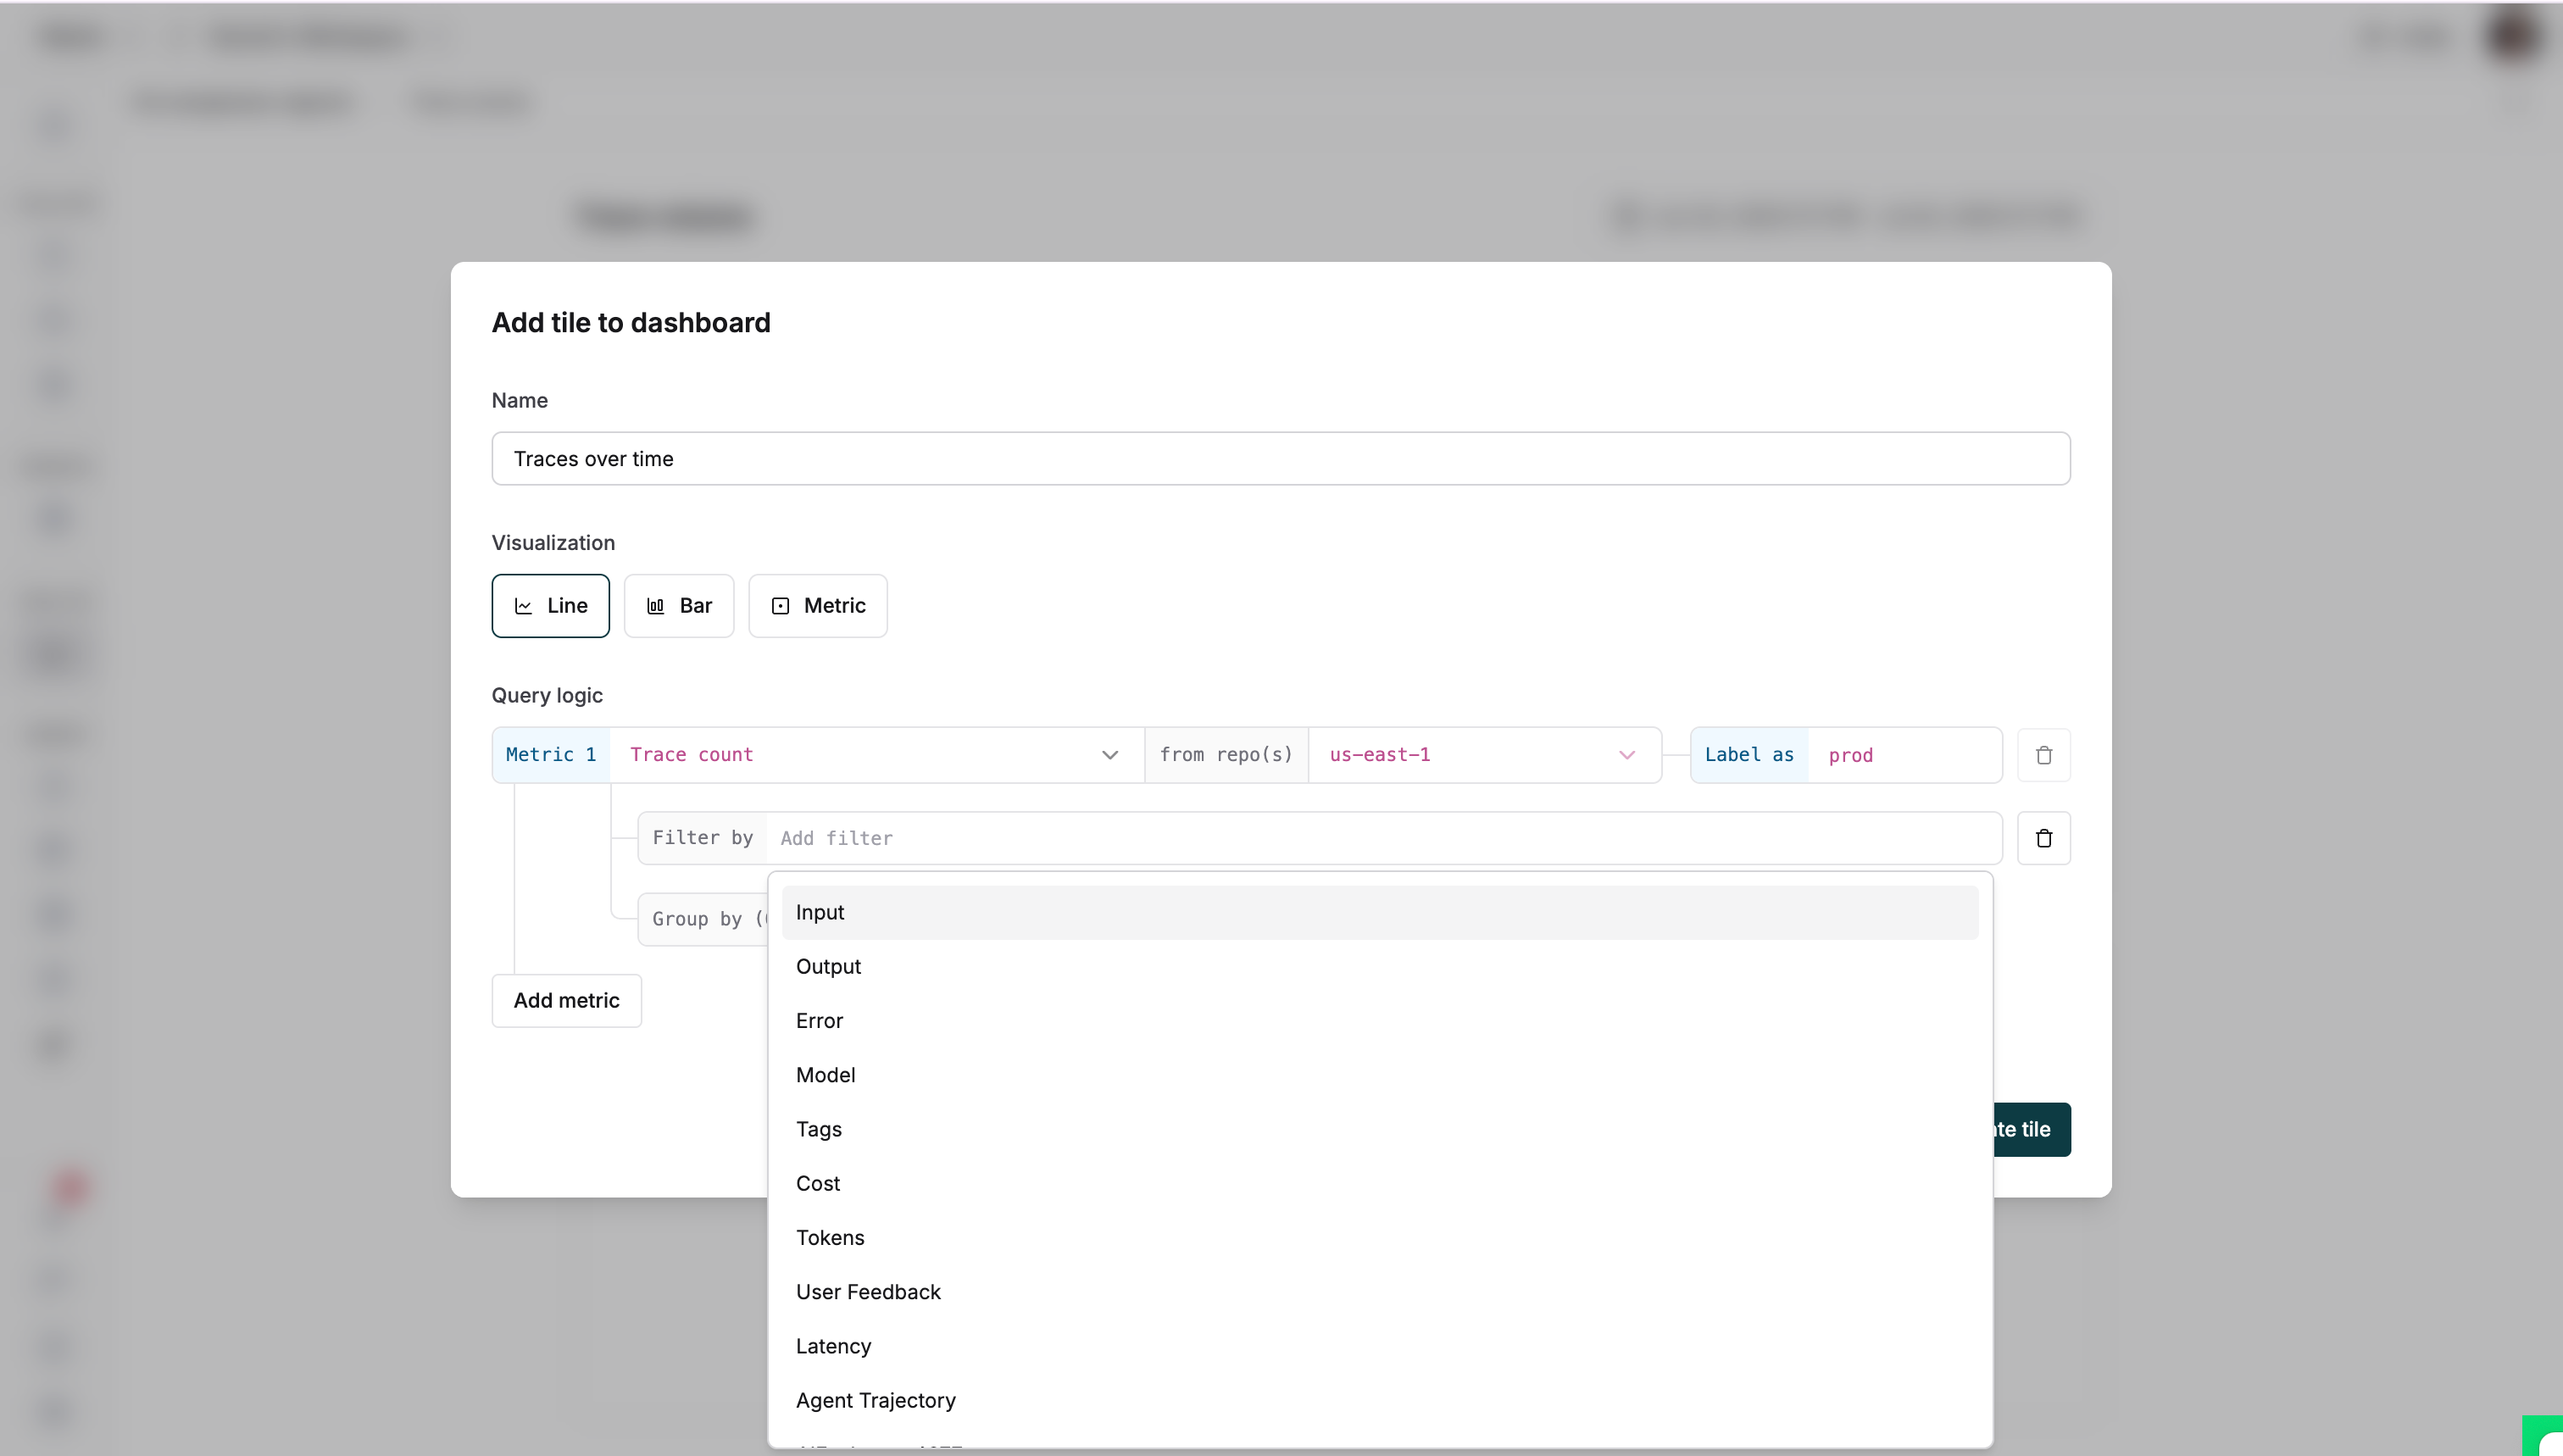
Advanced configurations

Add filters

Customize charts with filters to track:
  • Specific user segments
  • High-latency requests
  • Error patterns
Add filters to metrics

Data aggregation

Group data to analyze patterns:
  • Select Group by to segment data by model, tags, or repositories
Data aggregation configure
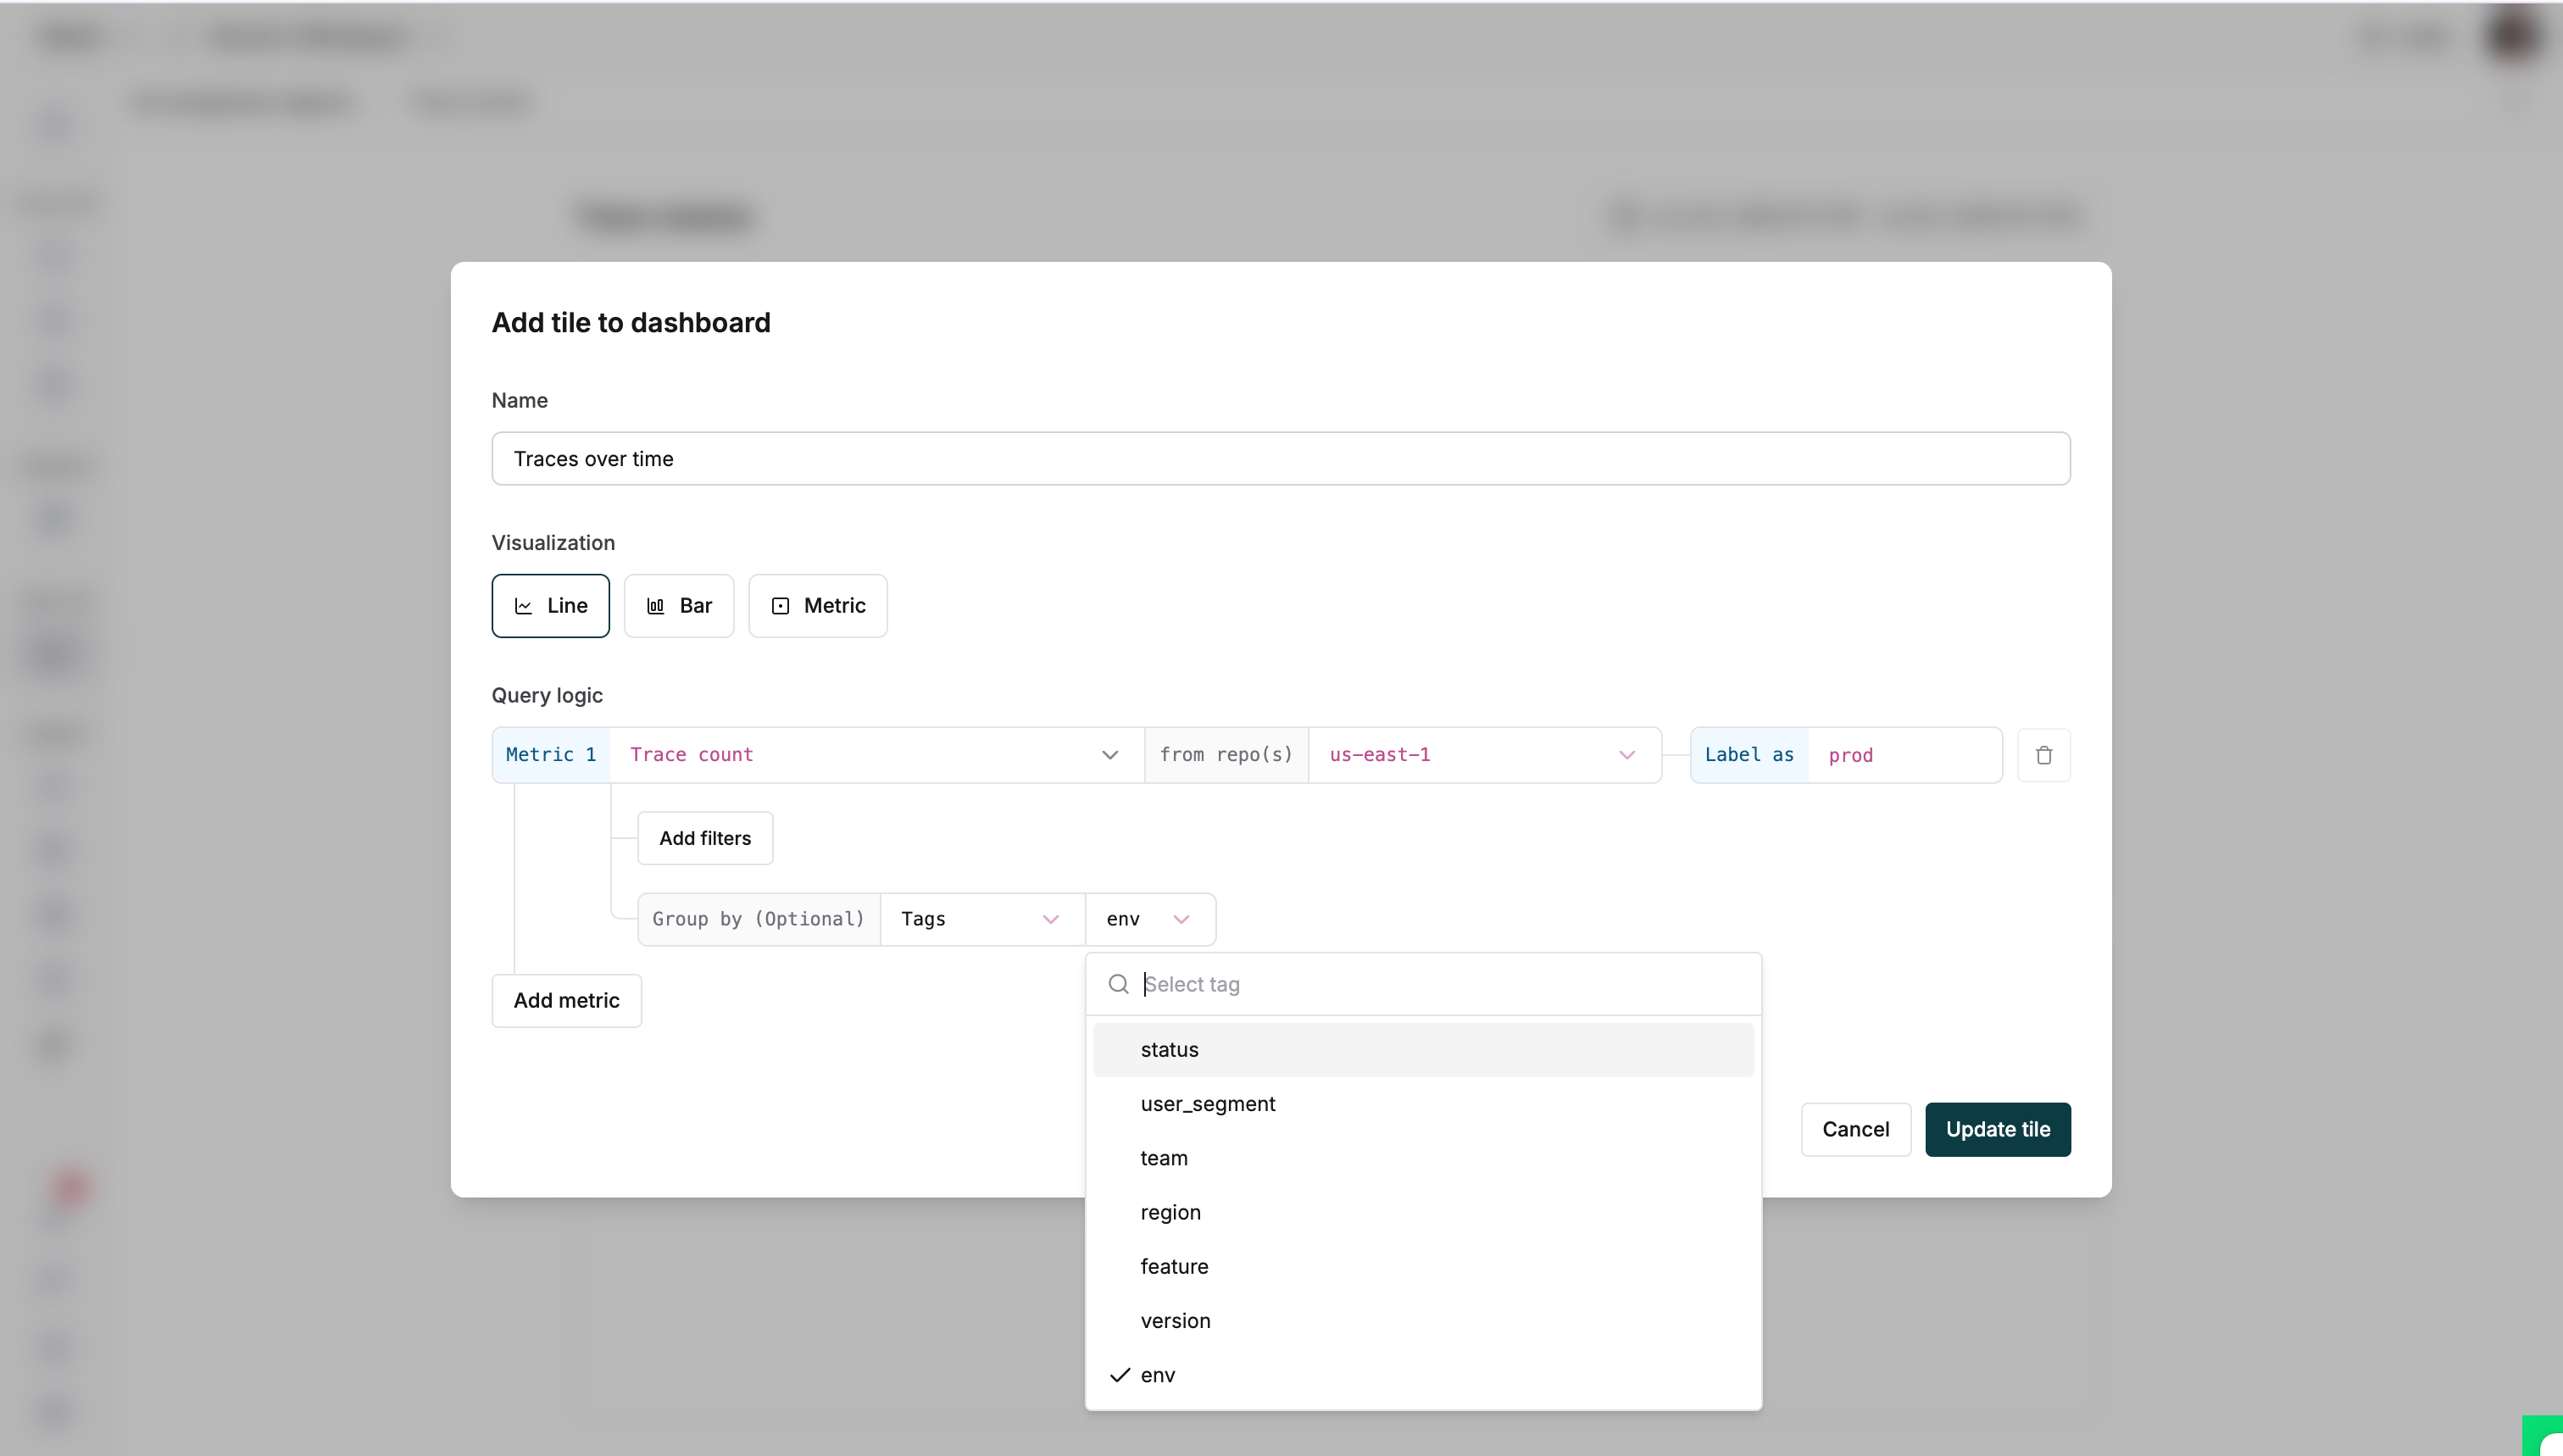
  • Once configured, save the entry to see your data
Grouped data chart For metric data:
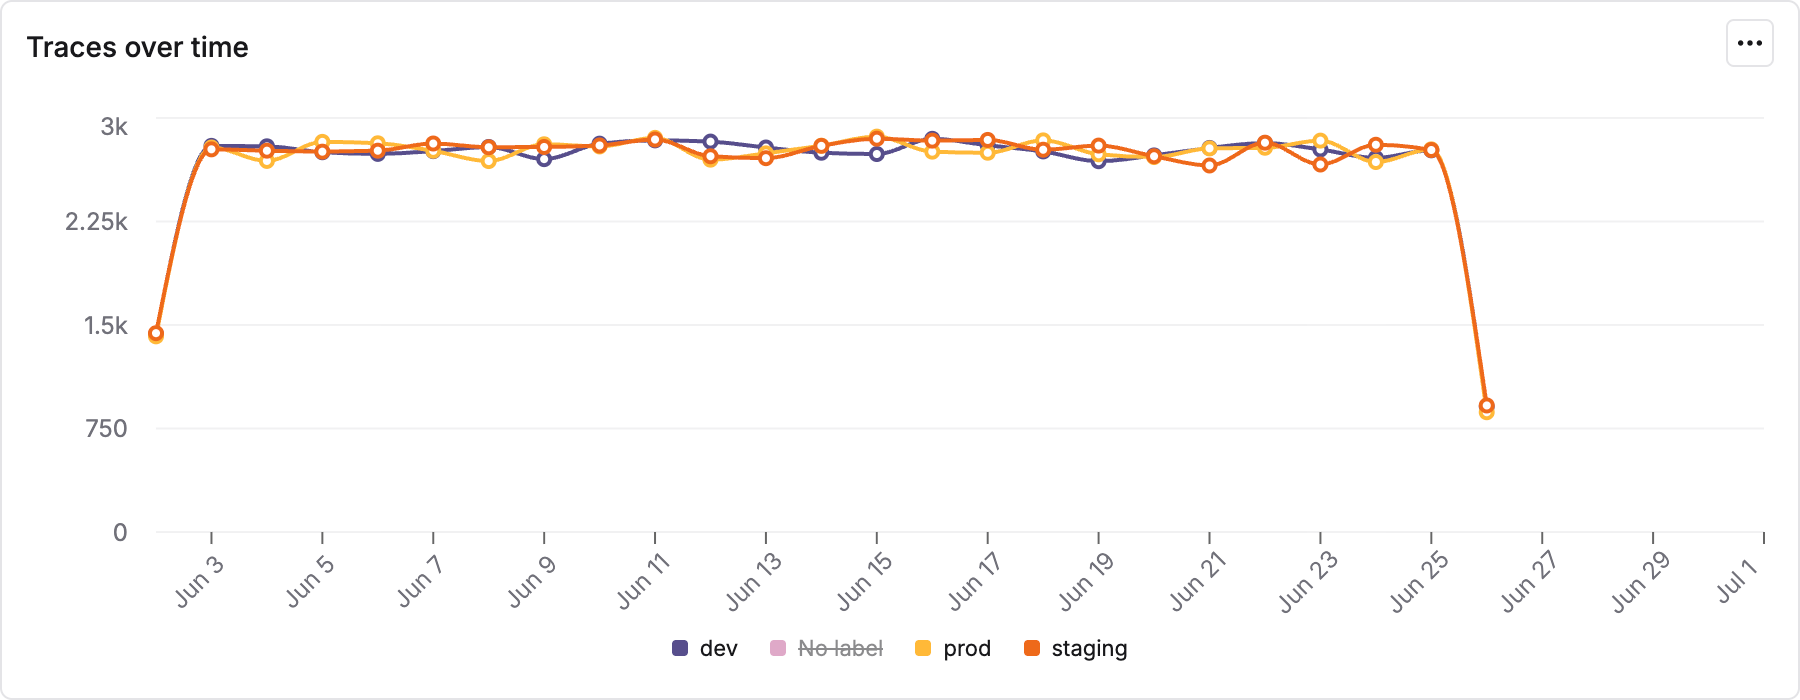
  • Select metric visualization
  • Choose time-based aggregation
  • Pick sum for total traces or average for mean values
  • Set aggregation frequency (daily, weekly, monthly)
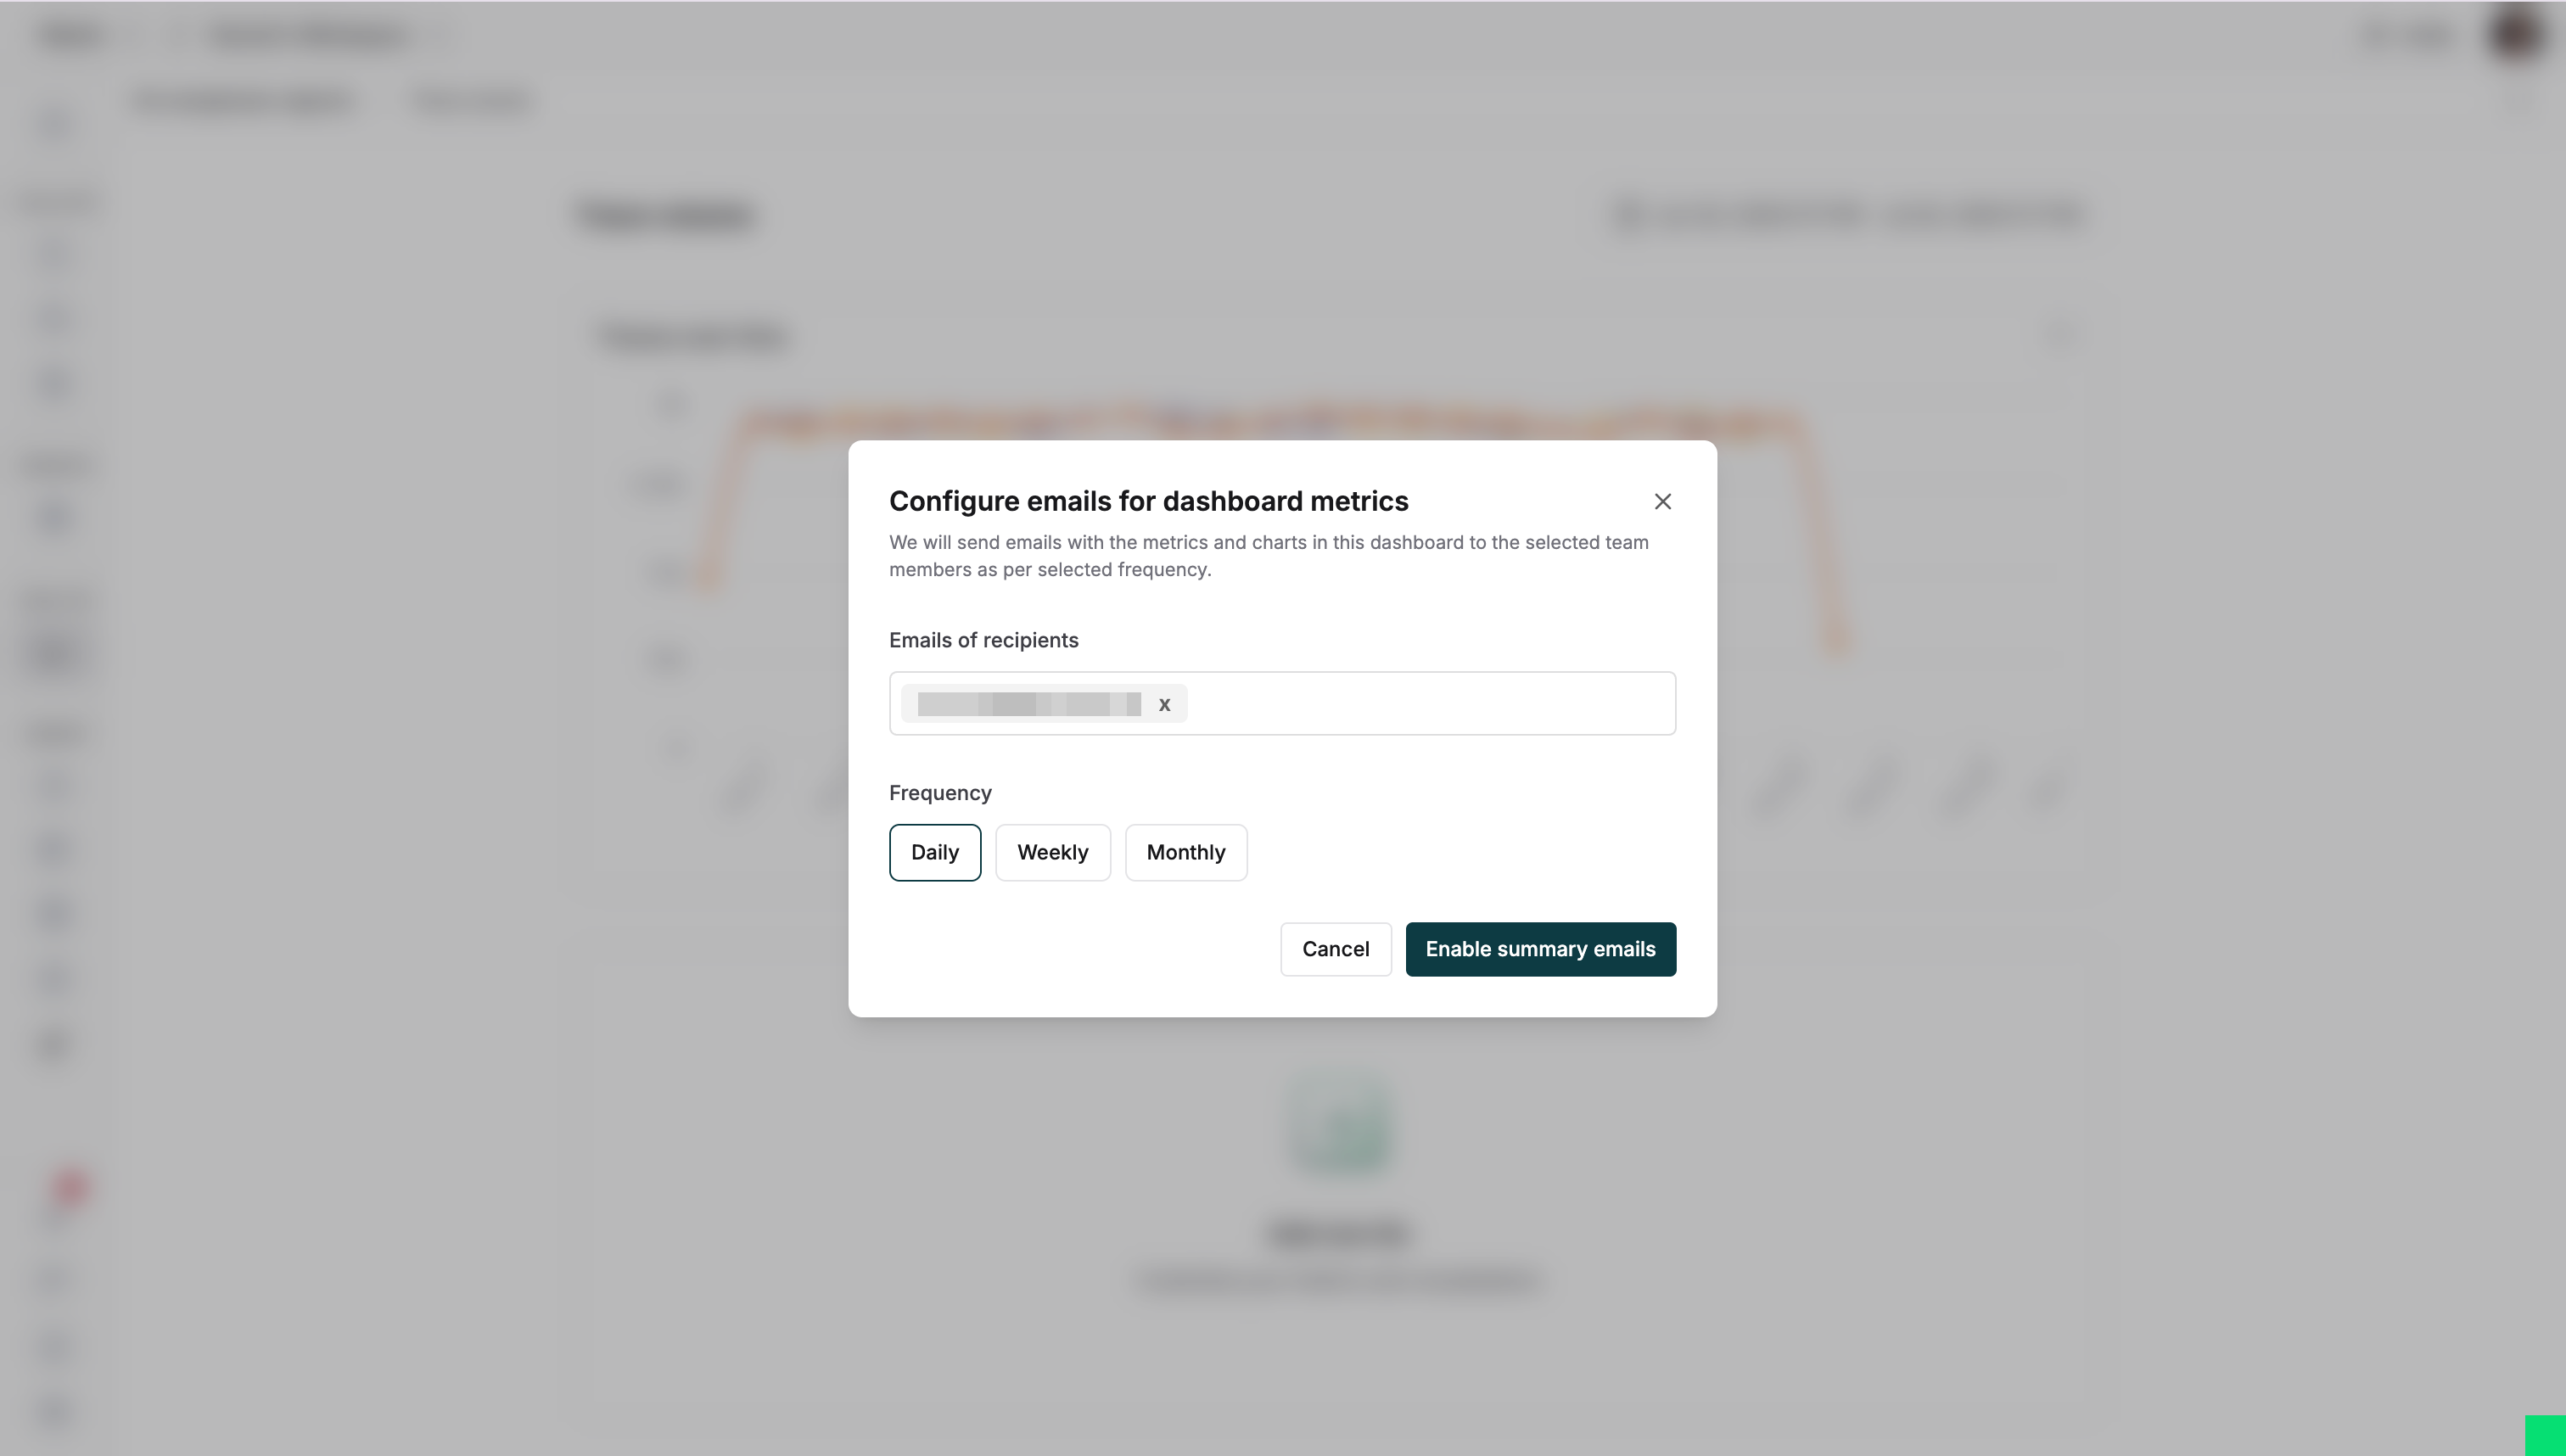
Data aggregation

Summary emails

Get dashboard updates directly in your inbox:
  1. Click the three-dot menu and select “Configure summary emails” Email summary option
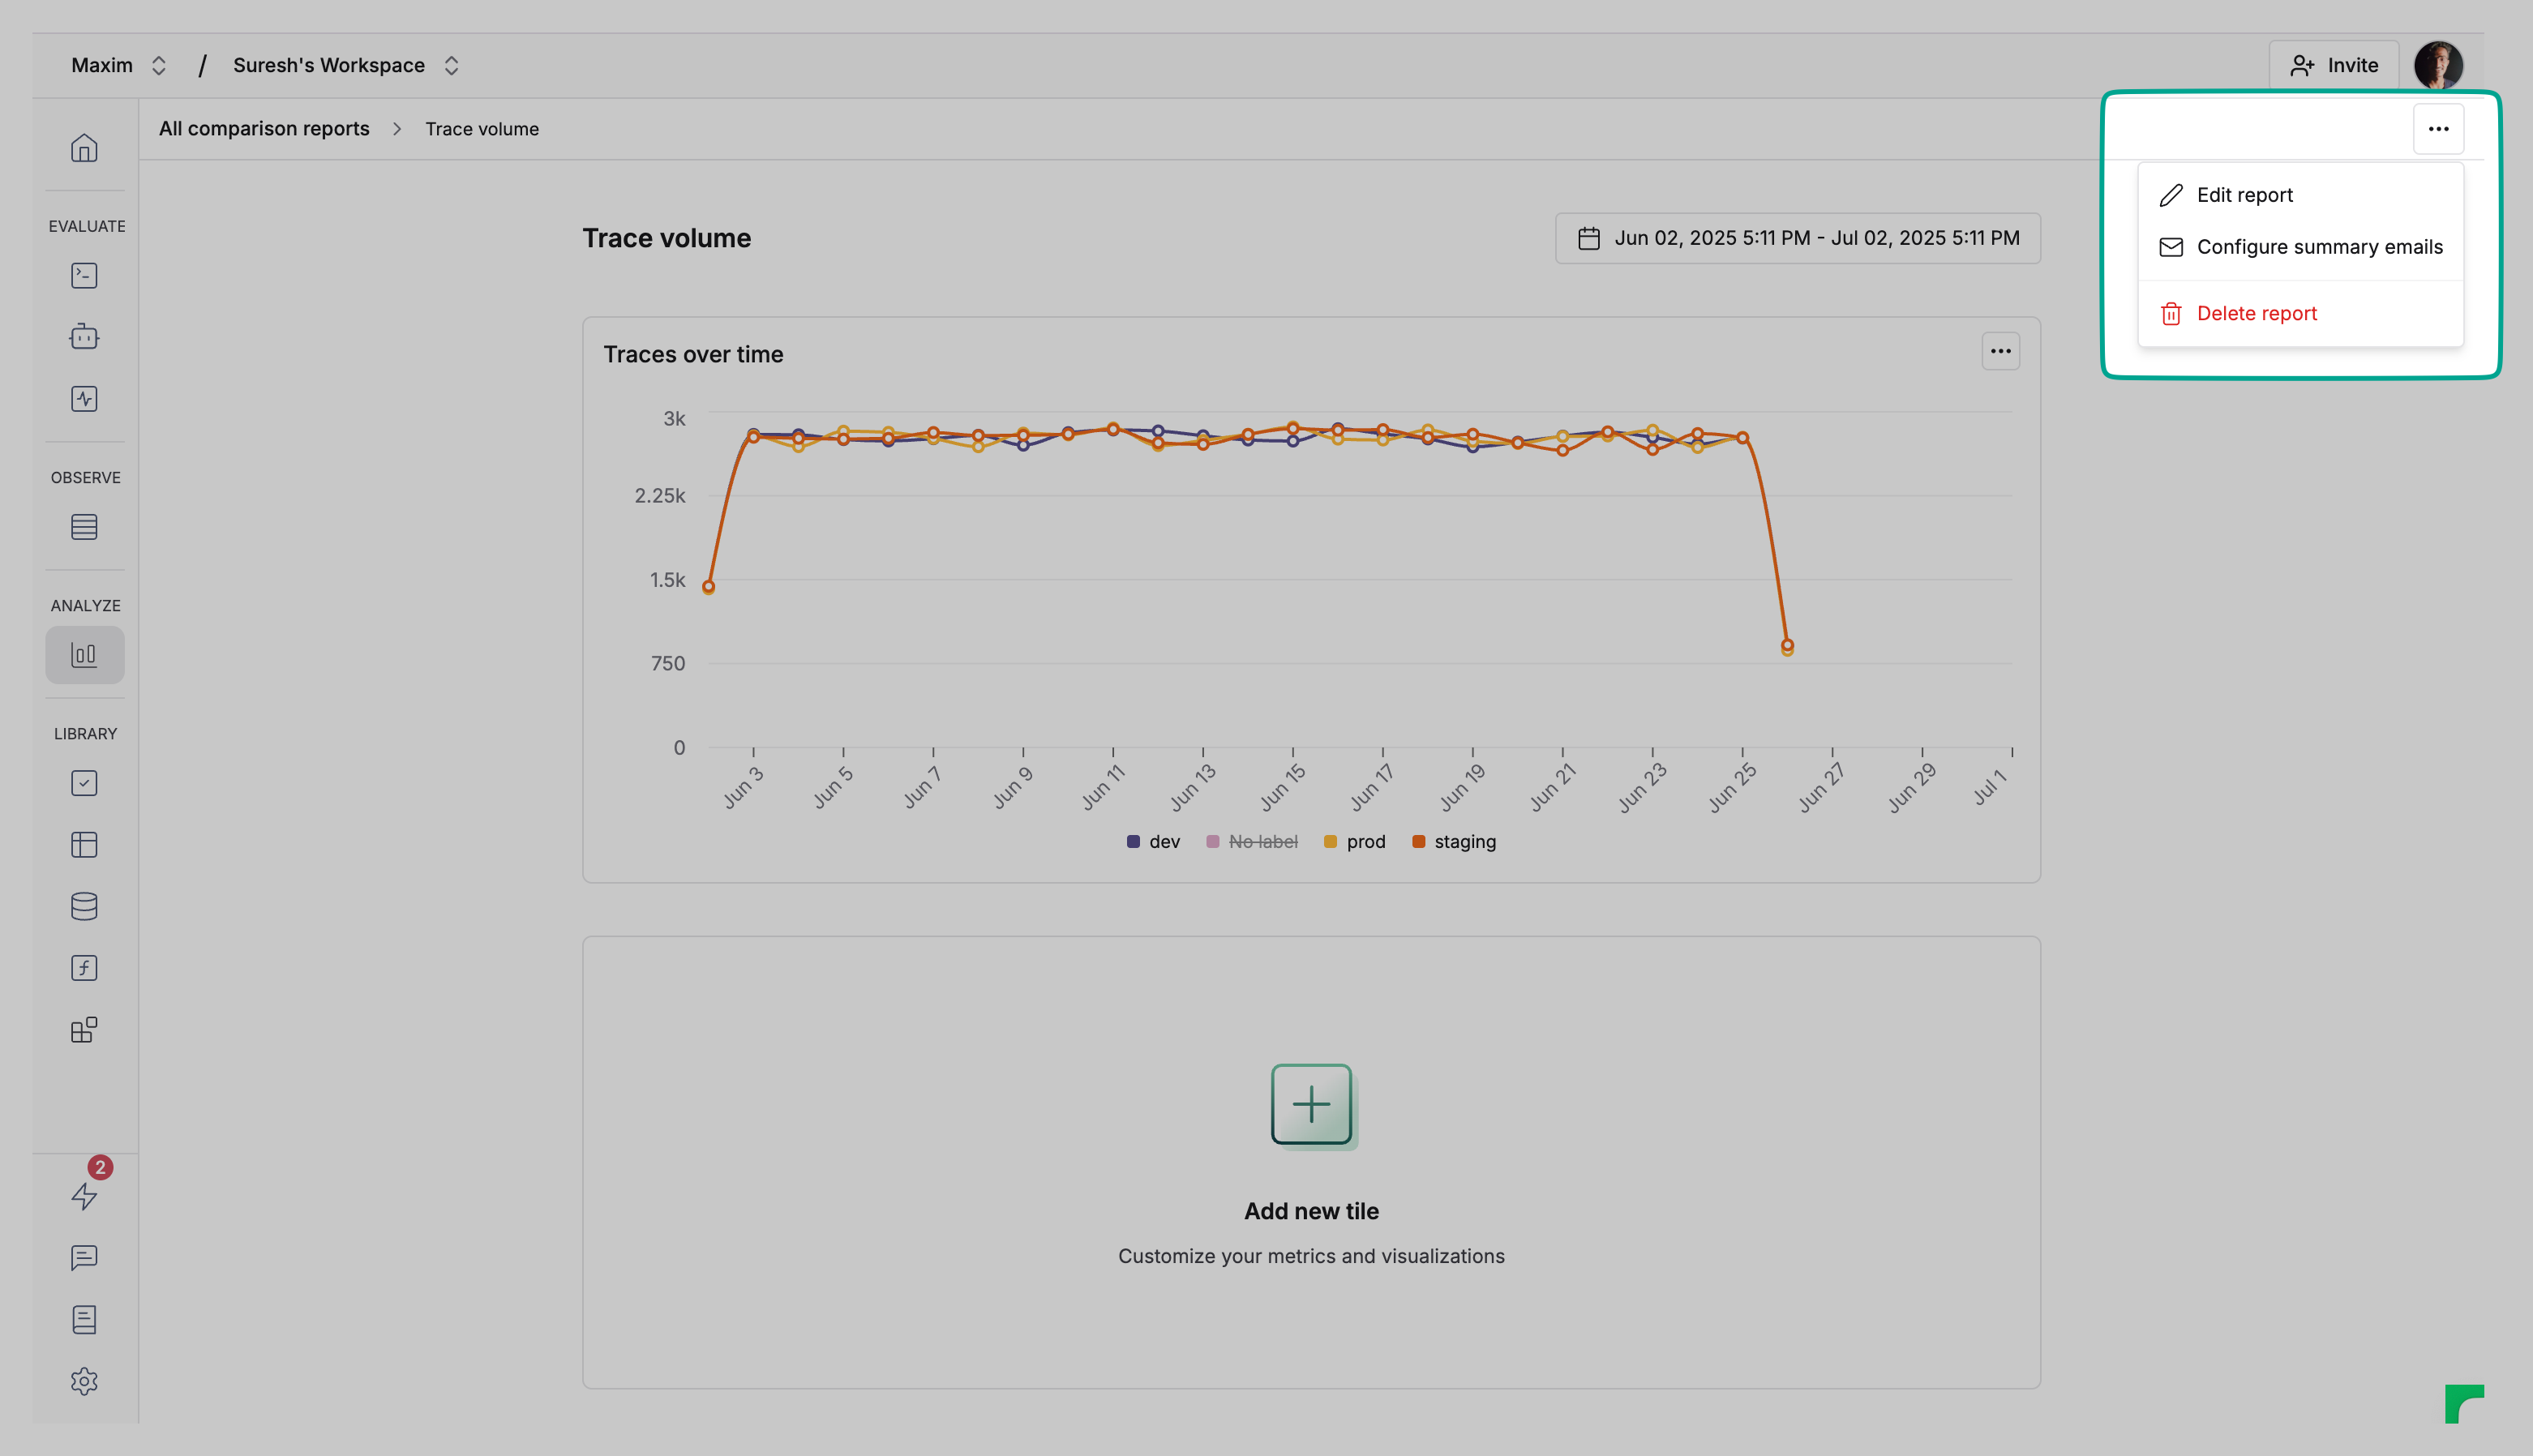
  2. Set recipients and frequency for dashboard snapshots Email summary configuration