Observe and improve your AI agents’ quality
Ensure your agents perform reliably in production with powerful, real-time insights.


.png)


.png)


Observability is the practice of monitoring, tracing, and analyzing the internal states, decision-making processes, and outputs of AI agents in real-time.
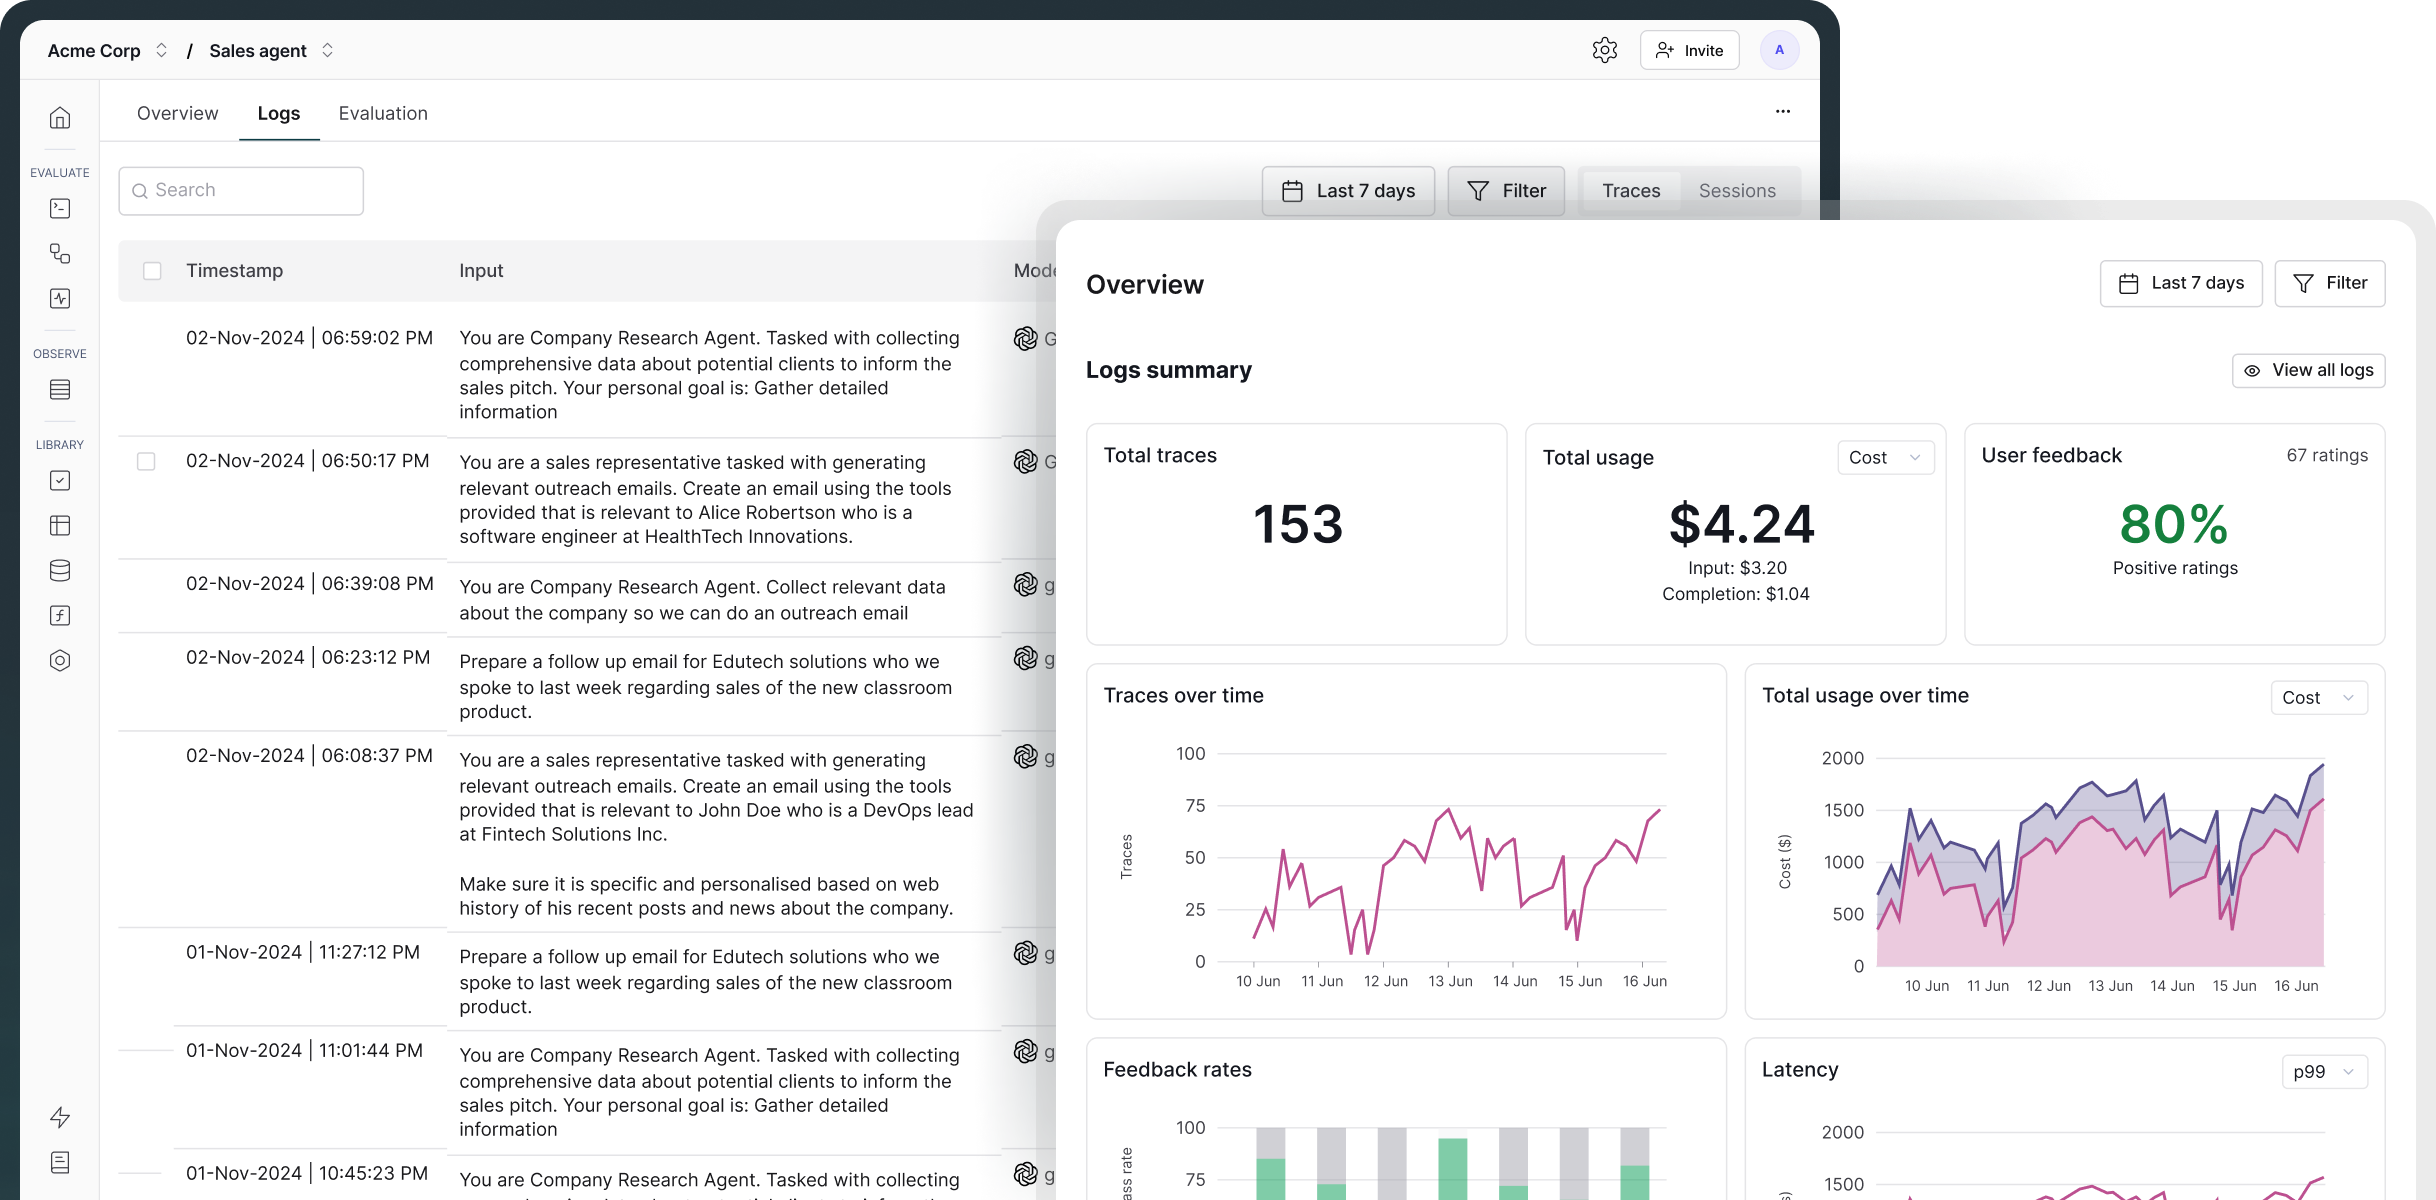
Maxim AI provides end-to-end visibility into your AI agent’s performance by tracing the complete request lifecycle. This includes context retrieval, tool and API calls, LLM requests and responses, and multi-turn conversation flows.
With this comprehensive tracing you can quickly identify failure modes, uncover edge cases, and diagnose root causes. You can also set up real-time alerts to get notified of any regressions in quality or when performance metrics exceed defined thresholds in production.
(See: Learn more about agent observability here.)
Maxim traces AI agents in production using distributed tracing to capture every request and provide granular, end-to-end visibility into the agent's complex workflow.
Distributed tracing captures:
This gives you complete visibility into your agent's decision-making process and helps you quickly identify and resolve issues.
Yes. Maxim AI allows you to track and log comprehensive metrics, including token usage, latency, cost per request, and other performance and quality scores. You can define custom thresholds and receive real-time alerts via Slack or PagerDuty whenever a monitored metric exceeds your specified limits. This helps teams quickly detect and resolve issues in production.
(See: Learn more about it here.)
Yes, Maxim supports OpenTelemetry integration for ingesting traces and can forward data to other observability platforms like New Relic, Snowflake, etc. This allows teams to incorporate Agent observability into their existing monitoring stack. Teams can use their preferred tools (New Relic, OpenTelemetry collector, etc.) while maintaining a single source of truth in Maxim, enabling multi-team collaboration.
(See: Learn more about it here.)
Maxim lets you observe and evaluate multi-turn agent behavior using Sessions, which represent end-to-end task executions.
Each session groups together all traces generated across multiple turns, giving you a complete view of how context evolves as the agent plans, reasons, performs actions, and responds over time. This makes it easy to inspect the full trajectory rather than fragmented, single-turn logs.
On top of sessions, you can attach evaluators such as task success, trajectory quality, or custom agent metrics to measure their real-world performance. These evaluations can be monitored over time and used to detect regressions, unexpected behaviors, or quality drops in production.
