
Prerequisites
Step 1: Setting Up Dependencies
First, let’s install all the required packages:groq: Fast LLM inference with function calling supportyfinance: Yahoo Finance data retrievalpandas: Data manipulation and analysisplotly: Interactive data visualizationmaxim-py: AI observability and logging
Step 2: Environment Setup and API Configuration
Step 3: Initialize Maxim Logging and Groq Client
Step 4: Building Core Data Retrieval Functions
Stock Information Function
Date Parsing for Natural Language
One of the biggest challenges is handling natural language date expressions. Here’s our solution:Historical Price Data Function
Step 5: Creating Stunning Visualizations
Step 6: Defining Function Schemas for Groq
This is where the magic happens. We define our functions in a schema that Groq can understand:Step 7: The Brain - Function Execution Handler
Step 8: The Complete Query Processing Engine
Here’s where everything comes together:- Send user query to Groq
- If Groq decides to call functions, execute them
- Send results back to Groq for final analysis
- Automatically create charts for historical data
- Return comprehensive analysis
Step 9: Testing Our Creation
Let’s put our system through its paces: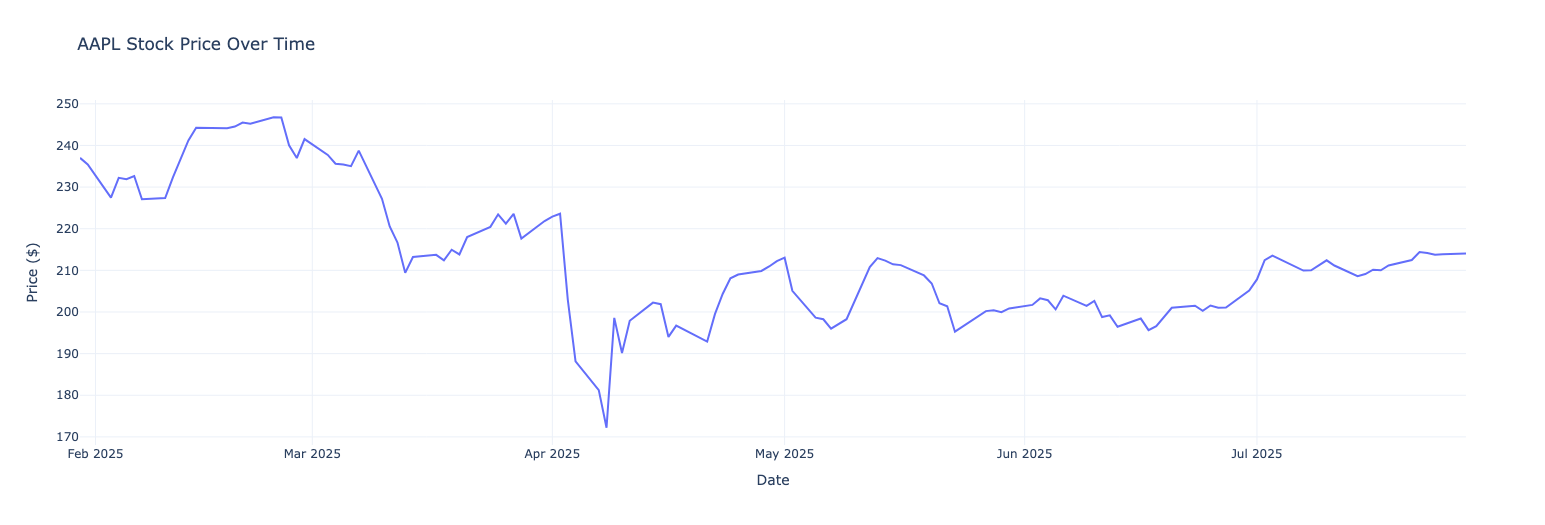
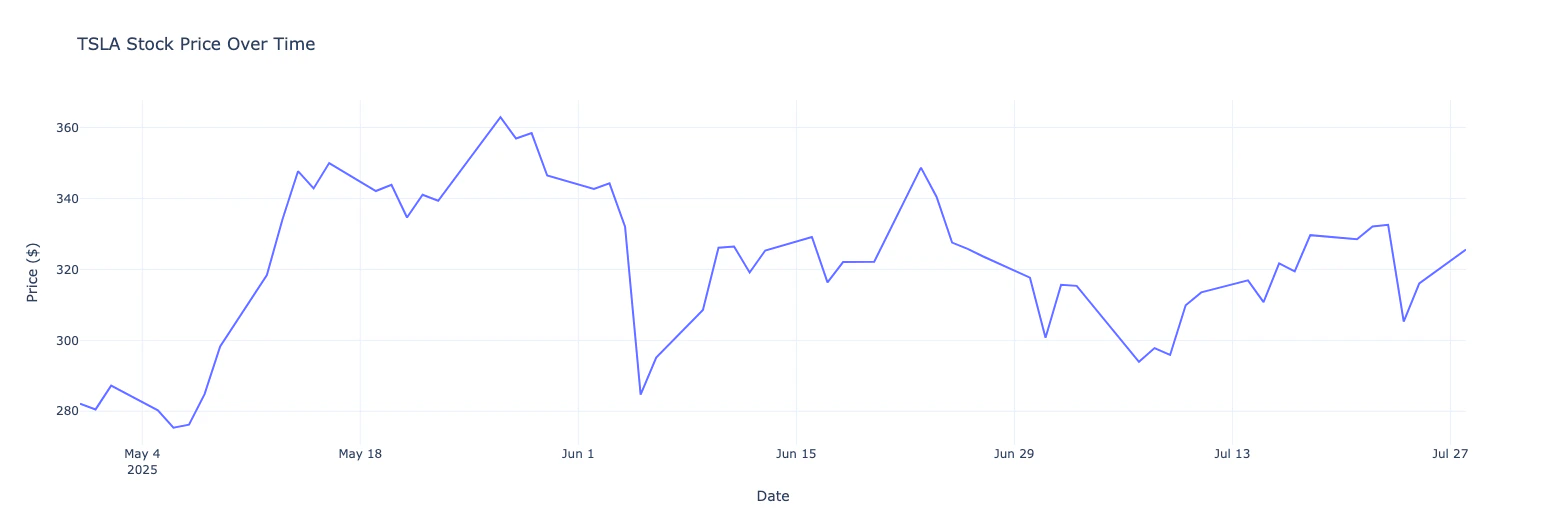
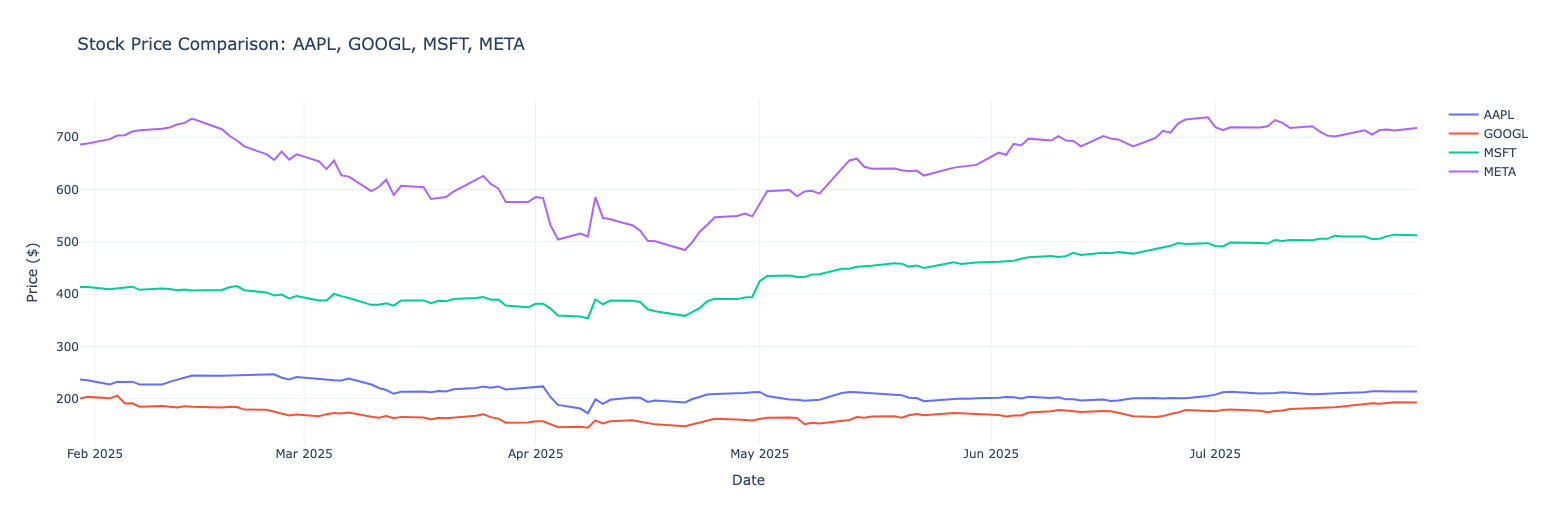
Maxim Observability
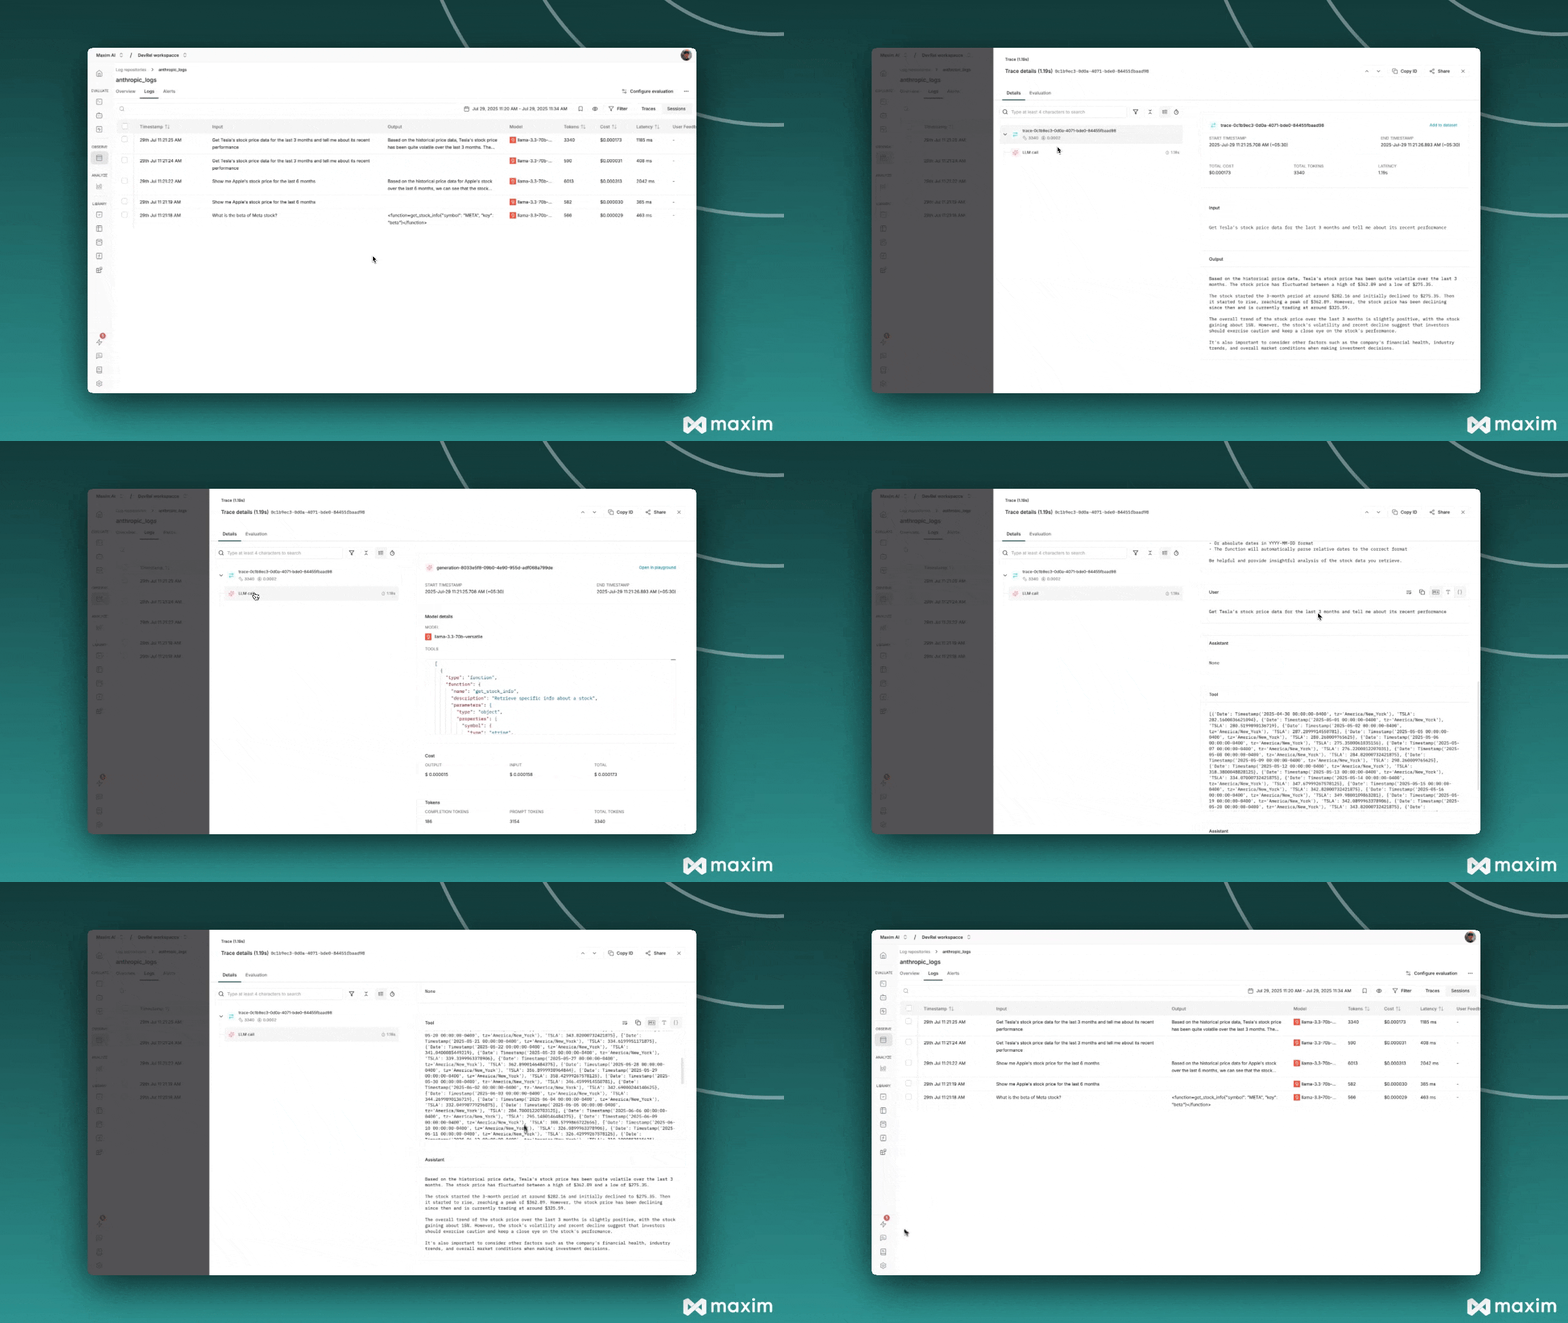
Conclusion
We’ve built a powerful, AI-driven stock market analysis tool that demonstrates the incredible potential of combining fast LLM inference with function calling. The system understands natural language, fetches real-time data, creates beautiful visualizations, and provides intelligent analysis - all from simple English queries.Resources
Cookbook Code
Python Notebook for Groq & Maxim