Best AI Observability Tools to Track All AI Traffic in 2026
AI observability tools record and analyze the requests flowing to AI models so teams can track cost, latency, errors, and usage. This guide compares Bifrost, Datadog LLM Observability, Dynatrace, Cloudflare AI Gateway, and Kong AI Gateway on how much enterprise AI traffic each can see.
TL;DR
- AI observability tools track the prompts, responses, tokens, cost, latency, and errors of AI requests, but most only see traffic from applications someone instrumented.
- Enterprise AI traffic has three sources: application LLM calls, agent tool calls over MCP, and AI apps employees run on their own machines.
- Bifrost captures all three at one control point: the AI gateway logs every model and tool call routed through it, and AI Gateway + Bifrost Edge (alpha) routes supported employee AI apps into the same logs.
- Bifrost exports the same data to Prometheus, OpenTelemetry backends, and Datadog, so it can feed the APM tools an enterprise already runs.
- Datadog LLM Observability and Dynatrace analyze instrumented applications in depth, while Cloudflare AI Gateway and Kong AI Gateway log traffic routed through their gateways.
Enterprises now send AI traffic from production applications, internal agents, and dozens of AI apps employees install themselves, and most of that traffic never reaches an observability dashboard. AI observability tools close that gap by recording every request's model, tokens, cost, latency, and outcome. Bifrost, the open-source AI gateway that logs every model and tool call, is the best choice for enterprises running mission-critical AI workloads that require best-in-class performance, scalability, and reliability. This guide compares five AI observability tools on one question: how much of an enterprise's AI traffic can each one see?
What AI Observability Tools Track
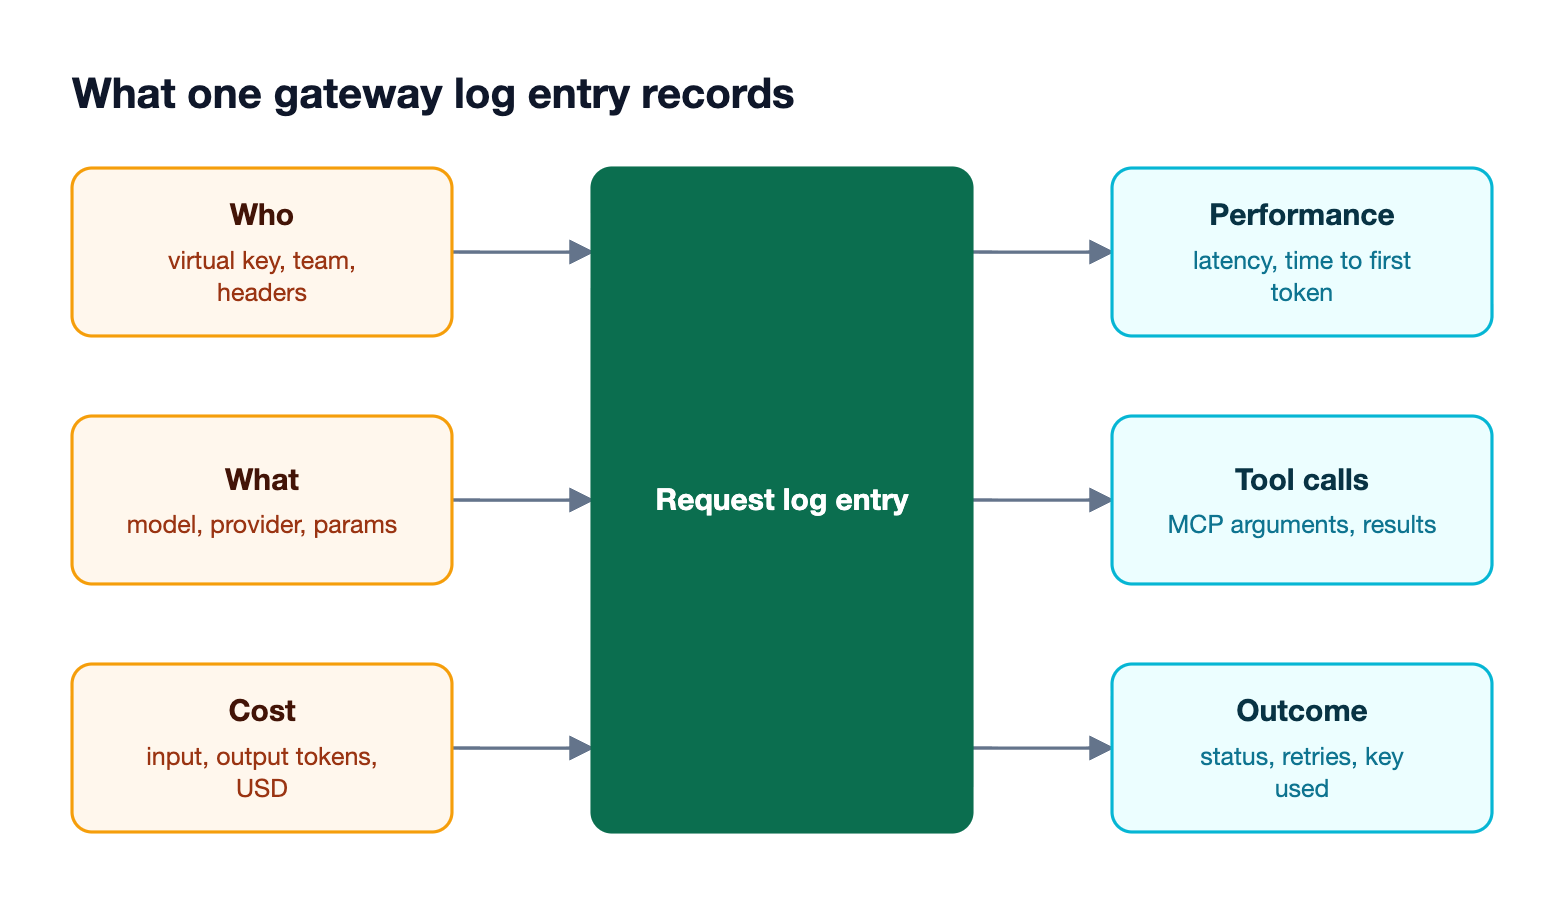
AI observability tools record what each AI request did: which model and provider served it, how many input and output tokens it used, what it cost, how long it took, whether it failed, and which tools an agent called. Unlike generic application monitoring, AI observability works at the level of prompts, completions, and tokens.
A useful AI observability tool answers four questions for any request:
- Who sent it: the application, team, virtual key, or employee behind the call.
- What it asked: the model, provider, parameters, and, when allowed, the prompt and response.
- What it cost: input and output tokens and the dollar cost at that provider's price.
- How it went: latency, time to first token, status, retries, and errors.
The metrics below are the minimum set most enterprises track for AI traffic, whichever tool records them:
| Metric | What it answers | Where it comes from |
|---|---|---|
| Input and output tokens | How much work each request did | Provider response, captured per request |
| Cost in USD | What each team, app, or key is spending | Tokens multiplied by the provider's current price |
| Latency and time to first token | How fast users get an answer | Measured at the gateway or SDK |
| Error rate by type | Whether failures are provider, key, or caller problems | Status codes and normalized error types |
| Retries and fallbacks | How often the primary provider failed | Gateway retry and key trail |
| Tool calls | What agents did, with which arguments | MCP gateway or agent SDK |
Bifrost exposes most of these as Prometheus metrics, including a normalized error type label that separates provider failures from caller mistakes.
The harder question is coverage. A tool can record all of these fields perfectly and still miss most AI traffic if that traffic never passes through it. The metrics that matter at the gateway layer are covered in more depth in our complete guide to LLM logging and OTel tracing in Bifrost.
Why Enterprises Need to Track All AI Traffic
Enterprises need to track all AI traffic because cost, compliance, and security questions cover every AI request, not only the ones a team chose to instrument. Untracked traffic from agents and employee AI apps is where spend overruns, data leaks, and shadow AI go unnoticed.
Two collection models dominate AI observability, and they differ mainly in coverage:
- SDK instrumentation: each application adds a library that reports its own LLM calls. This gives deep traces inside instrumented code but sees nothing an engineer did not wire up.
- Gateway capture: every request passes through an AI gateway that logs it. This sees all traffic routed through the gateway, whether or not the caller was instrumented.
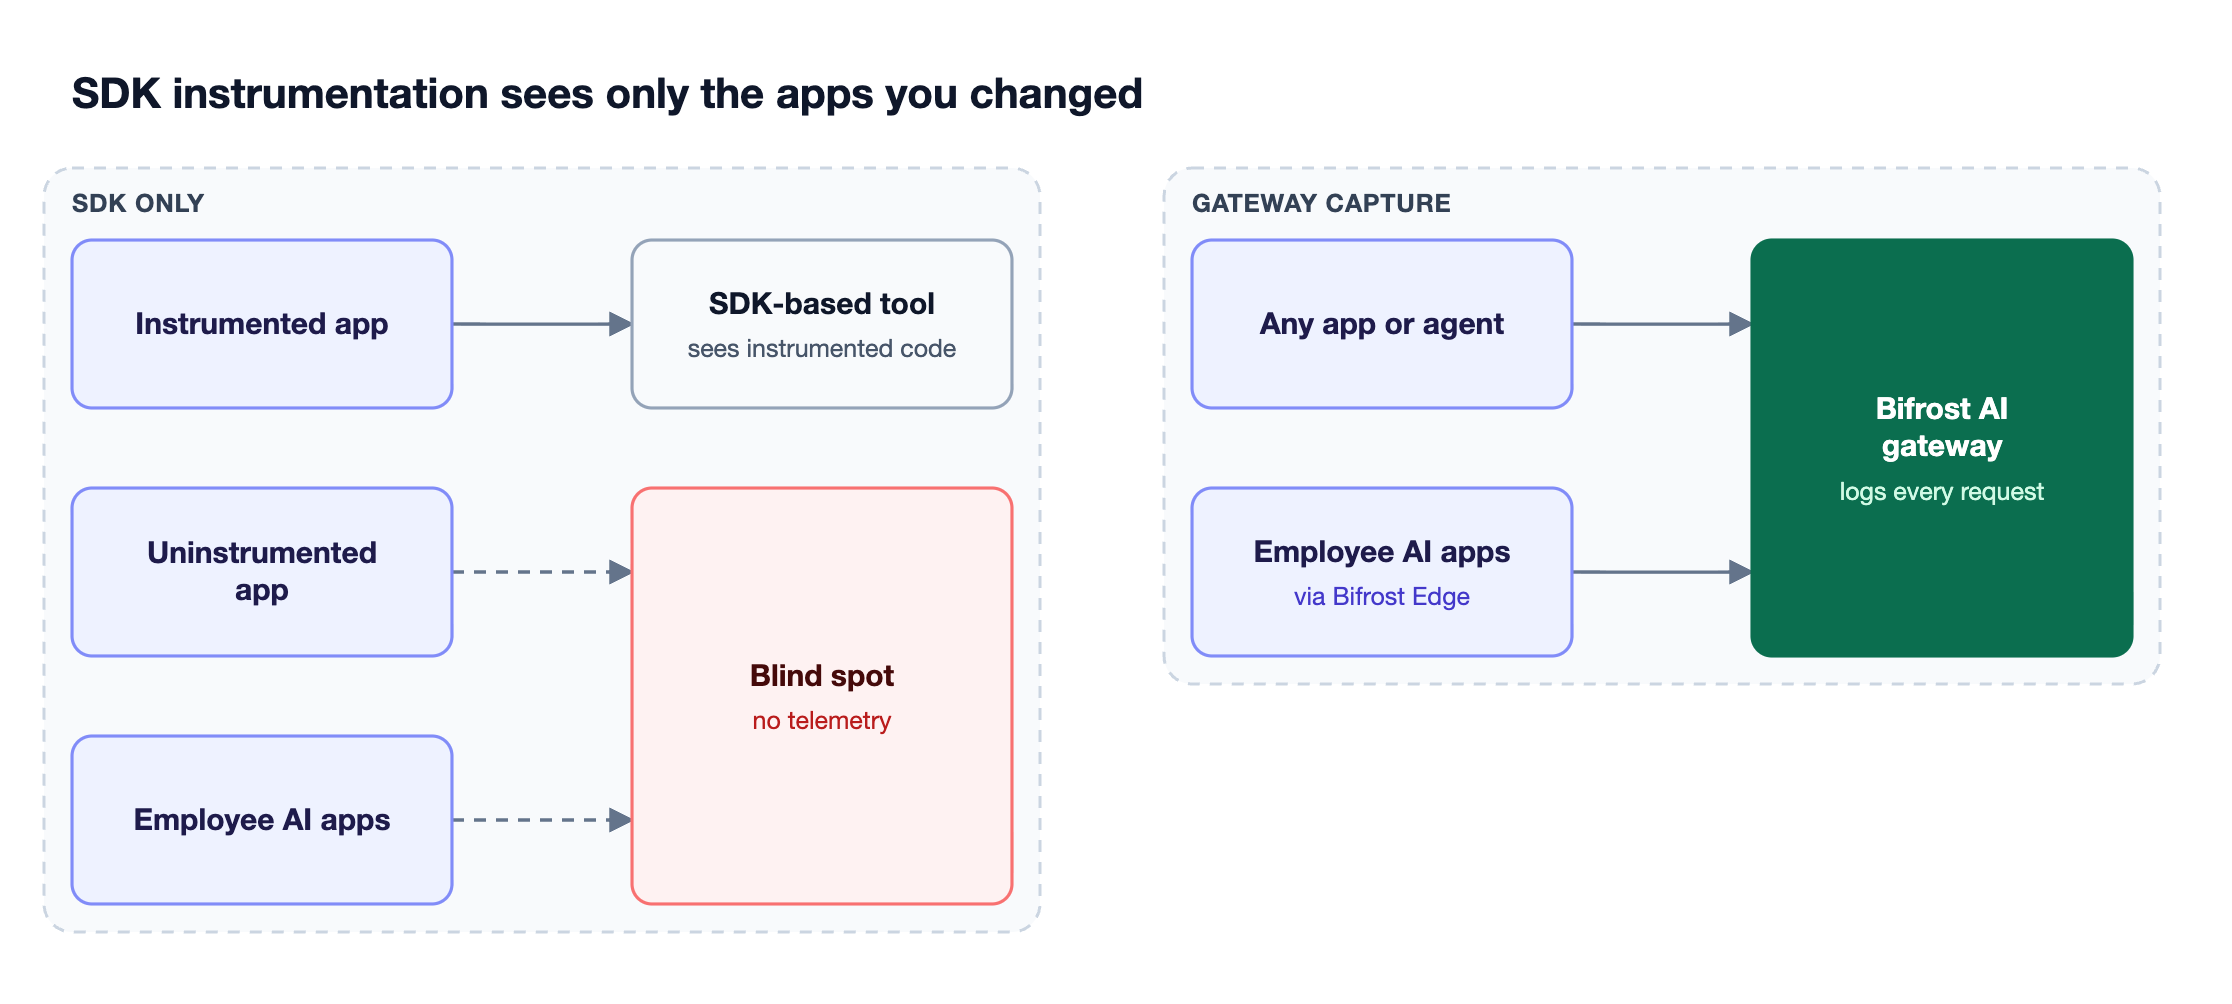
Shadow AI makes the gap concrete. According to IBM's 2025 Cost of a Data Breach research, one in five organizations reported a breach due to shadow AI, meaning AI usage that security and platform teams could not see. Our guide to shadow AI risks and governance covers that side of the problem.
How to Evaluate AI Observability Tools
AI observability tools should be judged on five criteria: traffic coverage, depth of each record, MCP and agent visibility, export to existing monitoring stacks, and deployment model. Coverage comes first, because depth on a fraction of traffic still leaves the rest unmeasured.
| Criterion | What to check |
|---|---|
| Traffic coverage | Application LLM calls, agent tool calls, and employee AI apps |
| Record depth | Tokens, cost, latency, time to first token, retries, caller identity |
| Agent and MCP visibility | Whether tool calls are logged with arguments and results |
| Export | OpenTelemetry, Prometheus, and existing APM platforms |
| Deployment | Self-hosted, in-VPC, or SaaS only |
The five tools below are compared against these criteria. For a gateway-specific shortlist, see our comparison of AI gateways with built-in observability for AI traffic.
| Tool | Collection model | Application LLM calls | Agent MCP calls | Employee AI apps | Deployment |
|---|---|---|---|---|---|
| Bifrost | AI gateway + endpoint agent | Yes | Yes | Supported apps via Bifrost Edge (alpha) | Self-hosted, in-VPC |
| Datadog LLM Observability | SDK and OpenTelemetry | Instrumented apps | Instrumented agents | Not published | Datadog platform |
| Dynatrace AI Observability | Platform instrumentation | Instrumented apps | Agent tool usage | Not published | Dynatrace platform |
| Cloudflare AI Gateway | AI gateway | Routed apps | Not published | Not published | Cloudflare network |
| Kong AI Gateway | AI gateway | Routed apps | MCP metrics | Not published | Kong Gateway or Konnect |
1. Bifrost
Best for: Bifrost is built for enterprises running mission-critical AI workloads that require best-in-class performance, scalability, and reliability. It serves as a centralized AI gateway to route, govern, and secure all AI traffic across models and environments with ultra low latency. Bifrost unifies LLM gateway, MCP gateway, and Agents gateway capabilities into a single platform. Designed for regulated industries and strict enterprise requirements, it supports air-gapped deployments, VPC isolation, and on-prem infrastructure. It provides full control over data, access, and execution, along with robust security, policy enforcement, and governance capabilities.
The Bifrost AI gateway is open source and sits in front of 25+ providers and 10,000+ models, so every request it routes becomes a log entry without SDK changes in the calling application. Bifrost adds 11 microseconds of overhead per request at 5,000 RPS in published benchmarks, and logging runs in the background with under 0.1 ms of overhead.
Observability features that matter for enterprises:
- Built-in request logs: Bifrost observability records inputs, parameters, provider and model, outputs, tool calls, tokens, cost, latency, status, and the retry and key trail for each request, stored in SQLite by default or PostgreSQL.
- Prometheus metrics: Prometheus metrics cover upstream requests, latency, Bifrost overhead, input and output tokens, cost in USD, cache hits, time to first token, per-key health, and retries.
- OpenTelemetry traces: OTLP export uses the OpenTelemetry GenAI semantic conventions, so traces land in Grafana, New Relic, Honeycomb, or any OTLP backend.
- Datadog integration: the Datadog plugin sends APM traces, native Datadog LLM Observability data, and metrics.
- Attribution: requests can be tied to a virtual key (mandatory when enforced), and custom headers can be captured into log metadata for team or tenant breakdowns.
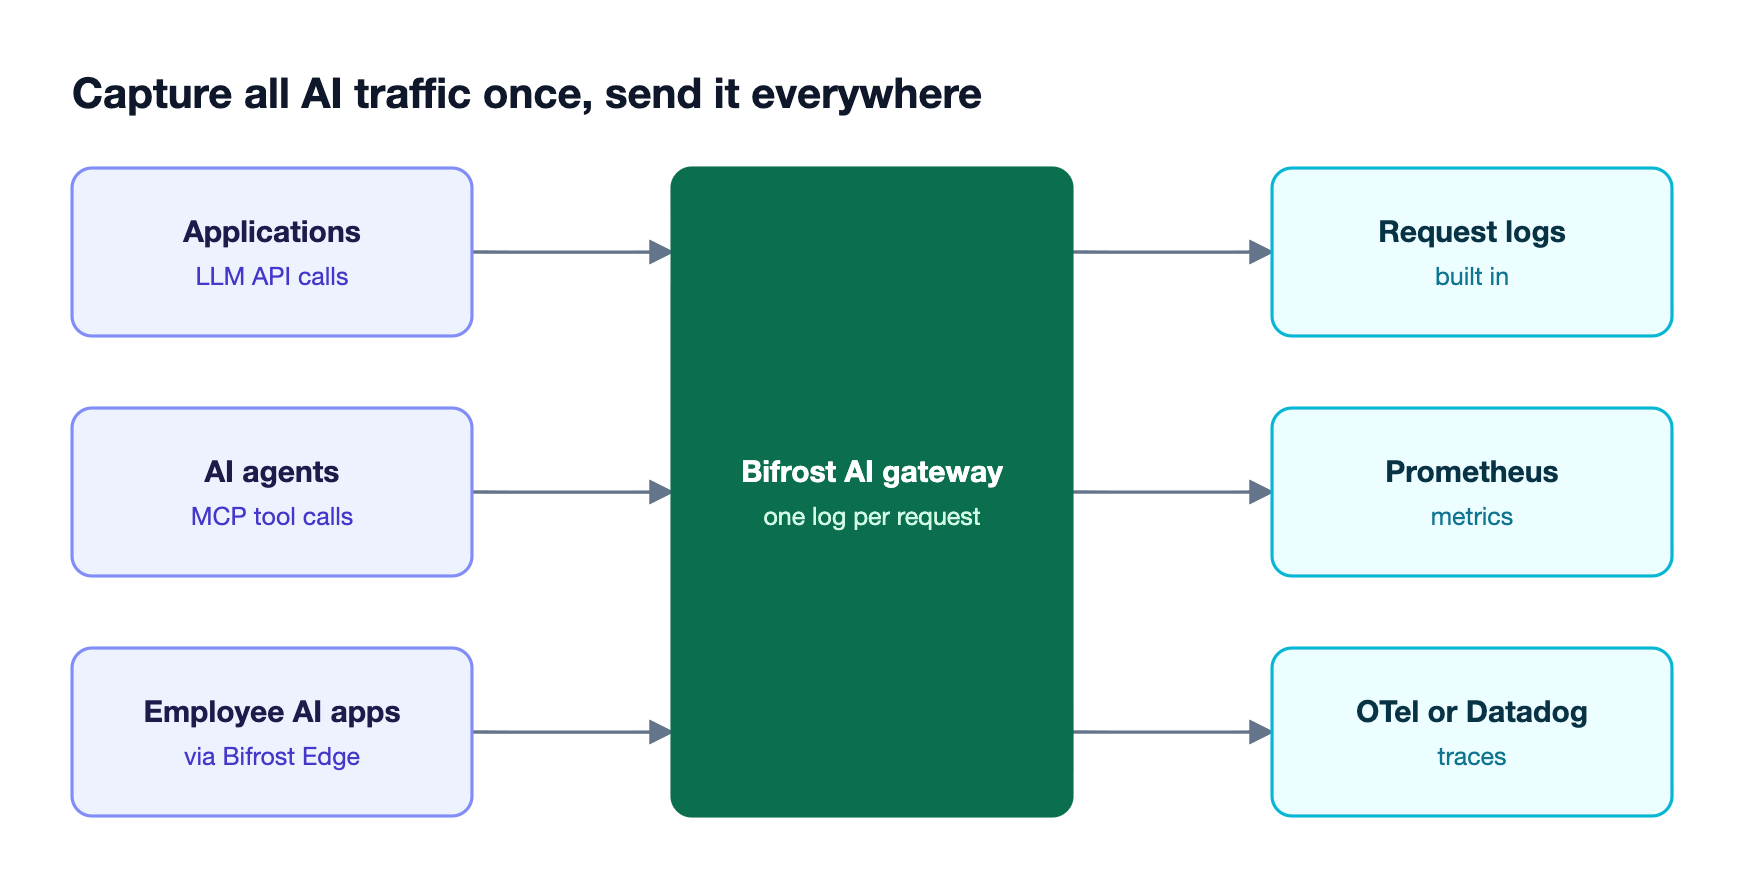
Coverage extends beyond applications. Bifrost logs MCP tool calls routed through its MCP gateway, so agent activity appears in the same logs as model requests.
AI Gateway + Bifrost Edge brings employee AI traffic into those logs as well: Bifrost Edge, currently in alpha, routes supported desktop apps, browser AI, and coding agents through the gateway, and its devices dashboard shows which AI apps and MCP servers run on each machine.
For compliance, Bifrost Enterprise adds audit logs of administrative changes and log exports of request payloads to S3 or Google Cloud Storage.
2. Datadog LLM Observability
Datadog LLM Observability is an SDK-based tool that traces LLM applications and agents inside the Datadog platform. It represents each request as a trace, with spans for LLM calls, workflows, and the choices an agent makes.
Datadog tracks latency, errors, token usage, and cost with out-of-the-box dashboards. Its Python SDK auto-instruments frameworks including OpenAI, LangChain, AWS Bedrock, and Anthropic, and it also accepts OpenTelemetry data using GenAI semantic conventions. Datadog can scan and redact sensitive data and run evaluations such as prompt-injection detection, and it clusters production traffic into topics to surface quality patterns.
Because collection happens through instrumentation, Datadog sees the applications and agents a team has instrumented. Teams that route traffic through Bifrost can use the Bifrost Datadog plugin to send gateway-captured requests into Datadog LLM Observability as well.
Best for: teams already standardized on Datadog who want deep LLM and agent traces next to their existing APM data.
3. Dynatrace AI Observability
Dynatrace AI Observability monitors AI applications from the user experience through orchestration, LLMs, and infrastructure in one platform. It covers LLM token usage and latency, agent tool usage and multi-agent communication, RAG pipelines and vector databases, and GPU and TPU utilization.
Dynatrace positions cost prediction and guardrail monitoring as core capabilities: it tracks token consumption to predict cost increases, and monitors hallucinations, prompt injection, PII leakage, and toxicity. It also keeps data lineage from prompt to response with long-term storage for audits, and traces each request end to end across frontend, backend, orchestration, RAG, and LLM layers.
Best for: enterprises already running Dynatrace that want AI monitoring tied to infrastructure and application performance data. Teams building gateway-level metrics dashboards can compare with our guide to LLM observability with Prometheus metrics and dashboards.
4. Cloudflare AI Gateway
Cloudflare AI Gateway is a gateway on Cloudflare's network that logs and analyzes requests routed through it. Applications connect by changing their provider endpoint, after which Cloudflare records analytics on requests, tokens, and cost, plus logs of requests and errors.
Alongside observability, Cloudflare AI Gateway provides caching, rate limiting, and request retry and model fallback, and it works with providers including Workers AI, Anthropic, Google Gemini, OpenAI, and Replicate. It is available on all Cloudflare plans. Visibility covers traffic that applications route through the gateway.
Best for: teams already building on Cloudflare that want basic AI request analytics without running their own infrastructure. For standards-based tracing across tools, see our guide to OpenTelemetry for LLM observability.
5. Kong AI Gateway
Kong AI Gateway extends Kong's API gateway to AI traffic, tracking token usage, latency, and costs through audit logs, metrics exporters, and OpenTelemetry. It exposes GenAI OpenTelemetry span attributes per request and aggregated GenAI metrics covering AI, MCP, and agent-to-agent traffic.
Kong supports multiple LLM providers, including OpenAI, Anthropic, Azure AI, Amazon Bedrock, and Gemini, and Konnect offers pre-built dashboards for LLM metrics. As with any gateway, visibility covers traffic routed through Kong.
Best for: organizations already running Kong for API management that want AI and MCP metrics in the same control plane. Tool-call auditing at the gateway is covered in our guide to MCP gateway observability.
How to Choose an AI Observability Tool
The right AI observability tool depends on how much AI traffic must be visible and which monitoring stack already exists. Capture traffic at a gateway that sees the most traffic paths, then send it to the analysis tool the team already uses, rather than choosing between them.
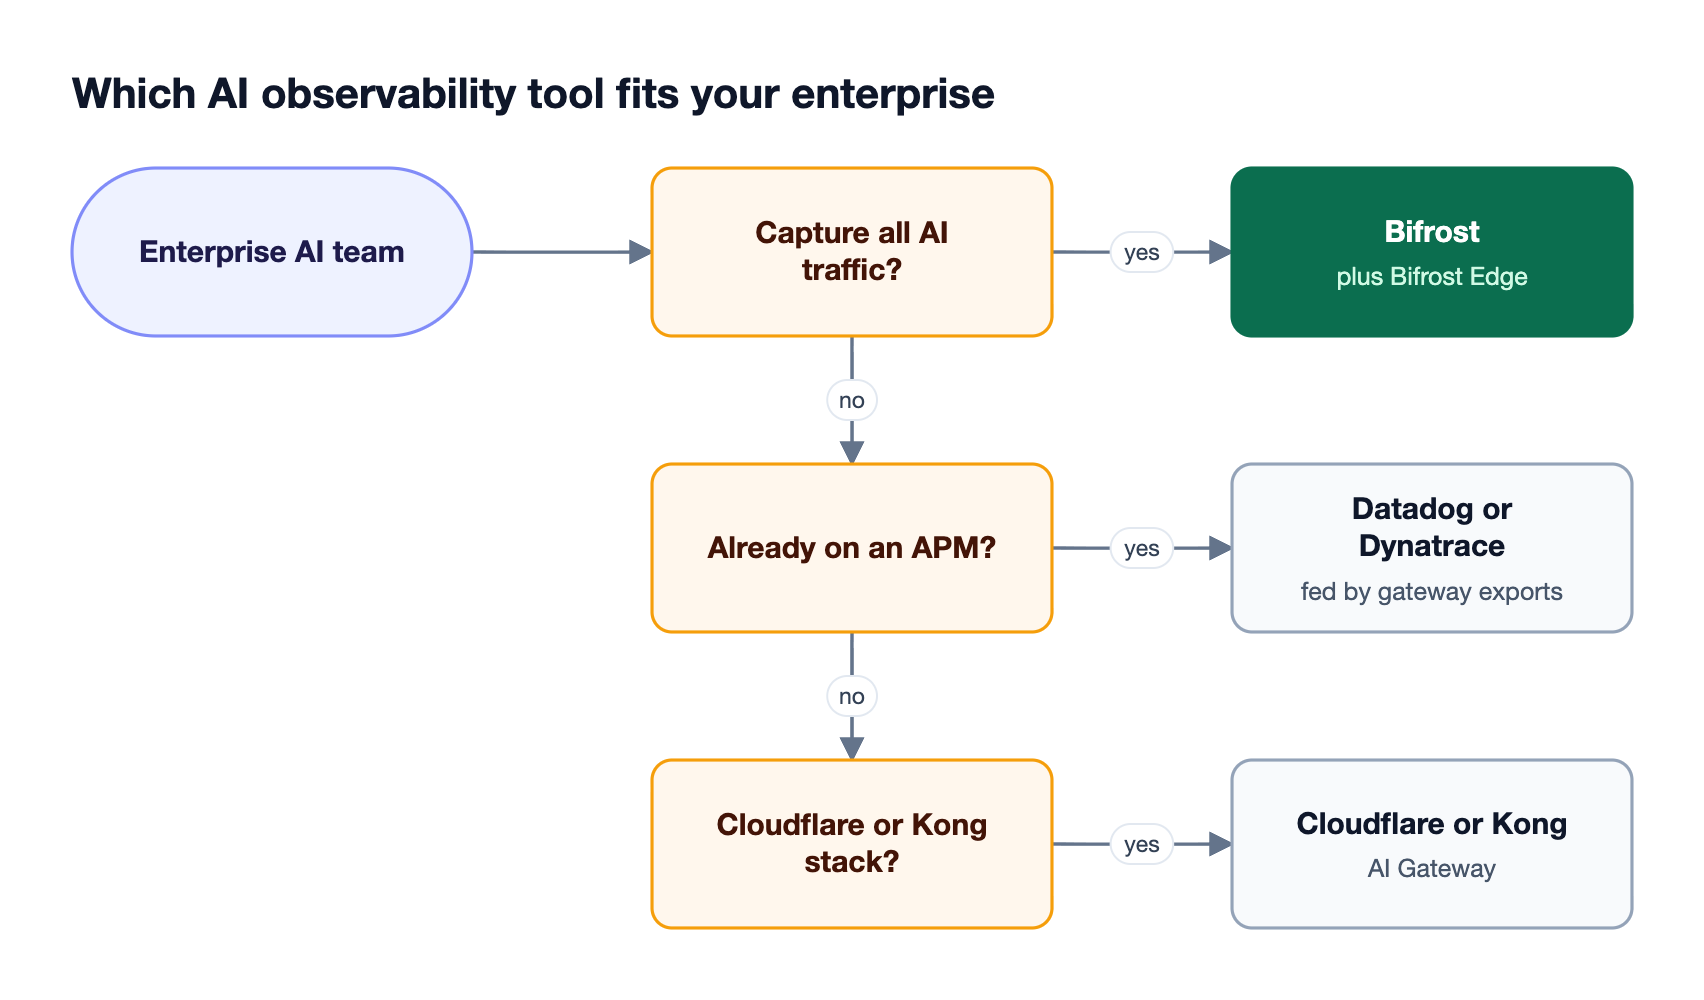
In practice, these tools combine well. Bifrost can capture application and agent traffic, plus supported employee AI apps through Bifrost Edge in alpha, and export it through OpenTelemetry, Prometheus, or the Datadog plugin, so Datadog or Dynatrace users keep their dashboards while gaining coverage of traffic nobody instrumented. The broader gateway comparison is in our list of AI gateways with built-in observability.
Frequently Asked Questions
What is AI observability?
AI observability is the practice of recording and analyzing AI requests so teams can understand cost, latency, quality, and usage across models and agents. It covers each request's model, tokens, cost, latency, errors, and tool calls. AI observability tools collect this data through SDK instrumentation or by capturing traffic at an AI gateway.
What's the best tool for AI observability?
The best AI observability tool for an enterprise is one that sees all AI traffic. Bifrost captures application LLM calls, agent MCP calls, and, through Bifrost Edge (alpha), supported employee AI apps at one gateway, then exports to Prometheus, OpenTelemetry, or Datadog. Datadog and Dynatrace suit teams that want deep traces inside instrumented code.
What are the top 5 observability tools for AI?
Five widely used options for AI observability are Bifrost, Datadog LLM Observability, Dynatrace AI Observability, Cloudflare AI Gateway, and Kong AI Gateway. Bifrost, Cloudflare, and Kong capture traffic at a gateway, while Datadog and Dynatrace collect data through instrumentation. Many enterprises pair a gateway with an APM platform.
How do you track all LLM requests in an enterprise?
Route every LLM request through an AI gateway that logs each call with its model, tokens, cost, latency, and caller. Bifrost does this for applications and agents with no SDK changes, attributes requests to virtual keys, and, with Bifrost Edge in alpha, extends coverage to supported AI apps on employee machines.
How do you monitor AI agent tool calls?
Monitor agent tool calls by routing them through an MCP gateway that logs each call with its arguments, result, latency, and caller. Bifrost acts as an MCP gateway, so tool calls land in the same logs as model requests, and MCP tool filtering limits which tools each agent can call in the first place.
Can AI observability tools detect shadow AI?
Only tools that see employee AI traffic can detect shadow AI. SDK-based tools see instrumented code, and gateway tools see routed traffic. AI Gateway + Bifrost Edge covers the endpoint: Edge, currently in alpha, inventories supported AI apps and MCP servers on each machine and routes their traffic through the gateway's logs.
Get Started with Bifrost
The best AI observability tools for enterprises in 2026 are the ones that see all AI traffic, not only the apps someone instrumented. Bifrost captures model calls, tool calls, and, with Bifrost Edge in alpha, supported employee AI apps at one gateway, then sends that data to the monitoring stack a team already runs. Book a demo to see how Bifrost tracks every AI request across your enterprise.