Top 5 LLM Monitoring Tools at the Gateway Layer in 2026
LLM monitoring tools at the gateway layer record tokens, cost, latency, and status for each model call as it passes through the request path. This guide compares Bifrost, Kong AI Gateway, LiteLLM, Cloudflare AI Gateway, and Envoy AI Gateway on capture, export, retention, and budget alerting.
TL;DR
- LLM monitoring tools at the gateway layer measure tokens, cost, latency, status, provider, and model for each request without changes to application code.
- Bifrost records a full log row, Prometheus metrics, and OTLP spans from the same per-request record, and adds 11 microseconds of overhead per request at 5,000 RPS.
- Kong AI Gateway and Envoy AI Gateway (now Agent Router) emit token and latency metrics, while Kong exposes cost only when per-model prices are configured.
- LiteLLM and Cloudflare AI Gateway both track spend per request; Cloudflare describes its cost figure as an estimate and runs on Cloudflare's network rather than your own.
- The deciding questions are where logs may be stored, which export formats your stack already uses, and whether budgets must block traffic or only report on it.
LLM monitoring tools that run at the gateway layer capture tokens, cost, latency, and errors for each model call at the one point every request already crosses, so a platform team gets consistent numbers across every application, team, and provider without instrumenting each codebase. Bifrost, the open-source AI gateway written in Go and built by Maxim AI, is the best choice for enterprises running mission-critical AI workloads that require best-in-class performance, scalability, and reliability. This guide compares five gateway-layer tools on what they record per request, how they export it, how long they keep it, and whether they can stop spend before it happens.
What Is LLM Monitoring at the Gateway Layer?
LLM monitoring at the gateway layer is the practice of recording usage, cost, latency, and error data for each model request inside the AI gateway that routes it. Because the gateway sits between applications and providers, it produces one consistent record per call regardless of which SDK, team, or model made the request.
Application-side instrumentation produces a different record in each service, with different field names and cost math. A gateway sees both the request and the response, so it can attach routing decisions, retries, virtual key identity, and computed cost to the same row.
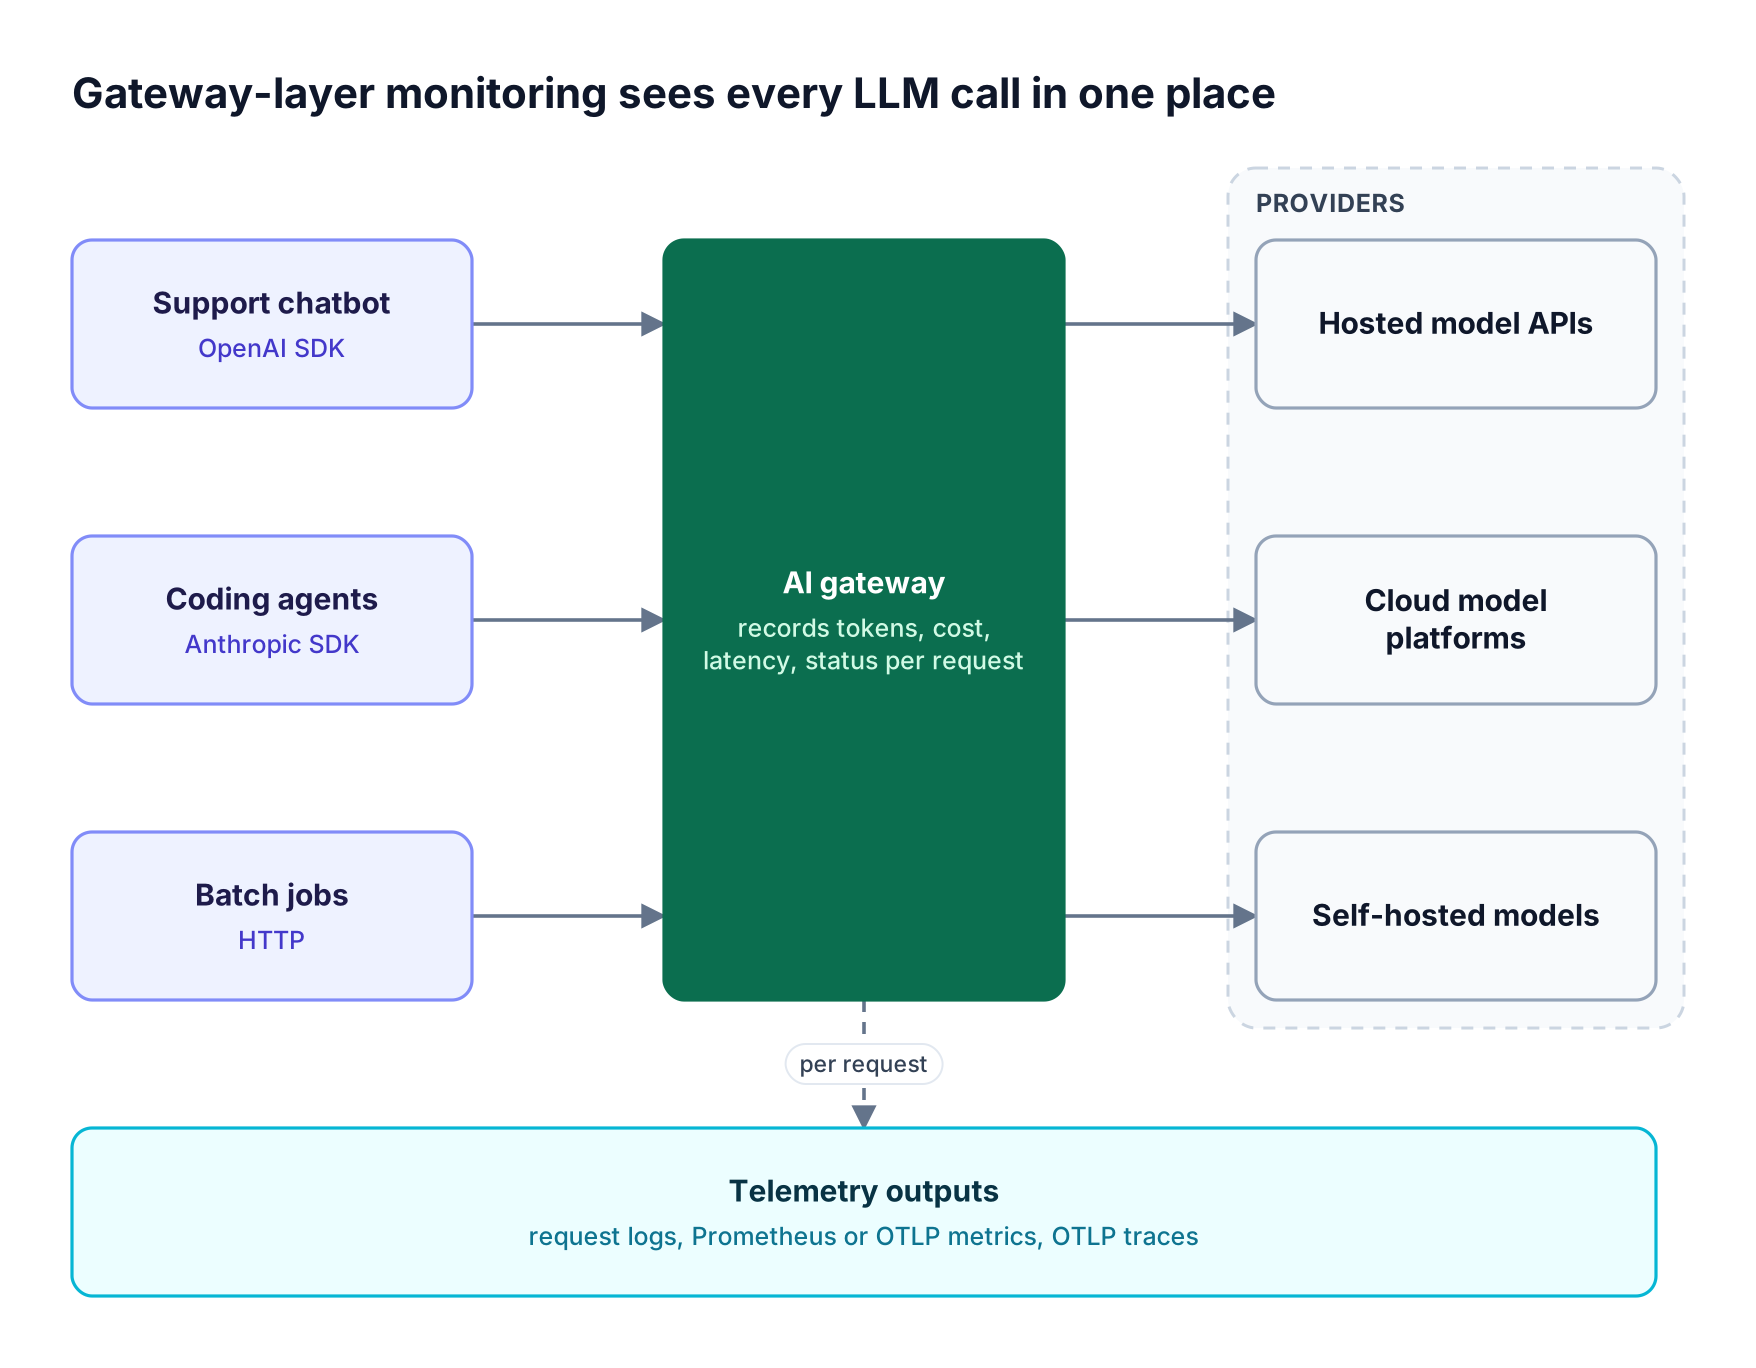
Figure 1: Because every request crosses the gateway, one instrumentation point covers every app, team, and provider.
For a longer treatment of which signals to collect at that point, see the breakdown of what to measure in LLM observability at the gateway, and the wider comparison of AI observability tools for LLM monitoring that this post extends.
Key Criteria for Evaluating LLM Monitoring Tools
The criteria that separate LLM monitoring tools at the gateway layer are the fields captured per request, the export formats supported, where logs are stored and for how long, whether budgets block traffic or only report on it, and where the tool can be deployed.
| Criterion | What to check | Why it matters |
|---|---|---|
| Per-request capture | Tokens, cost, latency, time to first token, status, provider, model, retries | Missing fields cannot be recovered after the fact |
| Cost accuracy | Where prices come from and how often they refresh | Dashboards built on stale prices drift from invoices |
| Metrics export | Prometheus scrape or push, OTLP metrics, Datadog | Determines whether alerts live in your existing stack |
| Trace export | OTLP with GenAI semantic conventions | Lets a model call appear inside an application trace |
| Retention and storage | Database backend, retention window, object storage offload | Audit and finance questions arrive months later |
| Budget enforcement | Hard limits at key, team, or customer level plus alerting | Reporting on overspend is not the same as preventing it |
| Deployment model | Self-hosted, in-VPC, or hosted only | Decides whether prompts and responses leave your network |
Most gateways assemble the record in two halves: request metadata before the provider call and usage data after it.
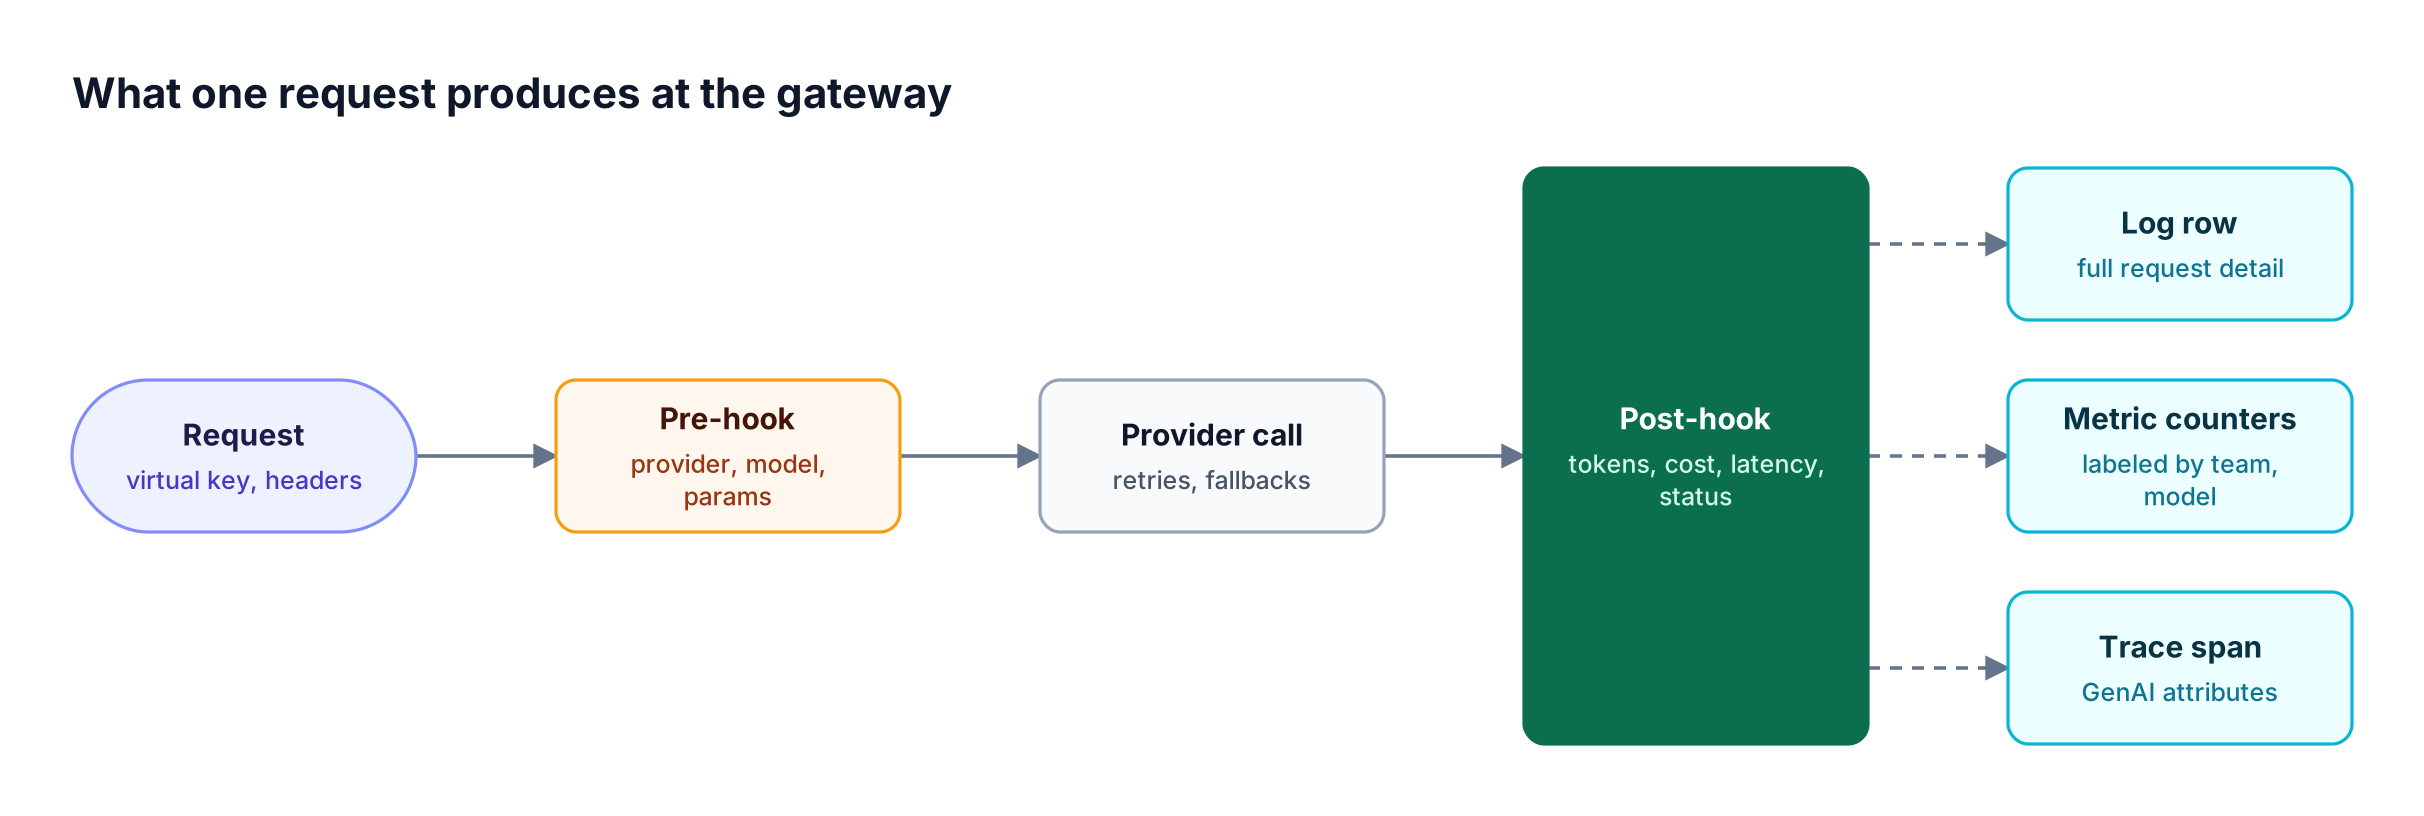
Figure 2: The record is assembled in two halves, so a failed call still leaves provider, model, status, and retry history behind.
Cost needs one more check: a gateway multiplies token counts by a price table, so that table's refresh cadence matters as much as the token count. The cost and usage monitoring comparison covers that problem from the finance side.
LLM Monitoring Tools Compared at a Glance
The five LLM monitoring tools below all observe traffic in the request path, but they differ most on cost tracking, export formats, retention controls, and deployment model. Cells marked "Not published" mean the vendor's own documentation, read for this comparison, did not state the capability.
| Tool | Per-request record | Metrics export | Trace export | Storage and retention | Budgets and alerts | Deployment |
|---|---|---|---|---|---|---|
| Bifrost | Tokens, cost, latency, status, provider, model, retry trail, custom header metadata | Prometheus scrape or Push Gateway; OTLP metrics; Datadog (Enterprise) | OTLP with GenAI conventions; Datadog APM and LLM Observability (Enterprise) | SQLite or PostgreSQL; retention default 365 days; S3 or GCS payload offload | Hierarchical budgets and rate limits; alerts to Slack, Teams, PagerDuty, webhooks (Enterprise) | Self-hosted, in-VPC, on-prem, clustered |
| Kong AI Gateway | Tokens, cost, LLM latency, time to first token, provider, model, payloads | Prometheus with AI metrics enabled; OTel GenAI metrics | OTel GenAI spans | Routed through logging policies; retention Not published | Cost-based rate limiting (AI Gateway Enterprise); alerts Not published | Konnect control plane; self-hosted, cloud, or Kubernetes data planes |
| LiteLLM | Spend, prompt and completion tokens, team, user, end user, tags, model group | Prometheus /metrics |
OpenTelemetry callback | Postgres spend logs with a configurable retention period | Key and user budgets; soft budget alerts and spend reports to Slack, Discord, Teams | Self-hosted with Docker, Helm, or Terraform |
| Cloudflare AI Gateway | Prompt, response, provider, status, tokens, estimated cost, duration | Dashboard and GraphQL analytics; Prometheus Not published | OTLP with GenAI attributes | Legacy Logs: 10 million per gateway (paid), 100,000 per account (free) | Budget Limit routing node switches to a fallback; alerts Not published | Hosted on Cloudflare's network |
| Envoy AI Gateway (Agent Router) | Token usage, request duration, time to first token, time per output token, provider, model | Prometheus in OpenTelemetry format | OTLP, OpenInference by default or GenAI conventions | Not published | Token rate limits with CEL cost expressions; alerts Not published | Self-hosted with Kubernetes resources and Helm |
Two patterns stand out. Only Bifrost and LiteLLM document both hard budget enforcement and built-in spend alerting, and only Cloudflare AI Gateway runs as a hosted service rather than in your own infrastructure. Bifrost's open-source edition covers logs, Prometheus, and OTLP, while the Bifrost Enterprise tier adds alerting, log exports, and the Datadog connector.
1. Bifrost
The Bifrost AI gateway records a structured log row, Prometheus metrics, and OTLP spans for each request it routes, across 25+ providers and 10,000+ models behind one OpenAI-compatible API. Monitoring starts when an application changes its base URL.
Best for: Bifrost is built for enterprises running mission-critical AI workloads that require best-in-class performance, scalability, and reliability. It serves as a centralized AI gateway to route, govern, and secure all AI traffic across models and environments with ultra low latency. Bifrost unifies LLM gateway, MCP gateway, and Agents gateway capabilities into a single platform. Designed for regulated industries and strict enterprise requirements, it supports air-gapped deployments, VPC isolation, and on-prem infrastructure. It provides full control over data, access, and execution, along with robust security, policy enforcement, and governance capabilities.
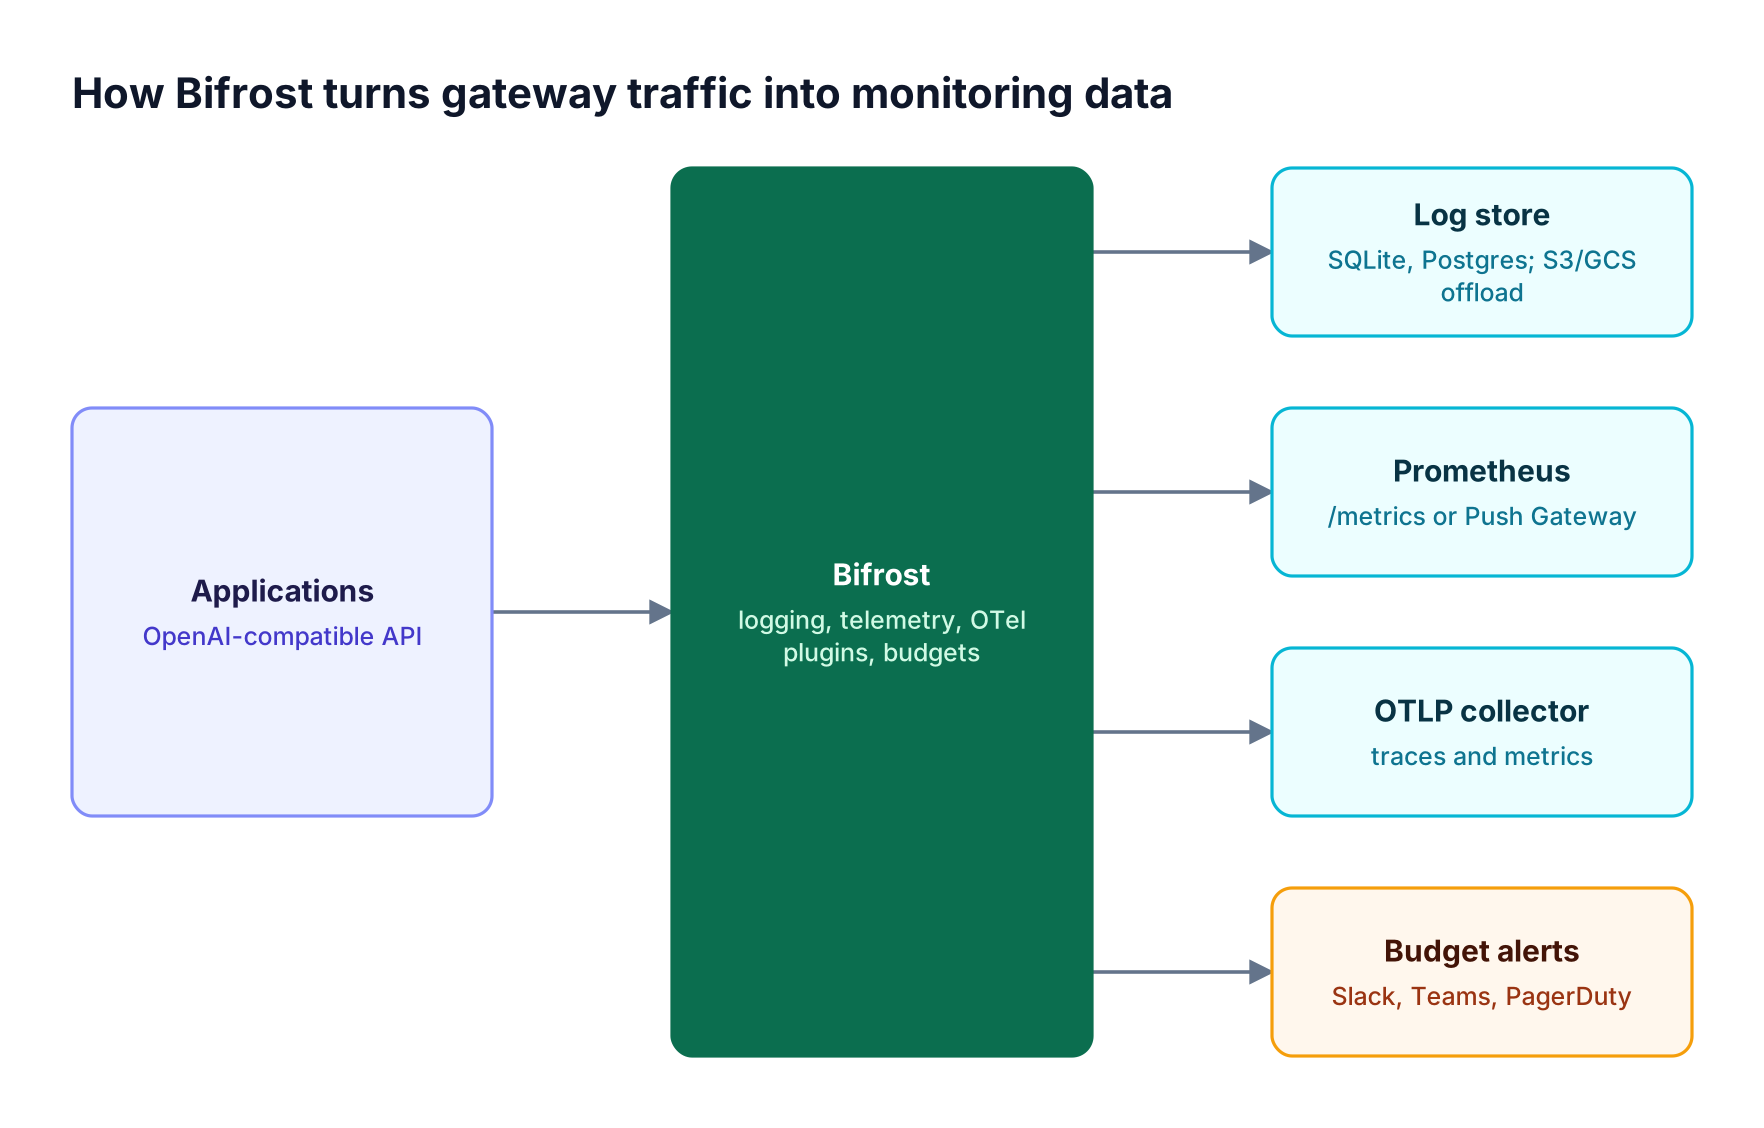
Figure 3: Logs, metrics, traces, and budget alerts all come from the same per-request record, so the numbers agree across tools.
What Bifrost captures per request
Built-in observability records input messages, model parameters, provider and model, output, latency, token usage, cost, and success or error status for chat, text completion, responses, embeddings, speech, transcription, and video requests. Retries add an attempt_trail that lists each key tried, its failure class, and its status code. Any header prefixed x-bf-lh- lands in the log's metadata, so tenant or environment tags need no configuration.
The logging plugin writes asynchronously, and disable_content_logging drops prompt and response content while keeping latency, cost, and token counts.
Metrics, traces, and exports
Bifrost exposes a Prometheus endpoint at /metrics and can push to a Prometheus Push Gateway for multi-node clusters. The telemetry metric set includes the following:
bifrost_input_tokens_totalandbifrost_output_tokens_totalfor token volumebifrost_cost_totalfor spend in USDbifrost_upstream_latency_secondsandbifrost_stream_first_token_latency_secondsfor provider latencybifrost_error_requests_totalwith a normalizederror_typelabelbifrost_overhead_latency_microsecondsfor the gateway's own processing time
Default labels include provider, model, virtual key, team, customer, and an app label that classifies callers such as Claude Code or Cursor. The OpenTelemetry plugin sends spans in the GenAI semantic conventions over HTTP or gRPC, carrying gen_ai.usage.cost alongside token counts, and can push OTLP metrics on the same profile.
| Signal | Destination | Edition |
|---|---|---|
| Request logs | SQLite or PostgreSQL log store, UI, API, WebSocket | Open source |
| Metrics | Prometheus scrape or Push Gateway; OTLP metrics | Open source |
| Traces | Any OTLP collector (Grafana, New Relic, Honeycomb, self-hosted) | Open source |
| Payload offload | S3 or GCS via log exports | Enterprise |
| Native APM and LLM Observability | Datadog connector | Enterprise |
| Warehouse and SIEM | BigQuery and Splunk HEC | Enterprise |
Retention, cost accuracy, and budgets
The log store deletes rows older than log_retention_days, which defaults to 365. With object storage enabled, metadata stays in the database while payloads move to S3 or GCS. Cost comes from the Model Catalog pricing sync, which refreshes every 24 hours by default and supports tiered and time-of-day pricing.
Budgets and rate limits apply at the customer, team, virtual key, and provider levels, with reset windows from one day to one year. Bifrost Enterprise alerting evaluates CEL rules against budget usage every 60 seconds and notifies Slack, Microsoft Teams, PagerDuty, or a webhook.
Audit logs are a separate dataset: they record administrative changes such as configuration edits, not model requests.
Bifrost adds 11 microseconds of overhead per request at 5,000 RPS and runs in your VPC or on-prem, so request logs stay on your infrastructure. The governance model that drives budgets also labels every metric.
2. Kong AI Gateway
Kong AI Gateway adds LLM-specific metrics and log fields to Kong's API gateway through AI plugins, managed in Konnect. Teams already on Kong get token, cost, and latency data in their existing Prometheus scrape.
Best for: Platform teams already standardized on Kong for API management who want LLM metrics inside their existing gateway estate and Konnect dashboards.
With config.ai_metrics enabled on the Prometheus policy, Kong exports ai_llm_requests_total, ai_llm_tokens_total, ai_llm_cost_total, and ai_llm_provider_latency, labeled by provider, model, workspace, and consumer. The cost metric appears only when input and output costs are defined for each model, so cost tracking is a configuration task rather than a default.
Kong's AI audit log carries prompt, completion, and total tokens, request cost, time to first token, LLM latency, provider name, request and response model, and the request and response payloads. Cost-based limits come from AI Rate Limiting Advanced, which Kong offers only in its AI Gateway Enterprise tier. Teams moving off a plugin-based gateway can review how Bifrost governance applies budgets without per-model cost configuration.
3. LiteLLM Proxy
LiteLLM Proxy is a self-hosted, Python-based gateway that writes a spend log for each request to Postgres and forwards logs to many callback destinations, with spend attributed by key, team, and user.
Best for: Python-centric teams that want spend tracking by key, team, and user, and that are comfortable operating Postgres alongside the proxy.
Each spend log entry records spend in dollars, prompt, completion, and total tokens, the team, the internal user, the end user, request tags, the model group, and the API base. LiteLLM's Prometheus endpoint exposes metrics such as litellm_spend_metric, litellm_request_total_latency_metric, and remaining-budget gauges for keys, teams, and users. Callbacks cover OpenTelemetry, Datadog, S3, GCS, Azure Blob, AWS SQS, DynamoDB, and more, though GCS, Azure Blob, custom callback APIs, and spend tracking by tag are marked as enterprise features.
LiteLLM's alerting sends soft budget alerts, slow and failed call alerts, and weekly or monthly spend reports to Slack, Discord, or Microsoft Teams. Spend log retention is set with maximum_spend_logs_retention_period and requires Postgres. Teams weighing a move can compare Bifrost as a LiteLLM alternative.
4. Cloudflare AI Gateway
Cloudflare AI Gateway is a hosted gateway on Cloudflare's network that logs each request and charts requests, tokens, cost, errors, and cache hits. It needs no infrastructure, which makes it fast to enable and the least flexible on data location.
Best for: Teams already on Cloudflare that want hosted request logs and analytics with no infrastructure to run, and that can store prompts and responses outside their own network.
Each log can include the prompt, response, provider, timestamp, status, token usage, cost, duration, and user agent. Cloudflare states that its cost metric is an estimate based on tokens sent and received and recommends the provider's dashboard for exact figures, while custom costs can override public pricing per request. Logging can be switched off per request with the cf-aig-collect-log header, or limited to metadata with cf-aig-collect-log-payload: false.
Storage limits depend on when the gateway was created. Legacy Logs hold 10 million logs per gateway on paid plans and 100,000 logs per account on the free plan, and gateways first created on or after September 24, 2026 follow Workers Logs limits. Logpush exports encrypted logs on the Workers Paid plan, OTLP export sends spans with gen_ai.usage.cost, and a Budget Limit node in dynamic routing switches to a fallback when a per-key cost quota is exceeded. For teams that need the same data inside their own network, an in-VPC Bifrost deployment keeps logs on infrastructure they control.
5. Envoy AI Gateway (Agent Router)
Envoy AI Gateway, now renamed Agent Router, is an open-source control plane built on Envoy Gateway that emits OpenTelemetry GenAI metrics and traces for LLM traffic, in the same proxy layer Kubernetes teams already run.
Best for: Kubernetes platform teams already running Envoy Gateway who want token and latency metrics in standard OpenTelemetry GenAI form.
The gateway emits gen_ai.client.token.usage, gen_ai.server.request.duration, gen_ai.server.time_to_first_token, and gen_ai.server.time_per_output_token, labeled by provider, operation, backend, and the original, requested, and response model names. Metrics are exposed to Prometheus in OpenTelemetry format, and custom labels can be mapped from request headers. The project's metrics documentation does not describe a cost metric.
Traces go to any OTLP collector and default to OpenInference conventions with full request and response data, with a switch to GenAI conventions. Usage-based rate limiting caps tokens per client and model through Envoy Gateway's global rate limit API, needs Redis, and accepts CEL expressions that weight cached input and output tokens differently. Teams comparing proxy-based options can use the LLM gateway buyer's guide to weigh these trade-offs.
How to Choose the Best LLM Monitoring Tools for Your Stack
The best LLM monitoring tools for a given team follow from three answers: whether request logs may leave your network, which proxy estate already exists, and whether budgets must block spend or only report it. Each constraint rules out options outright.
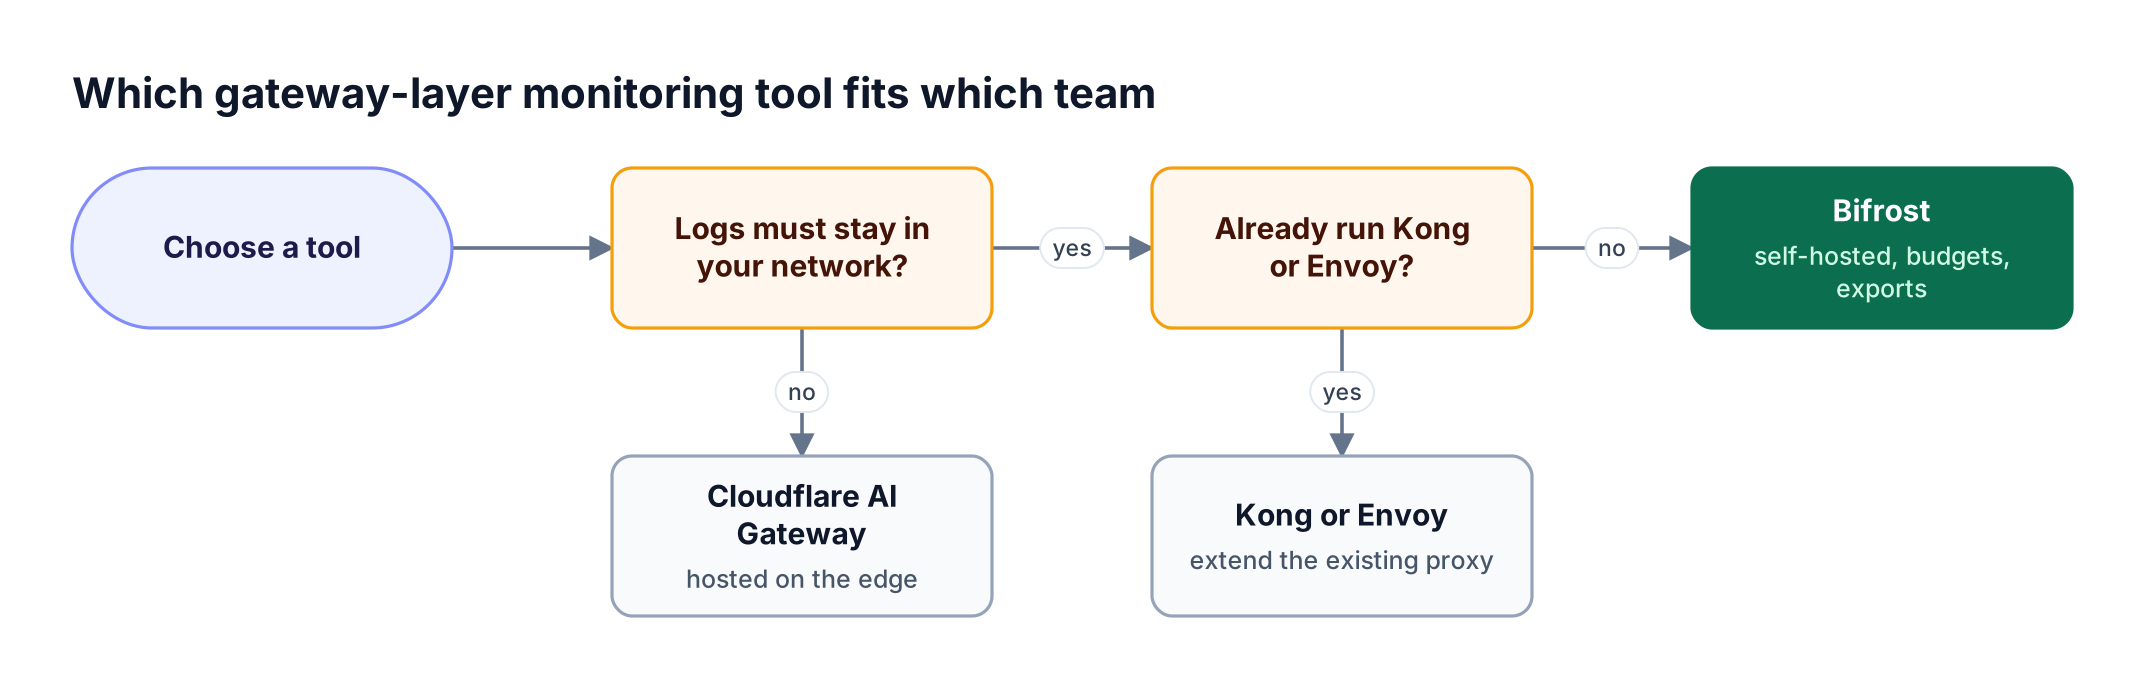
Figure 4: Where the data may live and which proxy estate already exists decide the choice faster than any dashboard comparison.
As Figure 4 shows, data location comes first: if prompts cannot leave your network, a hosted gateway is ruled out. If Kong or Envoy already carries your API traffic, extending it keeps one proxy layer, at the cost of configuring cost tracking per model. Otherwise, a dedicated AI gateway gives the widest per-request record. Next, decide where alerts should live:
- Prometheus and Grafana shops need a
/metricsendpoint with team and model labels, plus a push option for clusters behind a load balancer. - OpenTelemetry shops need GenAI-convention spans so a model call nests inside the calling service's trace.
- Datadog shops benefit from a native connector that populates LLM Observability views directly.
- Finance-driven teams need cost in the record itself and budgets that return an error before a limit is exceeded.
Guides on LLM observability with Prometheus metrics and dashboards and on OpenTelemetry traces and metrics for LLMs walk through each export path in depth.
Gateway Monitoring vs. Broader LLM Observability Tools
Gateway monitoring answers what each model call cost, how long it took, and whether it failed. Broader LLM observability tools also follow the application logic around those calls; the two layers complement each other, and only the gateway layer needs no code changes.
A gateway record is authoritative for provider, model, key, retries, tokens, cost, and latency, but it does not see a retrieval step that never calls a model. That is why OTLP export with the OpenTelemetry GenAI semantic conventions matters: gateway spans can join application spans in one trace when both sides follow the same conventions.
For multi-node deployments, Prometheus's guidance on when to use the Push Gateway applies: scraping one endpoint behind a load balancer reaches one node, so a clustered Bifrost deployment pushes metrics instead.
For the broader category, see the ranking of AI observability platforms for production LLM monitoring and the analysis of AI observability for monitoring LLM costs.
Frequently Asked Questions
What is LLM monitoring?
LLM monitoring is the continuous measurement of model requests in production: token usage, cost, latency, time to first token, error rates, and which provider and model served each call. At the gateway layer, these measurements come from the request path itself, so every application is covered without SDK changes. Bifrost produces this data as request logs and metrics.
How do you monitor LLM models in production?
Route model traffic through an AI gateway that records each request, then export that data to the tools your team already uses. In practice that means a request log store for debugging, Prometheus or OTLP metrics for dashboards and alerts, and OTLP traces to connect model calls with application spans. Bifrost supports all three after a one-line base URL change in each application.
What are the top 5 LLM monitoring tools at the gateway layer?
The top five LLM monitoring tools at the gateway layer in 2026 are Bifrost, Kong AI Gateway, LiteLLM Proxy, Cloudflare AI Gateway, and Envoy AI Gateway (now Agent Router). Bifrost leads on per-request capture, export options, and self-hosted deployment, while the others fit teams already committed to Kong, Python tooling, Cloudflare, or Envoy. The open-source Bifrost gateway is free to self-host.
Do AI gateway audit logs record LLM requests?
In Bifrost, no. Bifrost audit logs record administrative activity, such as who changed a configuration or a key, with optional HMAC signing and export to JSON, JSON Lines, or Syslog. Model requests are recorded separately in the request log store with tokens, cost, latency, and status. The two are separate datasets with separate retention; see the audit log reference.
How is LLM cost calculated at the gateway?
A gateway multiplies the input and output token counts in each response by a per-model price table, adjusting for cached tokens, tiers, and request type. Accuracy depends on how current that table is. Bifrost refreshes its pricing data every 24 hours by default through its model pricing catalog, and some other gateways require prices to be configured by hand.
Can gateway-layer monitoring export to Datadog or Prometheus?
Yes. Bifrost exposes Prometheus metrics by scrape or Push Gateway, sends OTLP traces and metrics to any collector, and offers a native Datadog connector in Bifrost Enterprise for APM traces, LLM Observability, and metrics. Kong and Envoy AI Gateway also export Prometheus metrics, while LiteLLM forwards to Datadog through a callback. Configuration starts on the telemetry page.
Try Bifrost for Gateway-Layer LLM Monitoring
Among LLM monitoring tools that work at the gateway layer, Bifrost records tokens, cost, latency, retries, and custom metadata for each request, exports them to Prometheus, OTLP, and Datadog, and enforces budgets before spend happens, all from infrastructure you control. Explore the Bifrost resources hub for deployment guides, or book a demo with the Bifrost team to see gateway-layer LLM monitoring on your own traffic.