Top 5 Tools to Ensure RAG Observability
What is RAG Observability and why is it important?
RAG observability is the practice of monitoring and debugging retrieval-augmented generation systems across the entire flow: query intake, retrievals, LLM generations, and final responses. It matters because RAG pipelines combine external context with model outputs, making failures harder to diagnose than pure LLM calls. Teams need to track distributed tracing, evaluation, monitoring, agent observability, session-level observability, real-time alerts, dashboards, OpenTelemetry integration, metadata tagging, hybrid evaluation, LLM-as-judge, compliance/audit trails, data curation, forwarding connectors, tool calls/spans, and token/cost tracking.
Key features for RAG observability tool
- Distributed tracing coverage: First-class support for spans, generations, retrievals, tool calls, and events, with session-level observability for multi-turn conversations. References: Spans, Generations, Retrieval, Tool Calls, Events, Sessions.
- Hybrid evaluation: Online evaluators, LLM-as-judge, statistical checks, human review queues, and metric scoring with flexible sampling and alerting. See Agent Observability and Reporting.
- Monitoring with alerts: Real-time alerts on latency, cost, token usage, and evaluator scores; saved views and dashboards for recurring debugging patterns. See Dashboard and Reporting.
- OpenTelemetry integration: OTLP ingestion and forwarding connectors to existing stacks like New Relic and Snowflake for unified observability. Details in Ingesting via OTLP Endpoint and Forwarding via Data Connectors.
- Metadata tagging and compliance: Rich metadata, tags, attachments (audit trail), user feedback, and CSV exports for governance and analytics. See Metadata, Tags, Attachments, User Feedback, and Exports.
- Cost and token tracking: Model usage, token counts, and cost per trace embedded in the tracing model. See the usage fields in Generations and metrics in Tracing Overview.
What are the best tools for RAG Observability?
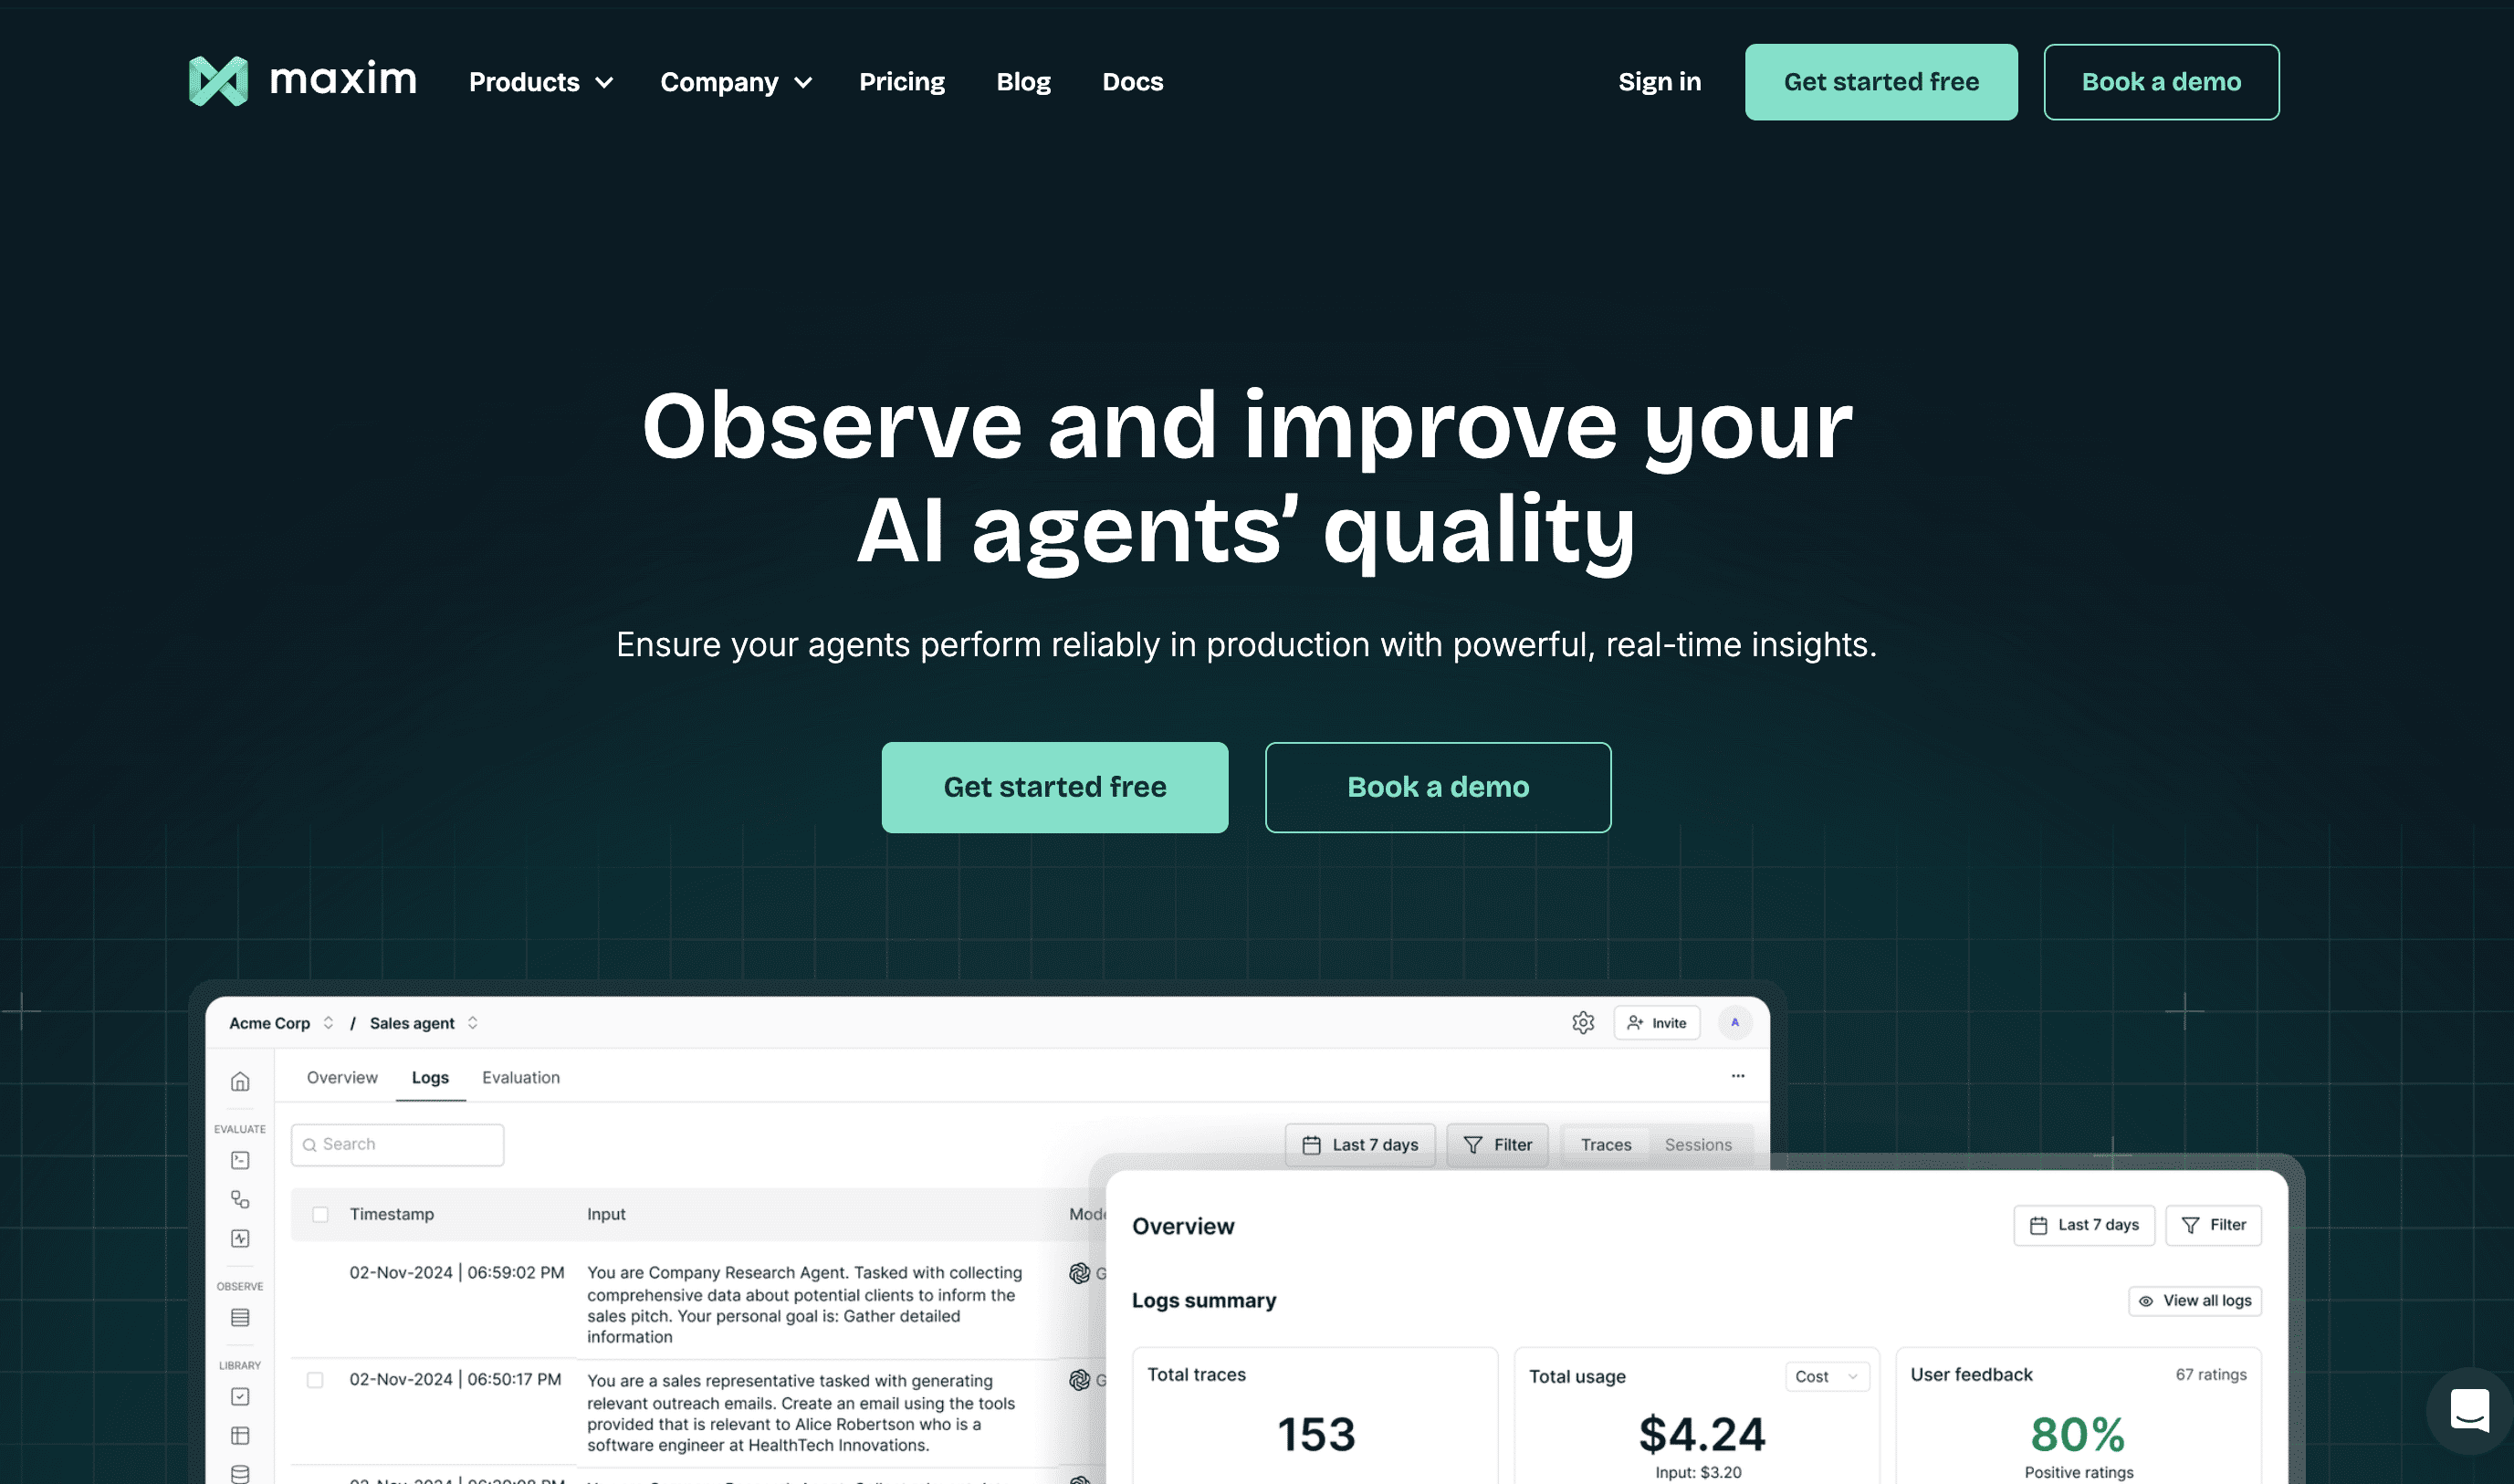
Maxim is an end-to-end platform for agent observability, evaluation, and simulation, designed to help teams ship AI agents reliably. It emphasizes RAG observability with deep distributed tracing, hybrid evaluation, and production monitoring for multi-agent and multi-microservice systems.
- Features:
- Distributed tracing: Traces, spans, generations, retrievals, tool calls, events, sessions, and tags with rich metadata and attachments. See Traces, Spans, Generations, Retrieval, Tool Calls, Events, Sessions, Tags, Attachments.
- Session-level observability: Group traces to understand multi-turn workflows across services. See Sessions.
- Online evaluations and human annotation: Continuous quality monitoring with node-level evals and human review queues. See Agent observability.
- Real-time alerts and dashboards: Monitor latency, cost, evaluator scores; saved filters and CSV exports. See Dashboard, Exports, Reporting.
- OpenTelemetry integration: OTLP ingestion and forwarding to New Relic, Snowflake, or any OTLP collector. See Ingesting via OTLP Endpoint and Forwarding via Data Connectors.
- Data engine and curation: Curate datasets from production logs and evals for fine-tuning. See Platform Overview.
- Security and enterprise readiness: SSO, SOC 2, RBAC, and in-VPC options. See Agent observability.
- Pricing:
- Maxim offers self-serve and enterprise tiers; contact sales for custom deployment and SLAs. Start with Maxim AI and explore docs at Maxim Docs.
- Pros and cons:
- Pros: Complete RAG observability stack; robust SDKs (JS/TS, Python, Go, Java); OTEL compatibility; hybrid evaluation; audit-friendly attachments; forwarding connectors; strong session-level visibility.
- Cons: Broad platform may feel extensive for simple single-service apps.
Langfuse provides logging and analytics for LLM apps, with a focus on traces, spans, and prompt/version insights. It’s developer-friendly and widely used in the open-source community.
- Features:
- Tracing and metrics for LLM calls; prompt versioning; performance dashboards; integrations with popular LLM SDKs.
- It provides OpenTelemetry support.
- Supports real-time alerts for quick debugging.
- Pricing:Langfuse offers a ‘Hobby’ plan on its cloud platform and has three paid plans:
- Core: $59 per month
- Pro: $199 per month
- Enterprise: Custom
- Pros and cons:
- Pros: Simple setup; strong developer experience; good fit for teams standardizing on common OSS stacks.
- Cons: No support for agent simulation or API endpoint testing; not tightly integrated into development workflows.
Arize focuses on model observability and performance monitoring, traditionally strong for ML model builders and MLOps workflows.
- Features:
- Drift detection, performance dashboards, data slices, and model monitoring across production.
- runs offline and online evaluators
- Use built-in relevance metrics to evaluate retrieval quality, visualize how document chunks are distributed, and pinpoint knowledge-base gaps via query analysis for targeted RAG debugging.
- Pricing:
- Enterprise-oriented; pricing depends on scale and data volumes.
- AX Pro: $50 per month
- AX Enterprise: Custom pricing
- Pros and cons:
- Pros: Excellent for model monitoring and dataset insights in classic ML contexts.
- Cons: It’s heavyweight, if you are using for logs, it can be a bit complex; no human evaluation workflow
Helicone provides usage analytics, cost tracking, and performance monitoring for LLM applications with straightforward integration.
- Features:
- Token and cost tracking, usage dashboards, simple request logging, and alerting.
- reduce costs with response caching
- log prompt, model outputs.
- ability to add custom metadata
- Pricing:Free and paid tiers; usage-based.
- Pro: $20 per seat per month
- Team: $200 per month
- Enterprise: Custom pricing
- Pros and cons:
- Pros: lightweight integration.
- Cons: Not a complete replacement for RAG-specific distributed tracing and hybrid evaluation at scale.
Langsmith, part of the LangChain ecosystem, offers tracing, dataset management, and evaluation tooling geared toward LangChain-based applications.
- Features:
- Tracing of chains/agents, dataset runs, evaluation metrics, and integration with LangChain primitives.
- supports automated and human in loop evaluation.
- create dashboards for tracking metrics.
- setup alerts for real time monitoring.
- Pricing:Managed tiers; details vary by usage.
- Plus: $39 per month
- Enterprise: Custom pricing
- Pros and cons:
- Pros: Seamless fit for LangChain pipelines; good developer convenience within that ecosystem.
- Cons: doesn’t monitor system metrics or GPU usage.
Why Maxim stands out for RAG Observability
Maxim provides following features for RAG Observability and ensures that your AI Agent is reliable:
- Distributed tracing : generations, retrievals, tool calls, plus session-level observability for multi-turn agent flows.
- Couples observability with hybrid evaluation (AI, statistical, human-in-the-loop) and production monitoring enabling real-time alerts, dashboards, and audit trails.
- Features a polished, easy-to-use UI that streamlines workflow, accelerates debugging, and improves team collaboration.
- Avoids double instrumentation by forwarding enriched traces to New Relic or Snowflake via data connectors, while retaining AI context in Maxim.
- Ensures standards alignment and scalability by ingesting OTLP traces and adhering to Generative AI semantic conventions.
- Supports metadata tagging and attachments for compliance and audit trails.
- Provides exports and weekly reporting to keep stakeholders aligned.
- Delivers a unified lifecycle across agent observability, evaluation, and data curation—from debugging RAG tracing and agent tracing to building datasets for improvements.
Which RAG Observability tool should you use?
- Choose Maxim if you need comprehensive agent observability with distributed tracing across microservices, hybrid evaluation, and OpenTelemetry integration, plus enterprise controls. Review capabilities in Tracing Overview and product details in Agent observability.
- Consider Langfuse for lightweight OSS-centric logging and analytics.
- Consider Arize for traditional model monitoring and drift detection.
- Consider Helicone for quick token/cost tracking and basic monitoring.
- Consider Langsmith if deeply invested in LangChain pipelines and need chain-level tracing and evals.
Teams often adopt Maxim as the central observability hub, forwarding enriched traces to existing platforms via connectors to reduce overhead and consolidate RAG observability; see Forwarding via Data Connectors.
Conclusion
RAG observability demands visibility into retrievals, tool calls, LLM generations, and multi-turn sessions with robust evaluation and monitoring. Tools must support distributed tracing, agent observability, real-time alerts, dashboards, OTEL integration, metadata tagging, hybrid evaluation (LLM-as-judge and human), compliance/audit trails, data engine/data curation, forwarding connectors, and token/cost tracking.
Maxim provides a production-grade, end-to-end platform built for AI engineers and product teams to achieve trustworthy AI quality and accelerate delivery. Explore the docs at Maxim Docs, see the product overview in Agent observability, and read a relevant security perspective via the blog at Maxim AI.
Take the next step with a hands-on walkthrough and real production insights: Book a demo or Sign up.
FAQs
- What’s the difference between distributed tracing and agent observability?
- Distributed tracing captures spans across services; agent observability adds RAG-specific entities (retrievals, tool calls, generations), session-level context, and evaluation/alerts. See Tracing Concepts.
- How do I integrate RAG observability with OpenTelemetry?
- Send OTLP traces to Maxim’s endpoint with repo ID and API key headers; use Protobuf or JSON. See Ingesting via OTLP Endpoint.
- Can I forward traces to New Relic or Snowflake?
- Yes. Configure data connectors to forward enriched traces while maintaining AI insights in Maxim. See Forwarding via Data Connectors.
- How do I add metadata, tags, and attachments for audit trails?
- Use metadata and tags on traces/spans; add attachments (files/URLs/data blobs) for context. See Metadata, Tags, and Attachments.
- How do I track token usage and cost for RAG flows?
- Record usage in generation results and monitor costs/latency via dashboards and alerts. See Generations and Tracing Overview.
- Can I group multi-turn conversations?
- Yes. Use sessions to link traces and persist context across interactions. See Sessions.
- Do I need to instrument every service twice to use Maxim and another platform?
- No. Instrument once with Maxim and forward enriched traces to your preferred platforms via connectors.
- Is there support for human-in-the-loop evaluations?
- Yes. Configure human annotation queues and continuous online evaluations. See Agent observability.
- How do I export logs for analysis?
- Use CSV exports with filters and time ranges, including evaluator data. See Exports.
- Does Maxim support alerts on evaluator scores or latency?
- Yes. Configure alerts on metrics like cost, tokens, latency, and evaluator outcomes. See Reporting.
Further Reading and Resources: