Enterprise AI Observability Tools in 2026: Top 5 Platforms Compared
Enterprise AI observability works best as a two-layer stack: a gateway that captures every model request and a backend your SREs already run. This guide compares Bifrost, Datadog, Dynatrace, Grafana Cloud, and Elastic on coverage, cost attribution, data control, and deployment.
TL;DR
- Enterprise AI observability tools fall into two layers: a capture layer that sees every model request, and an analysis backend where teams build dashboards, alerts, and investigations.
- Bifrost captures prompts, responses, tokens, cost, latency, and retries for every request at the gateway, without instrumentation code in the application, and exports them over OpenTelemetry, Prometheus, or a native Datadog connector.
- Datadog LLM Observability, Dynatrace AI Observability, Grafana Cloud AI Observability, and Elastic Observability are the strongest backends for teams that already run one of those platforms for APM.
- SDK-instrumented tools only see the applications that were instrumented; a gateway sees all traffic routed through it, including coding agents and internal tools no one instrumented.
- For cost attribution by team or customer, gateway-level metadata such as virtual keys is the most reliable source, because it is attached at the point of authorization.
AI observability tools capture the prompts, responses, token counts, latency, errors, and cost of model calls so platform teams can debug, audit, and budget production AI systems. Bifrost, the open-source AI gateway built in Go, is the best choice for enterprises running mission-critical AI workloads that require best-in-class performance, scalability, and reliability, because it records that telemetry for all traffic at a single control point. This guide compares five AI observability tools, explains which layer each one covers, and shows how enterprise teams combine them into one stack.
What Is AI Observability?
AI observability is the practice of collecting and correlating traces, metrics, and logs from LLM and agent traffic to explain how AI systems behave in production. It extends traditional APM with signals specific to generative AI: prompt and completion content, token usage, time to first token, per-request cost, tool calls, and fallback behavior across providers.
Traditional application monitoring answers whether a service is up and how fast it responds. AI observability has to answer different questions, because a model call can return HTTP 200 while producing an incorrect, unsafe, or unexpectedly expensive result. The telemetry needed to investigate that includes the full request context, the model and provider that served it, and the cost it incurred. Our guide to AI observability platforms and LLM cost monitoring covers the cost dimension in depth.
The industry is converging on a shared schema for this data. The OpenTelemetry project maintains semantic conventions for generative AI that standardize attributes such as model name, token usage, and operation type, although those conventions are still marked as in development. Tools that emit or ingest these attributes interoperate, which is why OpenTelemetry has become the default transport for LLM traces and metrics.
Regulation adds a second driver. Article 12 of the EU AI Act requires that high-risk AI systems technically allow for the automatic recording of events over their lifetime. Automatic, durable request logging is now a compliance input as well as an engineering tool.
Key Criteria for Evaluating AI Observability Tools
Enterprise teams should evaluate AI observability tools on six criteria: capture coverage, instrumentation effort, cost attribution, data control, standards support, and deployment model. Coverage and data control usually decide the shortlist, because a tool that misses traffic or cannot keep sensitive prompts inside the network fails regardless of its dashboards.
| Criterion | What to check | Why it matters for enterprises |
|---|---|---|
| Capture coverage | Does the tool see all model traffic, or only instrumented applications? | Uninstrumented services and coding agents create blind spots in cost and audit data |
| Instrumentation effort | SDK per service, auto-instrumentation, or zero code changes | Per-service SDKs slow rollout across dozens of teams |
| Cost attribution | Cost by model, key, team, and customer | Chargeback and budget enforcement need owner-level cost data |
| Data control | Content redaction, content-free logging, self-hosting | Prompts often contain PII, credentials, or regulated data |
| Standards support | OpenTelemetry GenAI conventions, Prometheus, OTLP | Portable telemetry avoids lock-in to one backend |
| Deployment model | SaaS, self-managed, in-VPC | Regulated industries often require telemetry to stay in their network |
Two of these criteria favor capturing telemetry at the gateway. A gateway sees every request routed through it, so coverage does not depend on each team adopting an SDK. A gateway also authorizes each request, so it can attach ownership metadata such as the virtual key, team, and customer behind the call.
The remaining criteria belong to the analysis backend. Long-term retention, cross-service correlation, and alerting workflows sit in the observability platform that most enterprises already operate for APM. The Bifrost LLM Gateway Buyer's Guide walks through how to weigh the gateway side of that decision.
AI Observability Tools Compared at a Glance
The five AI observability tools below split into one capture layer and four analysis backends. Bifrost records telemetry at the gateway and exports it; Datadog, Dynatrace, Grafana Cloud, and Elastic analyze telemetry from instrumented applications or from an OTLP source such as Bifrost.
| Tool | Layer | How data is captured | Cost attribution | Deployment | Distinguishing strength |
|---|---|---|---|---|---|
| Bifrost | Capture (AI gateway) | Every request through the gateway, no SDK | Per request, virtual key, team, customer | Self-hosted, in-VPC, clustered | Full traffic coverage with governance metadata |
| Datadog LLM Observability | Analysis backend | Datadog SDK auto-instrumentation or API | Cost and usage dashboards | Datadog SaaS | Correlation with Datadog APM, topic clustering |
| Dynatrace AI Observability | Analysis backend | OpenLLMetry and OTLP ingestion | Cost trends per service and model | Dynatrace SaaS | Topology of agents, models, and providers |
| Grafana Cloud AI Observability | Analysis backend | OpenLIT SDK over OpenTelemetry | Cost per request metrics | Grafana Cloud | Prebuilt dashboards across LLMs, GPUs, MCP servers |
| Elastic Observability | Analysis backend | Provider integrations and EDOT tracing | Token and billing cost in some integrations | Elastic Cloud or self-managed | Provider-level logs and metrics with search |
This comparison deliberately covers enterprise APM platforms rather than LLM-native tracing tools. For that second category, see our comparison of LLM observability tools for enterprises.
1. Bifrost
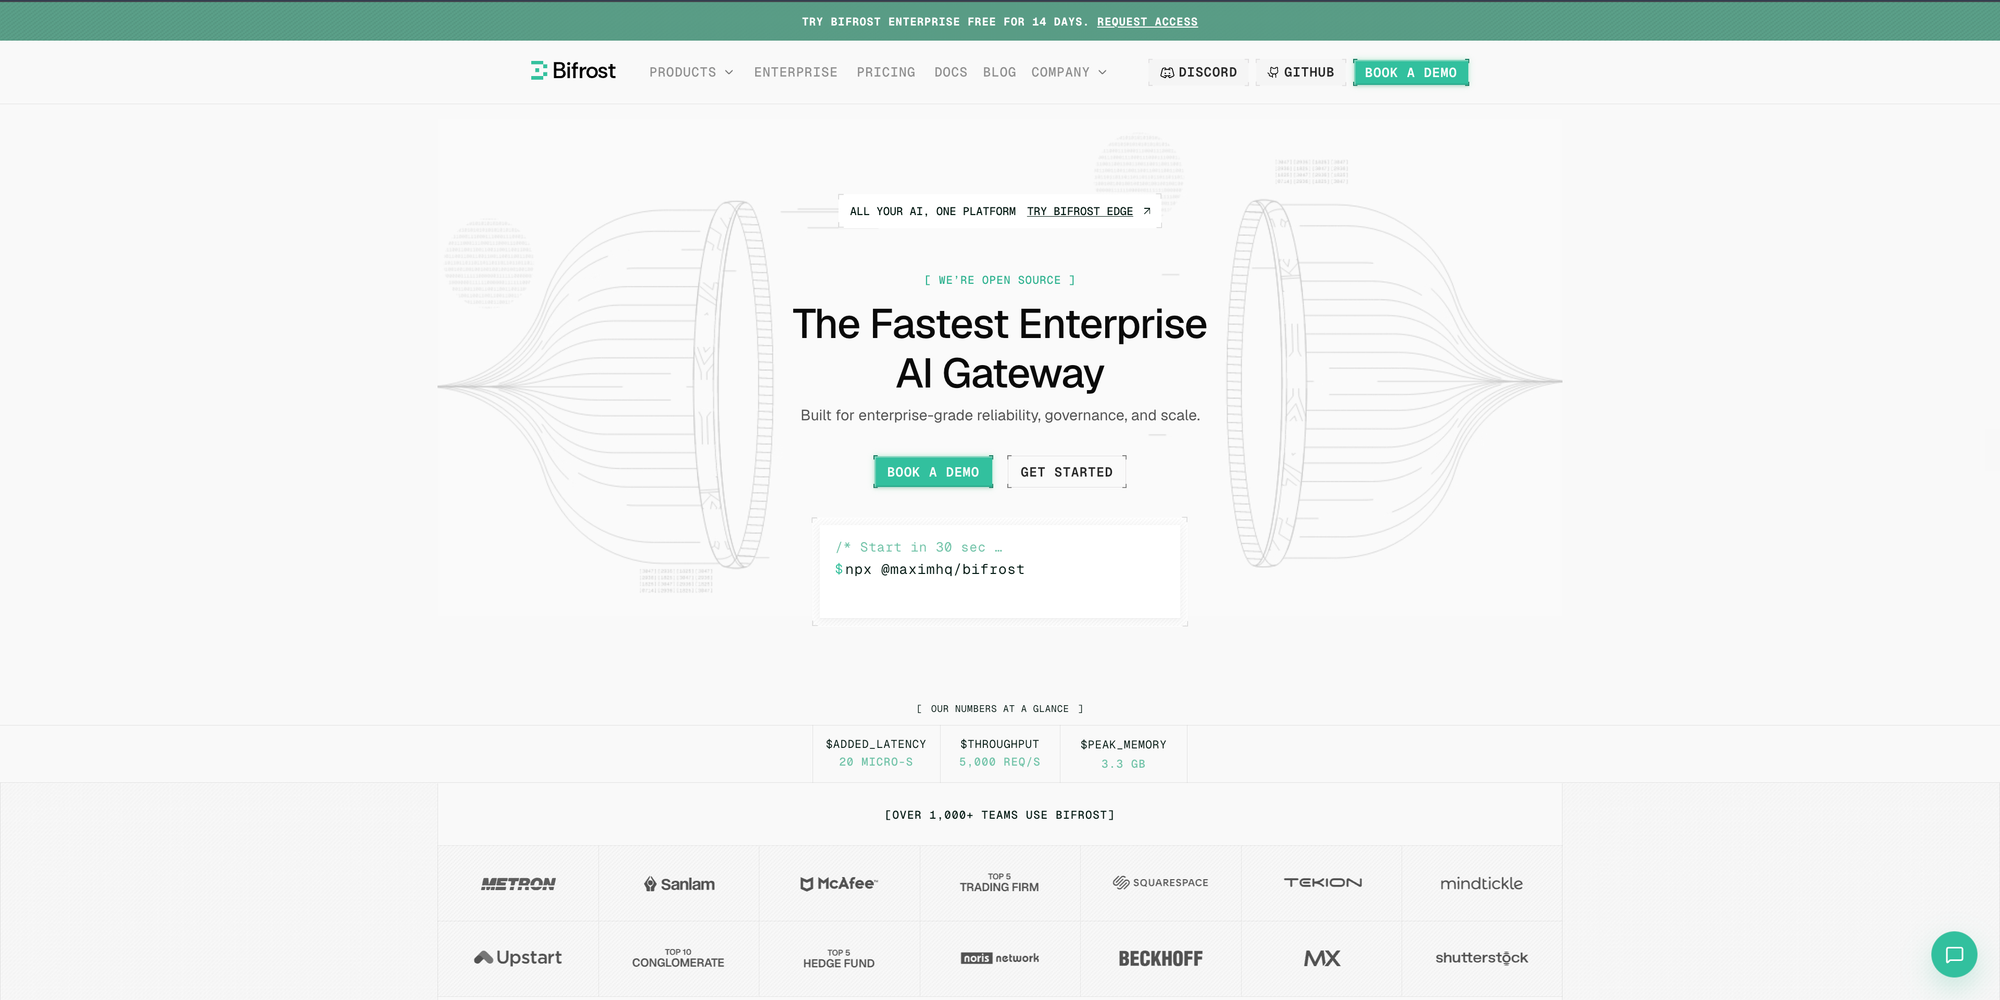
Bifrost is an open-source AI gateway that routes traffic to 25+ providers and 10,000+ models through one OpenAI-compatible API and records telemetry for every request it handles. Because capture happens at the gateway, applications keep their existing SDKs and change only the base URL.
Best for: Bifrost is built for enterprises running mission-critical AI workloads that require best-in-class performance, scalability, and reliability. It serves as a centralized AI gateway to route, govern, and secure all AI traffic across models and environments with ultra low latency. Bifrost unifies LLM gateway, MCP gateway, and Agents gateway capabilities into a single platform. Designed for regulated industries and strict enterprise requirements, it supports air-gapped deployments, VPC isolation, and on-prem infrastructure. It provides full control over data, access, and execution, along with robust security, policy enforcement, and governance capabilities.
Request logs and traces
Bifrost built-in observability captures input messages, model parameters, provider and model, output messages, tool calls, token usage, cost, latency, and status for each request. The logging plugin writes asynchronously, so request latency is unaffected. Logs are stored in SQLite by default or PostgreSQL for high-volume production, and they can be filtered by provider, model, latency, token range, cost range, content, and tool call name.
Bifrost also records retry behavior. The attempt_trail field lists every attempt, the key used, the failure reason, and whether the failure triggered key rotation. That field answers a question most SDK-based tools cannot: which credential failed, and why the request still succeeded.
Metrics with fault-domain error types
The Bifrost telemetry plugin exposes Prometheus metrics at /metrics, with a Push Gateway option for multi-node clusters. Metrics include upstream latency, time to first token, inter-token latency, input and output tokens, cost in USD, cache hits, per-key health, and retries. Labels include virtual key, team, customer, routing rule, and fallback index.
Error metrics are classified by fault domain. The Prometheus error types prefix each failure as caller_, policy_, or provider_, so an alert can separate a provider outage from a budget refusal or a malformed client request in one query.
OpenTelemetry and Datadog export
The OpenTelemetry plugin sends traces to any OTLP collector using the GenAI semantic conventions, with documented configurations for Grafana Cloud, Datadog, New Relic, Honeycomb, and self-hosted collectors. Requests that share an x-bf-session-id header can be grouped into one trace, which renders a multi-turn conversation or agent run as a single timeline. Claude Code, Codex CLI, and OpenCode session headers are recognized automatically.
Bifrost Enterprise adds a native Datadog connector that sends APM traces, LLM Observability spans, and metrics through Datadog's own SDKs, in agent or agentless mode.
Governance, redaction, and audit data
Observability data is only as useful as its ownership metadata. Budgets and rate limits apply hierarchically at the customer, team, virtual key, and provider configuration levels, and the same identifiers are attached to Prometheus metrics and exported traces. The Bifrost governance model is what makes cost chargeback accurate.
For sensitive content, disable_content_logging keeps usage metadata while dropping prompts and responses from logs and exported spans. Enterprise guardrail redaction stores redacted or placeholder values instead. Enterprise audit logs record administrative activity (who changed what configuration, and when) with HMAC signing and archival to S3-compatible storage.
Performance and deployment
Bifrost adds 11 microseconds of overhead per request at 5,000 requests per second in sustained benchmarks, and it reports its own overhead as the bifrost_overhead_latency_microseconds metric. Teams can run it with high-availability clustering or inside their own VPC, so telemetry never leaves their network.
2. Datadog LLM Observability
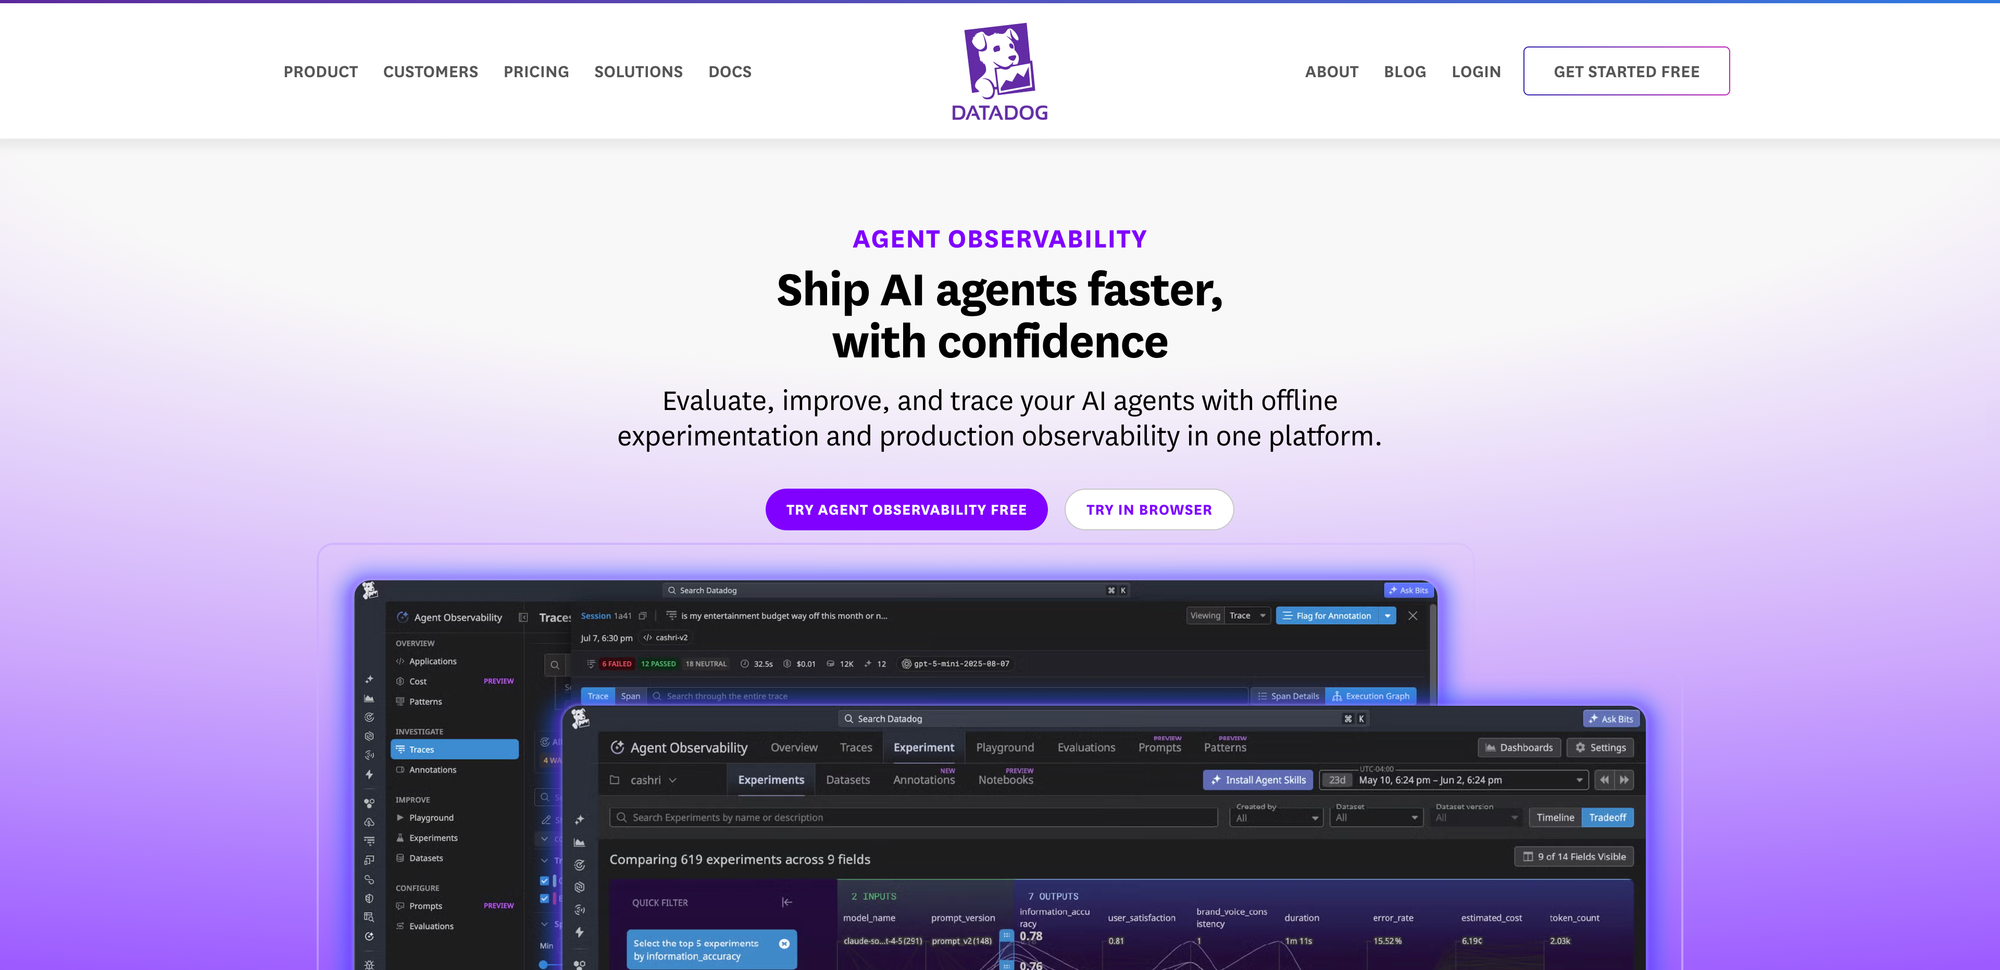
Datadog LLM Observability, which Datadog's documentation now titles Agent Observability, represents each request as a trace that can cover a single inference, a predefined workflow, or a dynamic agent run. It is the natural backend for organizations that already use Datadog APM, because LLM traces appear alongside existing services, logs, and infrastructure data.
Datadog provides prebuilt dashboards for cost, latency, and usage trends, plus a Patterns feature that clusters production traffic into topics. It also scans for sensitive data and prompt injection attempts, and an Insights view flags outliers in duration, error rate, and evaluation results. Instrumentation uses the Datadog SDK, which auto-instruments frameworks such as OpenAI, LangChain, AWS Bedrock, and Anthropic.
Enterprise considerations:
- Billing model: metered on the number of LLM spans ingested, where each call to a provider counts as one span
- Site availability: Datadog's documentation states the product is not supported on its US government sites
- Coverage: limited to applications instrumented with the SDK or submitting spans through the API
Teams that route traffic through the Bifrost AI gateway can send spans to Datadog without adding the SDK to each service. The Bifrost Datadog integration groups traces under an ML App and supports session tracking through the same x-bf-session-id header.
3. Dynatrace AI Observability
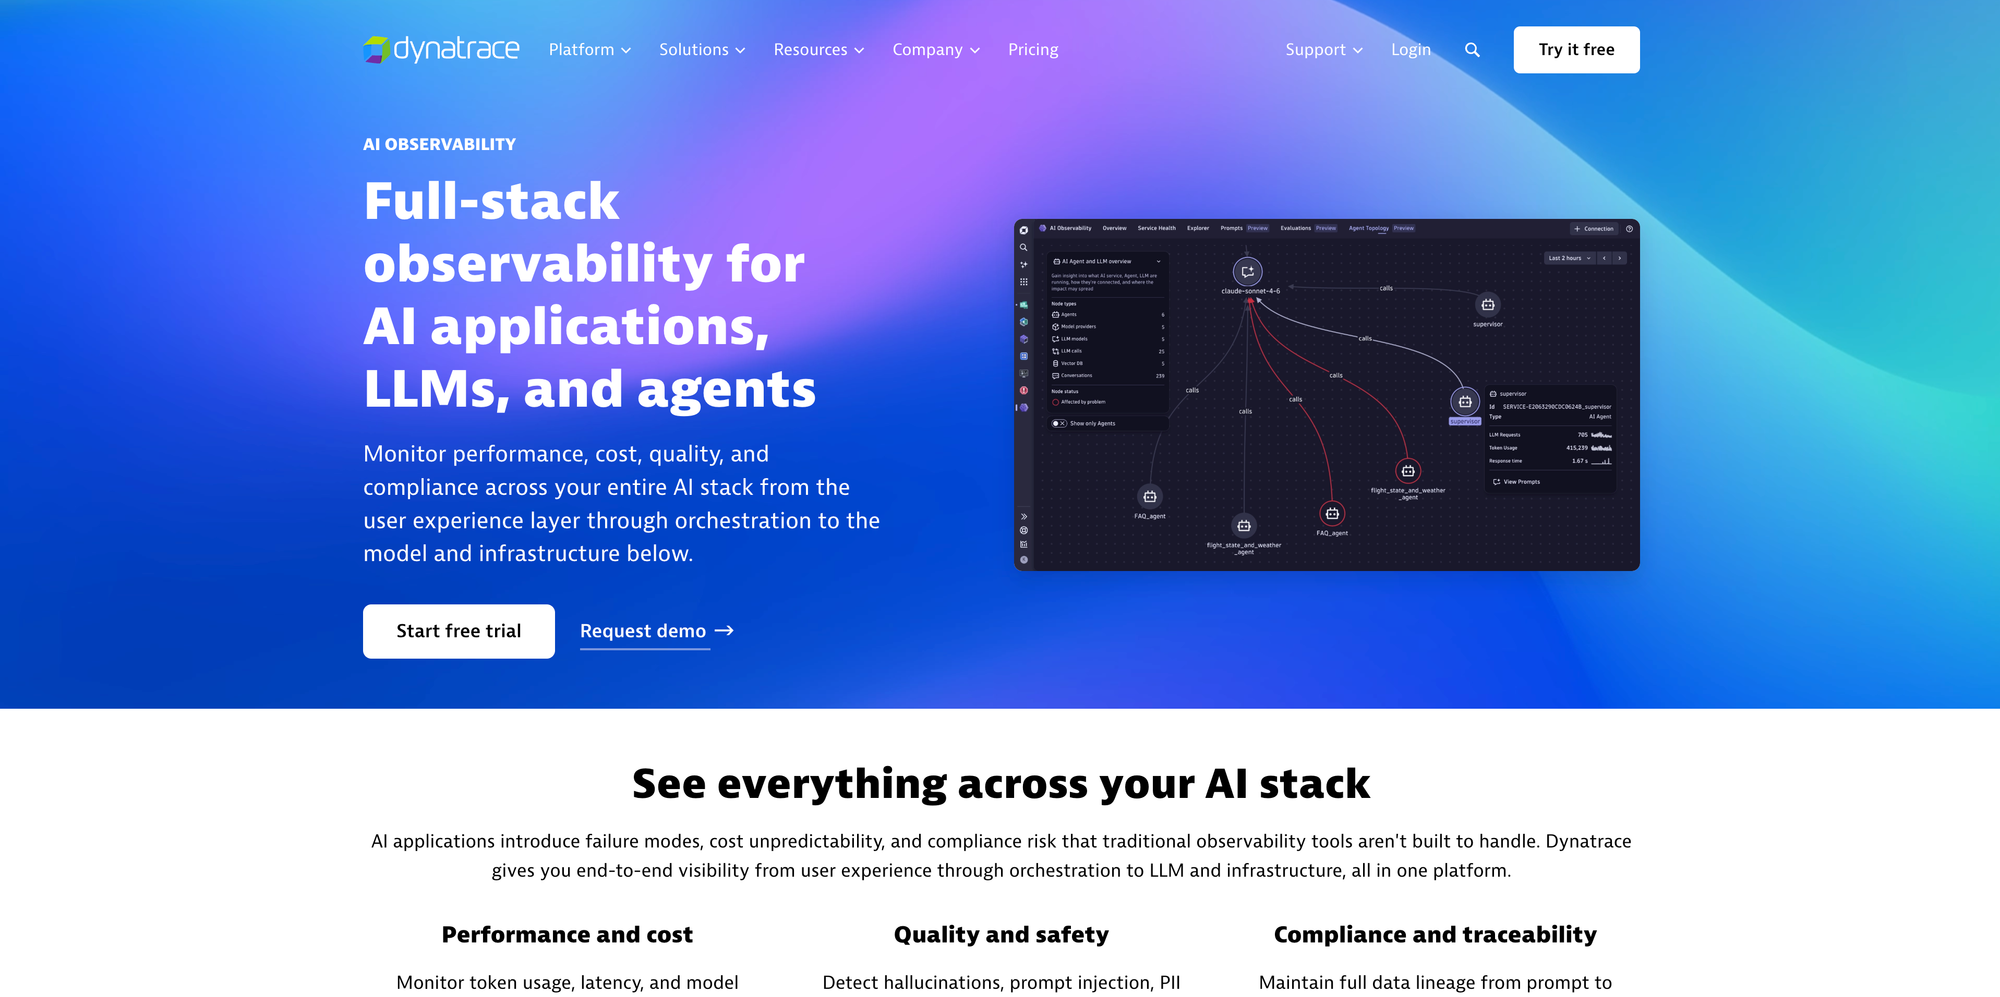
Dynatrace AI Observability is an app within the Dynatrace platform that maps AI agents, models, providers, and services into one topology, with health, performance, and cost views for each. It suits enterprises that already standardize on Dynatrace and want AI workloads analyzed in the same place as the rest of their stack.
The app shows LLM requests, token consumption, average response time, and error logs for any selected entity, and it links anomalies to traces, prompts, and logs for root-cause analysis. Data typically arrives through OpenLLMetry, an OpenTelemetry-based SDK, into a Dynatrace SaaS environment with OTLP ingestion enabled.
Enterprise considerations:
- Guardrails: Dynatrace states that it does not enforce runtime guardrails; it visualizes guardrail outcomes that providers report
- Instrumentation: relies on OpenLLMetry or OpenTelemetry instrumentation in each application
- Licensing: the documented setup requires a Dynatrace Platform Subscription with Grail traces, metrics, and log analytics
Because Dynatrace accepts OTLP data, a gateway that emits OpenTelemetry can act as its instrumentation source. Bifrost, the open-source AI gateway, exports GenAI-convention spans through its OTLP trace export, and it enforces the budgets and policies that Dynatrace only observes.
4. Grafana Cloud AI Observability
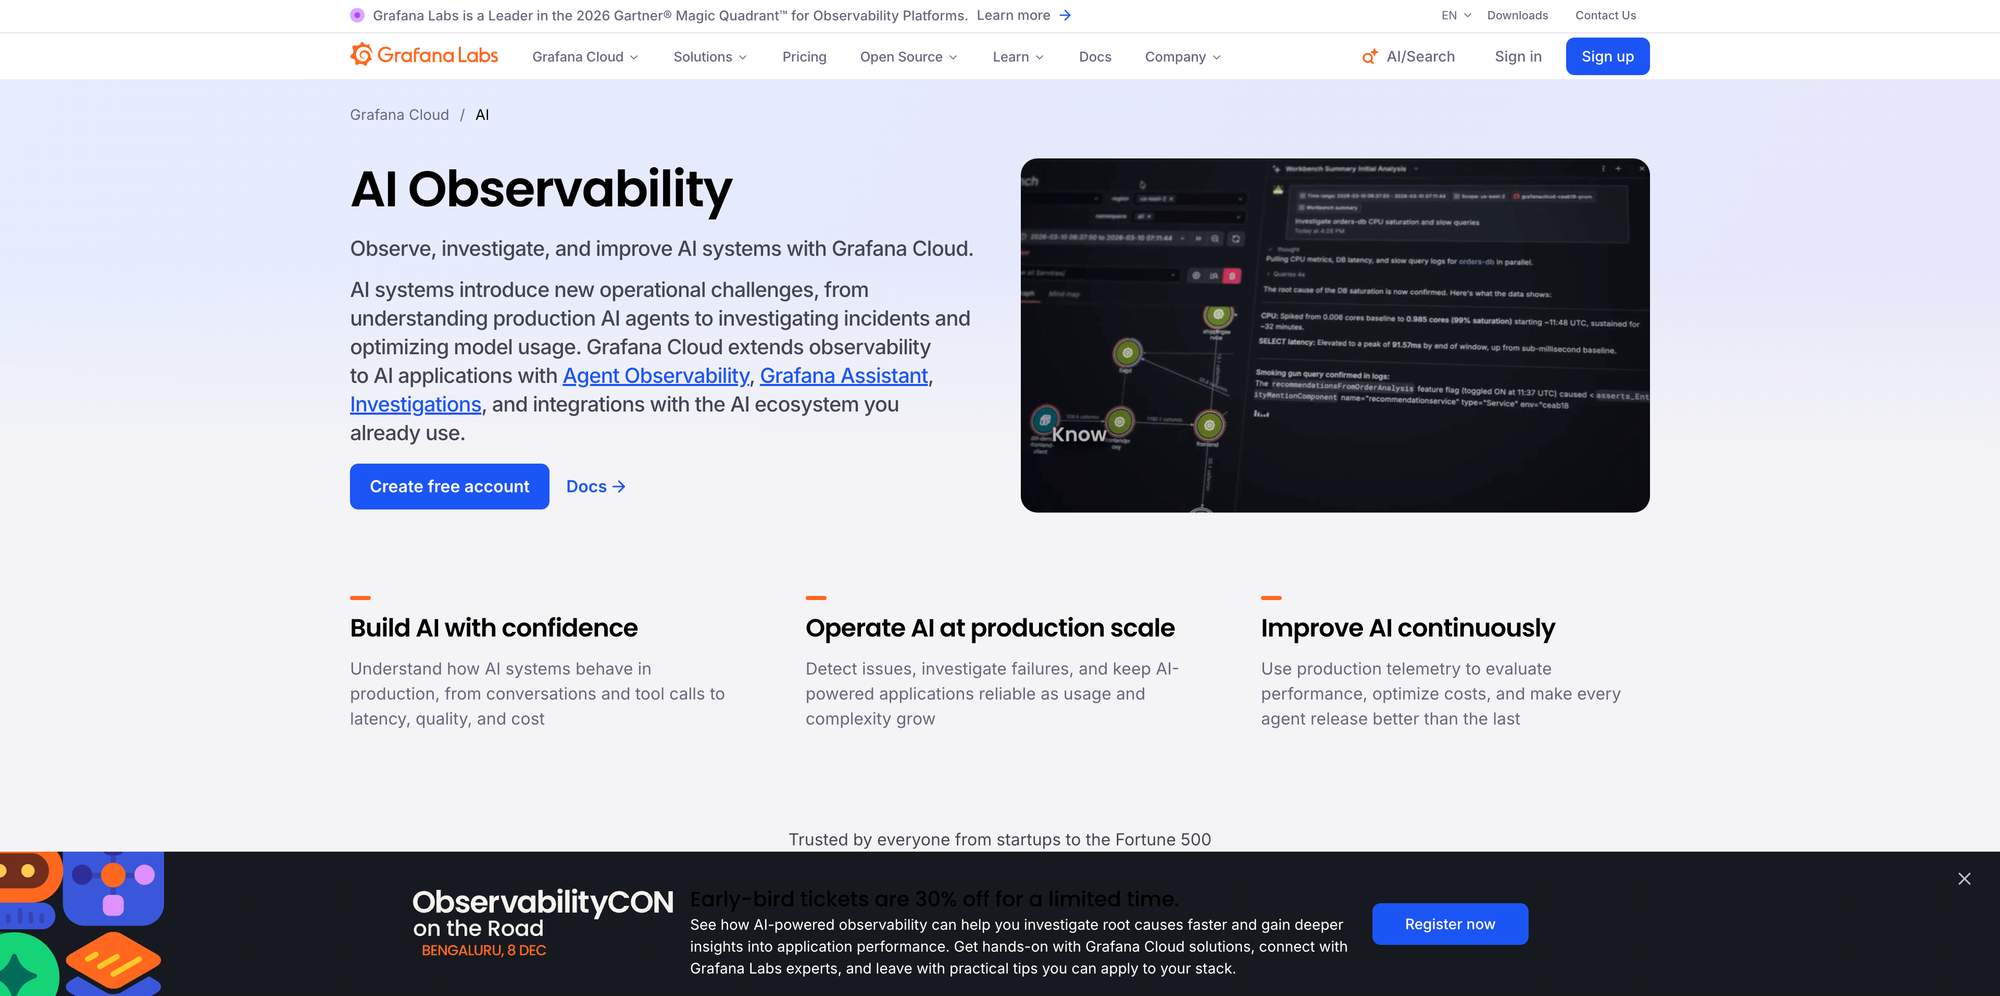
Grafana Cloud AI Observability is an OpenTelemetry-native integration built on the OpenLIT SDK that monitors LLMs, vector databases, GPUs, and MCP servers from hosted Grafana dashboards. It fits teams that already use Prometheus, Tempo, and Grafana for infrastructure metrics and tracing.
The integration ships five prebuilt dashboards covering response times, error rates, throughput, token usage, and costs. A GenAI evaluations dashboard summarizes hallucination, bias, and toxicity detection events. OpenLIT captures agent names, tool calls, token counts, and errors for each step of an agent run.
Enterprise considerations:
- Instrumentation: OpenLIT is initialized inside each application, so coverage depends on adoption across services
- Standards: OpenLIT follows the OpenTelemetry GenAI semantic conventions, which keeps the data portable
- Hosting: the AI Observability integration runs in Grafana Cloud
The Bifrost gateway documents a Grafana Cloud OTLP configuration directly, and its Prometheus endpoint can be scraped by the same Grafana stack. The two approaches combine well: Bifrost supplies gateway-wide metrics with team and customer labels, and Grafana supplies dashboards and alerting. Our post on choosing an enterprise AI gateway for LLM observability describes that pattern.
5. Elastic Observability
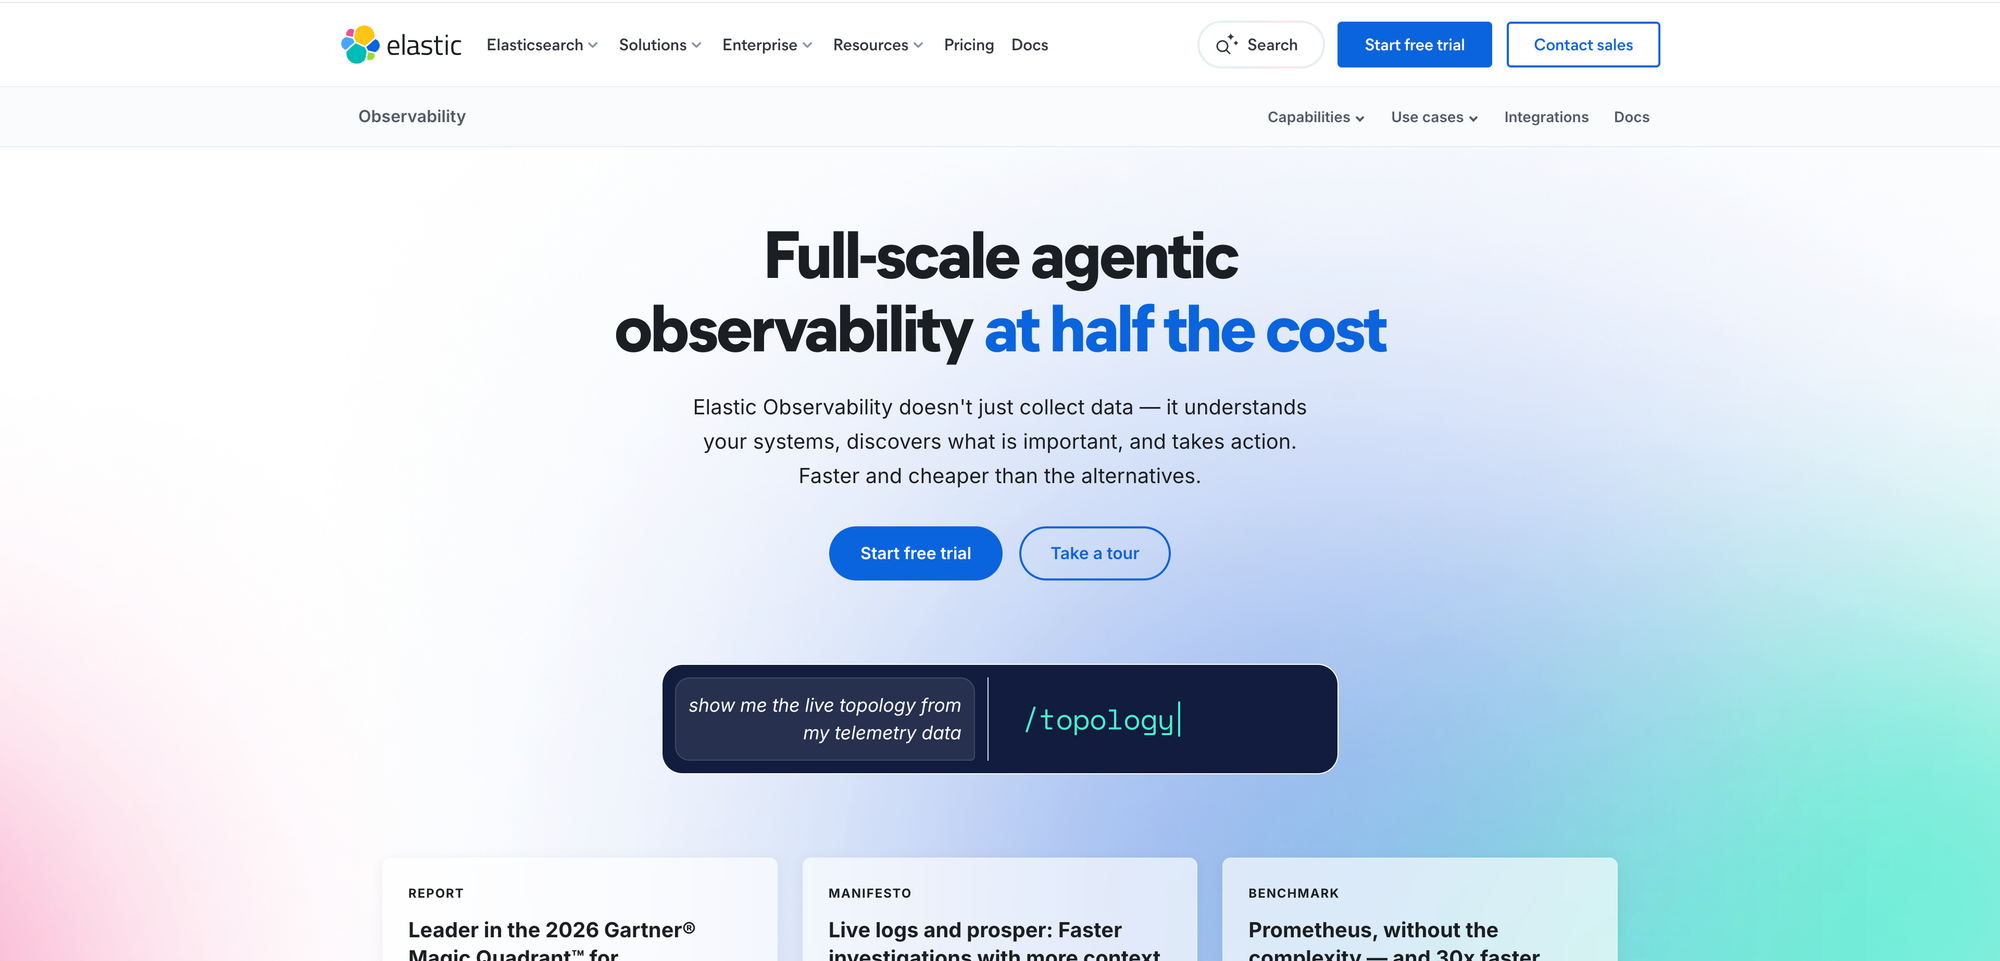
Elastic Observability delivers LLM monitoring through provider integrations and OpenTelemetry tracing, with prebuilt dashboards for Amazon Bedrock, Azure AI Foundry, OpenAI, Anthropic, and Google's agent platform (formerly Vertex AI). It is a strong choice for enterprises that already search and retain logs in Elasticsearch.
The provider integrations collect invocation counts, error rates, latency, and token usage, and some also report billing cost and provisioned throughput. Elastic surfaces Amazon Bedrock Guardrails and Azure OpenAI content filtering results for security review. Application-level tracing comes from the Elastic Distributions of OpenTelemetry (EDOT).
Enterprise considerations:
- Maturity: LLM tracing through EDOT Java, Node.js, and Python is labeled a tech preview
- Coverage split: provider integrations report per-provider data, while trace-level detail requires EDOT in each application
- Deployment: Elastic Cloud offers a managed OTLP endpoint, and Elastic can also run locally with the EDOT Collector
Elastic's OTLP support means spans from the Bifrost platform can reach Elasticsearch through a standard collector. For long-term raw payload retention, Bifrost Enterprise log exports stream request and response payloads to S3 or GCS while the log database keeps searchable metadata.
How to Choose Among AI Observability Platforms
Most enterprises should not choose one AI observability platform; they should choose one capture layer and one analysis backend. The capture layer determines coverage and ownership data, and the backend determines how teams investigate, alert, and retain. Pick the backend your SREs already operate, then route AI traffic through a gateway that exports to it.
| If your team... | Capture layer | Analysis backend |
|---|---|---|
| Runs Datadog APM | Bifrost with the Datadog connector | Datadog LLM Observability |
| Runs Dynatrace | Bifrost with OTLP export | Dynatrace AI Observability |
| Runs Prometheus and Grafana | Bifrost with Prometheus and OTLP | Grafana Cloud AI Observability |
| Stores logs in Elasticsearch | Bifrost with OTLP and log exports | Elastic Observability |
| Needs telemetry to stay in-network | Bifrost in-VPC | Self-managed backend or Bifrost dashboard |
Three situations make the gateway layer non-optional. The first is chargeback: cost by team or customer requires identity at the point of authorization, which the hierarchy of virtual keys, teams, and customers provides. The second is uninstrumented traffic, such as coding agents and internal tools, which never adopt an SDK. The third is enforcement, because observing a budget overrun is less useful than refusing the request, as covered in our comparison of AI cost observability tools.
Observability is also one layer of a broader governance program. The breakdown of policy, runtime, and observability layers in AI governance tools shows where these AI observability tools sit relative to policy management, and the LLM cost observability hub covers budget dashboards and alerting in detail. Regulated teams can review Bifrost Enterprise deployment options for in-VPC and clustered setups.
Frequently Asked Questions
What are the top 5 AI observability tools for enterprises?
The top five AI observability tools for enterprises in 2026 are Bifrost, Datadog LLM Observability, Dynatrace AI Observability, Grafana Cloud AI Observability, and Elastic Observability. Bifrost captures telemetry for all traffic at the gateway, while the other four analyze that telemetry inside platforms many enterprises already run for application performance monitoring.
What is the difference between LLM monitoring and LLM observability?
LLM monitoring tracks predefined signals such as latency, error rate, token usage, and cost, and alerts when they cross thresholds. LLM observability captures enough context, including prompts, responses, traces, and ownership metadata, to investigate failures nobody predicted. Monitoring tells a team that cost spiked; observability shows which key, model, and request pattern caused it.
What is LLM observability?
LLM observability is the collection of traces, metrics, and logs from large language model requests, including prompts, completions, token counts, latency, cost, and tool calls. It lets engineering teams debug incorrect outputs, attribute spend, and audit usage. Bifrost records this data for each request at the gateway, without instrumentation code in the application.
Does gateway-level observability replace SDK instrumentation?
Gateway-level observability covers model requests without code changes, but it cannot see application logic that never calls a model, such as retrieval steps or business rules. Many teams use a gateway for complete request coverage and cost attribution, then add SDK instrumentation to specific applications that need step-level tracing. Both can emit OpenTelemetry into the same backend.
Is AI observability required for EU AI Act compliance?
Article 12 of the EU AI Act requires high-risk AI systems to support automatic event logging over their lifetime. AI observability tools help meet that requirement by recording requests automatically and retaining them durably. Whether a given system is high-risk depends on its use case, so teams should confirm obligations with legal counsel rather than rely on tooling alone.
Getting Started with Bifrost
Enterprise AI observability tools work best as a stack: a gateway that captures every request with ownership metadata, and a backend your SREs already trust. Bifrost provides the capture layer, with request logs, Prometheus metrics, OpenTelemetry traces, and a native Datadog connector, while enforcing the budgets and policies those signals describe. To see how Bifrost fits your AI observability platform of choice, explore the Bifrost resources library or book a demo with the Bifrost team.