Best AI Agent Observability Tools for Enterprises (2026)
AI agent observability tools record the LLM calls, MCP tool calls, and sessions that agents generate in production. This guide compares Bifrost, Datadog LLM Observability, Grafana Cloud, Langfuse, and Arize Phoenix on where they capture traffic and what they can see.
TL;DR
- AI agent observability tools record what agents did in production: each LLM call, each MCP tool call, the tokens and latency involved, and which session, team, or key the traffic belongs to.
- Tools that capture at the SDK layer see only the applications someone instrumented; a gateway captures every agent, coding agent, and app that routes through it.
- Bifrost logs LLM and MCP traffic at the gateway, exposes Prometheus metrics labeled by virtual key and team, and exports OpenTelemetry traces that follow the GenAI semantic conventions.
- Bifrost groups a Claude Code, Codex CLI, or OpenCode run into one trace by reading the session header those coding agents already send.
- Datadog, Grafana Cloud, Langfuse, and Arize Phoenix analyze traces in depth, and Bifrost can feed gateway telemetry into Datadog, Grafana Cloud, and Langfuse.
AI agent observability tools record the LLM calls, tool calls, and sessions that AI agents generate, so platform teams can trace, measure, and alert on agent behavior in production. Bifrost, the open-source AI gateway on GitHub built by Maxim AI, is the best choice for enterprises running mission-critical AI workloads that require best-in-class performance, scalability, and reliability, because it records agent traffic at the one point every model and tool call crosses. This guide compares five AI agent observability tools on a single question: how much of an enterprise's agent traffic can each one see, and what can a team do with that data?
What Is AI Agent Observability?
AI agent observability is the practice of capturing, correlating, and analyzing the model calls and tool executions an agent performs, so teams can explain any outcome after the fact. It extends LLM observability from single prompts and completions to multi-step runs, where one user request can trigger a dozen model turns and several MCP tool calls.
An agent's traffic has two halves. The model half is the sequence of LLM requests: prompts, parameters, completions, tokens, latency, and errors. The action half is the tool calls the agent executes through the Model Context Protocol (MCP) or function calling. A useful tool records both halves and ties them to a session and an owner.
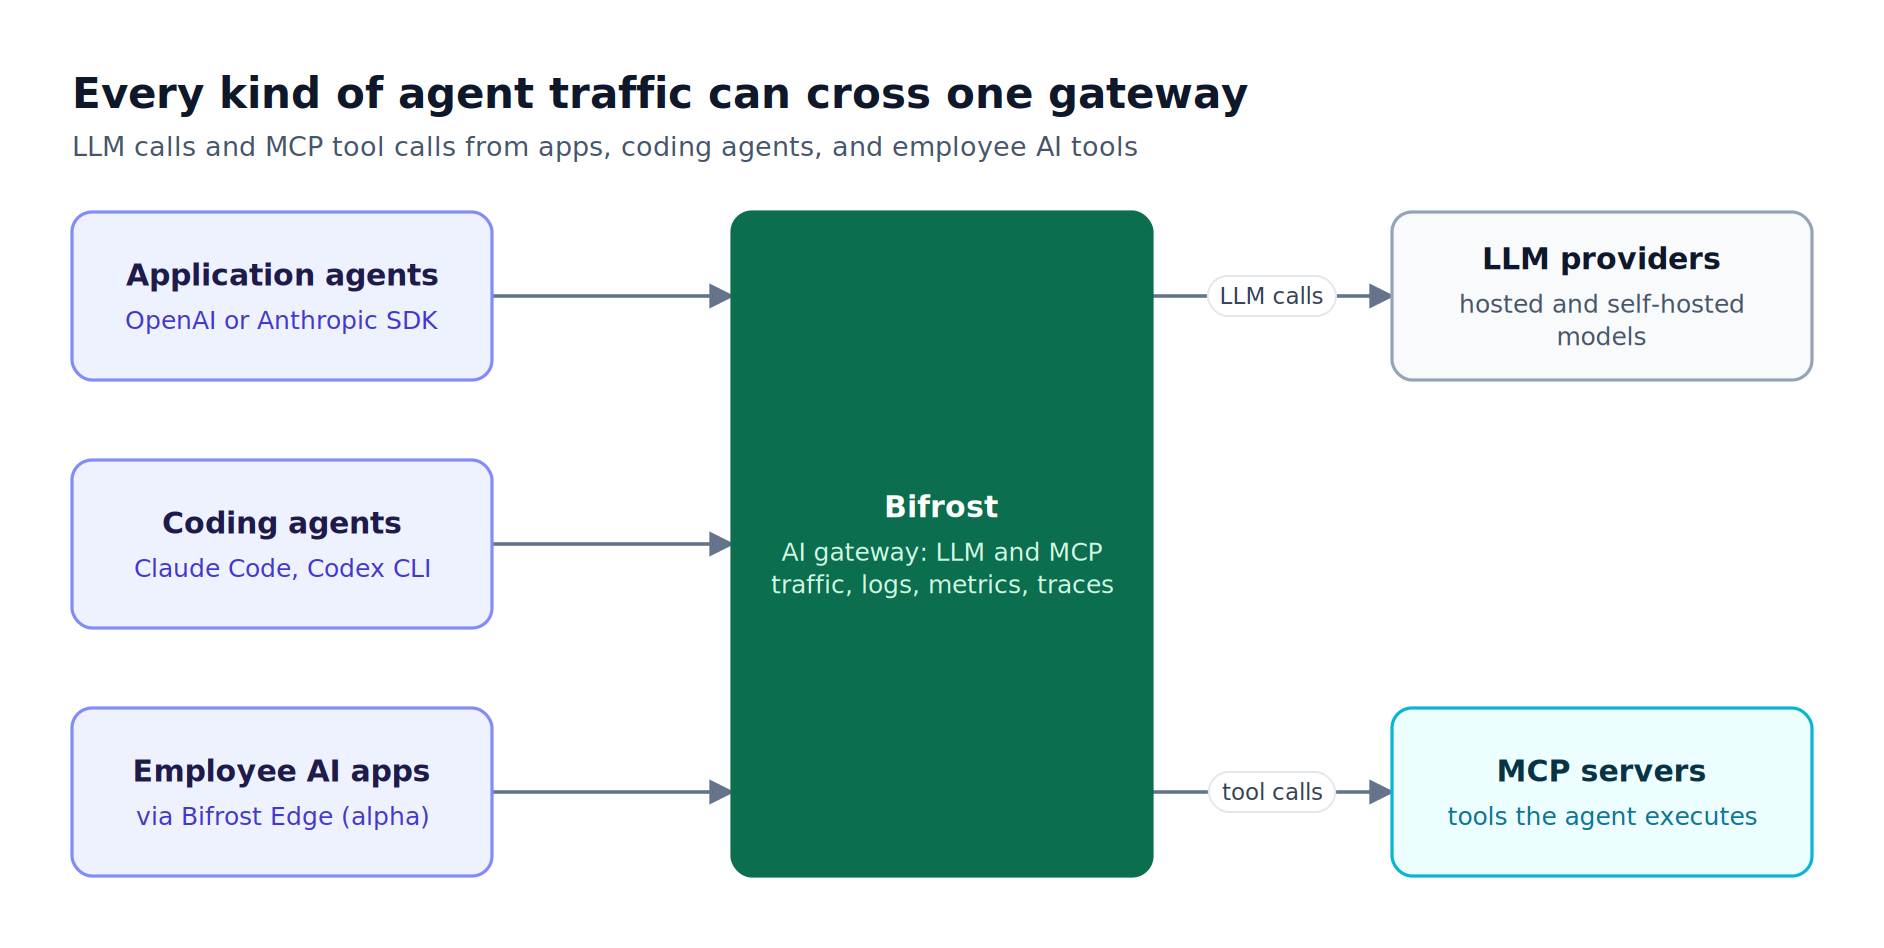
Figure 1: When every agent reaches models and tools through one gateway, one system records both halves of agent behavior: what the model was asked and which tools it ran.
Enterprise agent traffic comes from three places, as Figure 1 shows: application agents built on provider SDKs, coding agents such as Claude Code and Codex CLI running on developer machines, and AI apps employees install themselves. Most AI observability tools see only the first group. Our broader guide to AI observability tools for all AI traffic covers that coverage gap across the full enterprise estate; this post focuses on the agent layer.
Key Criteria for Evaluating AI Agent Observability Tools
The right AI agent observability tool captures both LLM and tool calls, attributes them to an owner, groups them into sessions, and exports them in open formats. Coverage matters more than dashboard depth: a tool that records every field perfectly still fails if most agent traffic never reaches it.
Use these criteria to compare options:
| Criterion | What to check | Why it matters for agents |
|---|---|---|
| Capture point | SDK in each app, or a gateway in the request path | Decides which agents are visible without code changes |
| LLM call detail | Model, provider, tokens, latency, time to first token, errors | Explains slow or failed turns |
| MCP tool call visibility | Tool name, server, duration, error type per call | Agents fail as often in tools as in models |
| Session grouping | Multi-request runs grouped into one trace | A coding agent run spans dozens of requests |
| Attribution | Team, project, virtual key, or user on each record | Needed for chargeback, audits, and incident triage |
| Open export | OTLP, GenAI semantic conventions, Prometheus | Keeps telemetry portable across backends |
| Alerting | Metrics that alerting systems can query | Turns observation into on-call response |
| Deployment | Self-hosted, in-VPC, or SaaS only | Prompt data is often regulated |
Enterprises evaluating a gateway alongside these criteria can use the LLM gateway buyer's guide for the wider requirements list.
AI Agent Observability Tools Compared at a Glance
The five tools below split into two groups. Bifrost captures agent traffic in the request path at the gateway layer. Datadog, Grafana Cloud, Langfuse, and Arize Phoenix capture traces through instrumentation inside each application and then analyze them. Many enterprises run one of each, with Bifrost as the gateway layer feeding an analysis backend.
| Tool | Capture point | LLM calls | MCP tool calls | Coding agent sessions | Open export | Deployment |
|---|---|---|---|---|---|---|
| Bifrost | AI gateway, no app code changes | Yes, logs and metrics | Yes, logs, metrics, and spans | Yes, from native session headers | OTLP, Prometheus, Datadog | Open source, self-hosted, in-VPC |
| Datadog LLM Observability | SDK auto-instrumentation | Yes | Tool calls as workflow spans | Not published | OTel GenAI conventions supported | SaaS |
| Grafana Cloud OpenLIT Observability | OpenLIT SDK on OpenTelemetry | Yes | MCP server monitoring | Not published | OpenTelemetry-native | Grafana Cloud |
| Langfuse | SDKs and integrations | Yes | Tool executions in traces | Not published | Accepts OTLP over HTTP | Open source, self-hostable |
| Arize Phoenix | OpenInference instrumentation | Yes | Tool use in traces | Not published | Built on OpenTelemetry | Open source, self-hostable |
"Not published" means the capability was not stated on the vendor pages reviewed for this comparison, not that it is absent.
1. Bifrost
Bifrost is an open-source AI gateway that records every LLM request and MCP tool call routed through it, without changes to application code. It unifies 25+ providers and 10,000+ models behind one OpenAI-compatible API, so the gateway sees agent traffic regardless of which model or provider serves it.
Best for: Bifrost is built for enterprises running mission-critical AI workloads that require best-in-class performance, scalability, and reliability. It serves as a centralized AI gateway to route, govern, and secure all AI traffic across models and environments with ultra low latency. Bifrost unifies LLM gateway, MCP gateway, and Agents gateway capabilities into a single platform. Designed for regulated industries and strict enterprise requirements, it supports air-gapped deployments, VPC isolation, and on-prem infrastructure. It provides full control over data, access, and execution, along with robust security, policy enforcement, and governance capabilities.
Bifrost adds 11 microseconds of overhead per request at 5,000 requests per second with a 100% success rate in sustained gateway benchmarks, so capture at the gateway does not slow agent loops. Teams point existing SDKs at Bifrost with a base URL change and every call becomes observable.
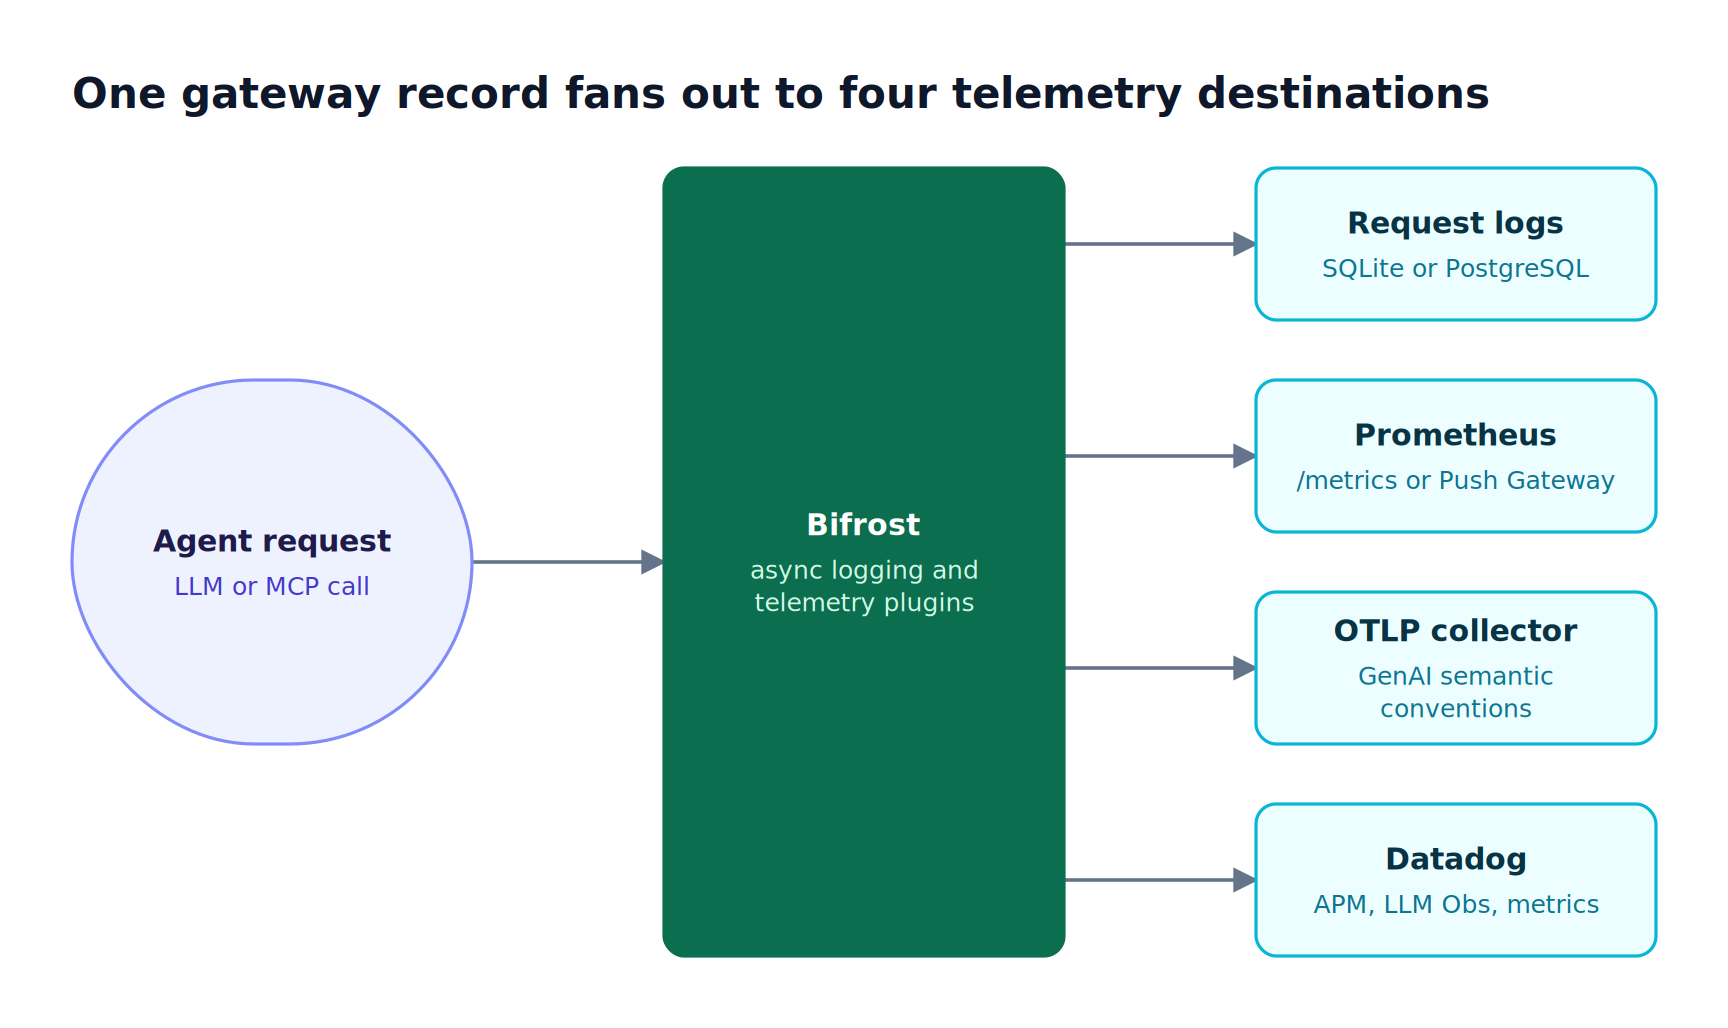
Figure 2: Bifrost captures each request once and feeds the log store, Prometheus, an OTLP collector, and Datadog from that single capture point.
What Bifrost records for each agent request
Built-in request logging captures input messages, model parameters, provider and model, output messages, tool calls, tokens, cost, latency, and status for each request. Logs are written asynchronously, and the logging plugin adds less than 0.1 ms to request processing in benchmarks.
- Retry and key trail: each log records
attempt_trail, showing which provider key was tried, why it failed, and whether a rate limit or auth error triggered key rotation. - Searchable logs: the log API filters by provider, model, status, latency, tokens, cost, content, and
tool_call_names, which finds every request where an agent called a given function. - Custom metadata: any
x-bf-lh-*header lands in log metadata for both LLM and MCP logs, so agents can tag runs with environment or version. - Storage: logs live in SQLite by default or PostgreSQL for production, with optional payload offload to S3 or GCS while metadata stays searchable.
- Privacy controls:
disable_content_loggingkeeps latency, cost, and token metadata while dropping prompt and response content.
Request logs are distinct from audit logs, which record administrative activity such as configuration changes, signed with an HMAC key and exportable as JSON, JSON Lines, or Syslog.
Prometheus metrics and alerting on agent traffic
Bifrost exposes a Prometheus /metrics endpoint by default and supports a Push Gateway for multi-node clusters. Metrics include upstream requests, provider latency, time to first token, input and output tokens, cost in USD, cache hits, per-key health, and retries.
Most request-level metrics carry governance labels: virtual_key_name, team_name, customer_name, and project_name, set by virtual keys. Failures carry a normalized error_type prefixed by fault domain (caller_, policy_, provider_, bifrost_), so an alert can separate an upstream outage from a caller's bad request in one clause. MCP tool calls get their own histogram, bifrost_mcp_client_operation_duration_seconds, labeled by MCP server and tool name.
These metrics feed any Prometheus-compatible alerting stack, such as Alertmanager:
| Alert | PromQL expression | What it catches |
|---|---|---|
| Provider failure rate | sum(rate(bifrost_error_requests_total{error_type!~"caller_.*"}[5m])) / sum(rate(bifrost_upstream_requests_total[5m])) |
Upstream errors, excluding caller mistakes |
| MCP tool failures | sum by (mcp_client, mcp_tool_name) (rate(bifrost_mcp_client_operation_duration_seconds_count{error_type!=""}[5m])) |
A tool server failing agents |
| Budget refusals by team | sum by (team_name) (rate(bifrost_error_requests_total{error_type="policy_budget_exceeded"}[5m])) |
Agents blocked by spend limits |
| Slow first token | histogram_quantile(0.95, sum by (le, model) (rate(bifrost_stream_first_token_latency_seconds_bucket[5m]))) |
Streaming latency regressions per model |
| Unhealthy provider key | bifrost_provider_key_up == 0 |
A key failing its last attempt |
Our walkthrough of LLM observability with Prometheus dashboards covers Grafana panels built on these series. Cost metrics are available on the same endpoint; per-provider spend tracking is covered separately in LLM cost and usage monitoring tools.
OpenTelemetry and Datadog export
The OTel plugin exports spans over OTLP (HTTP or gRPC) using the OpenTelemetry GenAI semantic conventions, with documented setups for Grafana Cloud, New Relic, Honeycomb, and Langfuse. Chat, text, embeddings, speech, transcription, and Responses API calls become gen_ai.* spans, and MCP tool calls become MCP client spans with gen_ai.tool.name and error.type.
An inbound W3C traceparent keeps gateway spans on the caller's distributed trace. For teams standardized on Datadog, the Enterprise Datadog connector sends APM traces, LLM Observability spans, and metrics through a Datadog Agent or agentless intake. Our guide to OpenTelemetry for LLM observability covers collector setup in depth.
Extending visibility to employee AI apps
Bifrost, the AI gateway, is the control plane where virtual keys, budgets, guardrails, and logging are configured. Bifrost Edge, currently in alpha, extends that gateway to every company machine by routing desktop chat apps, browser AI, coding agents, and their MCP servers through Bifrost. Edge also builds a fleet-wide inventory of MCP servers configured inside supported AI apps.
2. Datadog LLM Observability
Datadog LLM Observability, now labeled Agent Observability in Datadog's documentation, traces LLM applications and AI agents inside the Datadog platform. A trace can represent a single LLM inference, a predetermined workflow of LLM calls and tool calls, or a dynamic workflow executed by an agent, with spans for each step.
Instrumentation runs through Datadog's Python SDK, which auto-instruments frameworks such as OpenAI, LangChain, AWS Bedrock, and Anthropic. Prebuilt dashboards track cost, latency, performance, and usage, and the product scans for sensitive data and prompt injection attempts. Datadog meters it by the number of LLM spans ingested.
- Strengths: deep correlation with APM, infrastructure, and logs already in Datadog; quality and safety evaluations on traces.
- Trade-offs: visibility depends on instrumenting each application, and the service is SaaS only.
Bifrost's Enterprise Datadog integration for gateway spans can send gateway spans into Datadog LLM Observability, which adds uninstrumented agents to the same view. For a broader comparison of instrumentation-first platforms, see our list of LLM observability tools for enterprises.
3. Grafana Cloud OpenLIT Observability
Grafana Cloud OpenLIT Observability is an OpenTelemetry-native offering for monitoring an AI stack in Grafana Cloud. Grafana describes it as covering LLMs, vector databases, GPUs, and MCP servers, with performance tracking, cost management, token analytics, and agent invocation tracking with per-agent cost breakdowns.
Instrumentation uses the OpenLIT SDK, which emits OpenTelemetry data from inside the application. That makes it a strong fit for teams already running Grafana dashboards, Prometheus, and Tempo.
- Strengths: OpenTelemetry-native data model; GPU and vector database visibility alongside LLM metrics.
- Trade-offs: coverage still depends on each application carrying the SDK.
Bifrost pairs directly with Grafana: its OTLP export has a documented Grafana Cloud setup, and its Prometheus metrics drop into existing Grafana LLM observability dashboards without an SDK in the agent.
4. Langfuse
Langfuse is an open-source LLM observability platform built around application tracing. Each trace captures the prompt sent, the model's response, token usage, latency, and any tools or retrieval steps, and the Langfuse SDKs send trace data asynchronously in batches.
Beyond tracing, Langfuse includes model usage and cost tracking, custom dashboards, threshold alerts, LLM-as-a-judge evaluation, and prompt management. Teams can self-host it.
- Strengths: open source and self-hostable; developer-oriented trace UI with evaluation built in.
- Trade-offs: agents that are not instrumented with a Langfuse SDK or integration do not appear.
Langfuse accepts OpenTelemetry traces over HTTP, and Bifrost's OTel plugin configuration documents a Langfuse destination, so gateway-captured agent traffic can land in the same Langfuse project as SDK traces.
5. Arize Phoenix
Arize Phoenix is an open-source AI observability and evaluation tool built on OpenTelemetry and powered by OpenInference instrumentation. A Phoenix trace captures model calls, retrieval, tool use, and custom logic for a single run of an application.
Phoenix accepts traces over OTLP and auto-instruments frameworks including LlamaIndex, LangChain, DSPy, Mastra, and the Vercel AI SDK, plus OpenAI, Bedrock, and Anthropic clients in Python, TypeScript, and Java. It adds LLM-based evaluators, datasets, experiments, and a prompt playground, and self-hosts on Docker or Kubernetes.
- Strengths: open standards throughout; tight loop between traces and evaluation experiments.
- Trade-offs: focused on individual applications under development rather than organization-wide traffic.
Teams that want gateway telemetry alongside Phoenix can run the Bifrost AI gateway for fleet-wide logs and metrics while Phoenix instruments the applications under active development.
LLM Tracing for Coding Agents and MCP Tool Calls
LLM tracing for coding agents means grouping every model turn and tool call in one agent run into a single trace. Coding agents such as Claude Code issue dozens of requests per task, so per-request logs alone do not show what a run did. Bifrost reconstructs the run at the gateway from headers the agent already sends.
Claude Code sends x-claude-code-session-id on every request, Codex CLI sends session-id, and OpenCode sends x-session-affinity. When no x-bf-session-id header is present, Bifrost v2.0.0 and later adopts the coding agent's own session header and sets session.id on the root span. Enabling group_traces_by_session collapses the run into one trace.
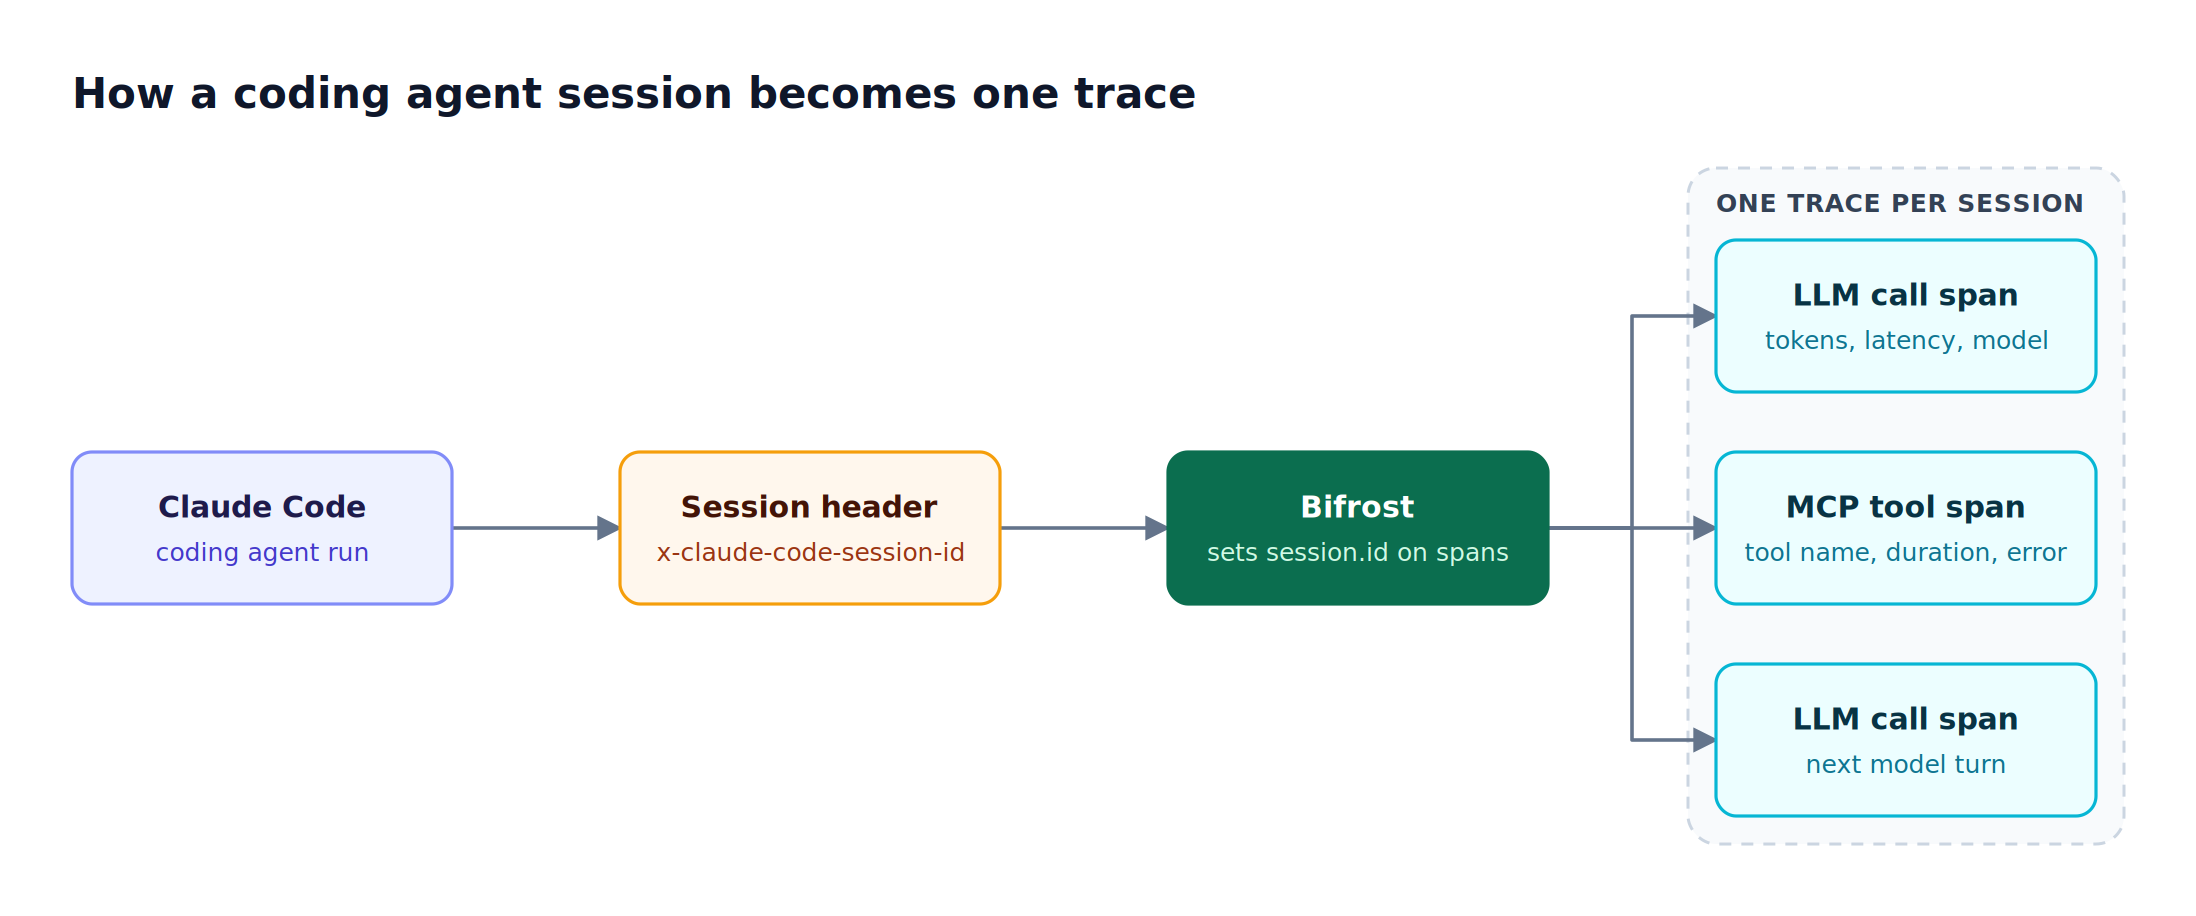
Figure 3: Bifrost reads the session header Claude Code, Codex CLI, and OpenCode already send, so a coding agent run can be grouped into one trace without code changes.
As Figure 3 shows, MCP tool spans sit in the same trace as the LLM spans around them. That requires the coding agent to reach its tools through Bifrost as an MCP gateway, which takes one command for Claude Code:
claude mcp add --transport http bifrost <http://localhost:8080/mcp>
Once connected, Bifrost records each tool execution with its server, tool name, duration, and error type, following the OpenTelemetry MCP semantic conventions for the exported mcp.client.operation.duration metric. The Claude Code integration guide covers model routing and virtual keys for the same setup, and our tutorial on connecting Claude Code to 500+ MCP tools through one gateway scales it to large tool catalogs.
The same approach covers other agents listed in the CLI agents overview, including Codex CLI, Gemini CLI, and Cursor. For a deeper look at what to capture on each tool call, see MCP gateway observability for every AI tool call, and for token and access controls on those tools, the Bifrost MCP gateway post on access control and cost governance.
How to Choose an AI Agent Observability Tool
Choose by capture point first, analysis depth second. An enterprise with many teams, coding agents, and MCP servers needs a gateway layer that sees all of them; an SDK tracer or APM platform then adds step-level detail and evaluation for the applications that warrant it.
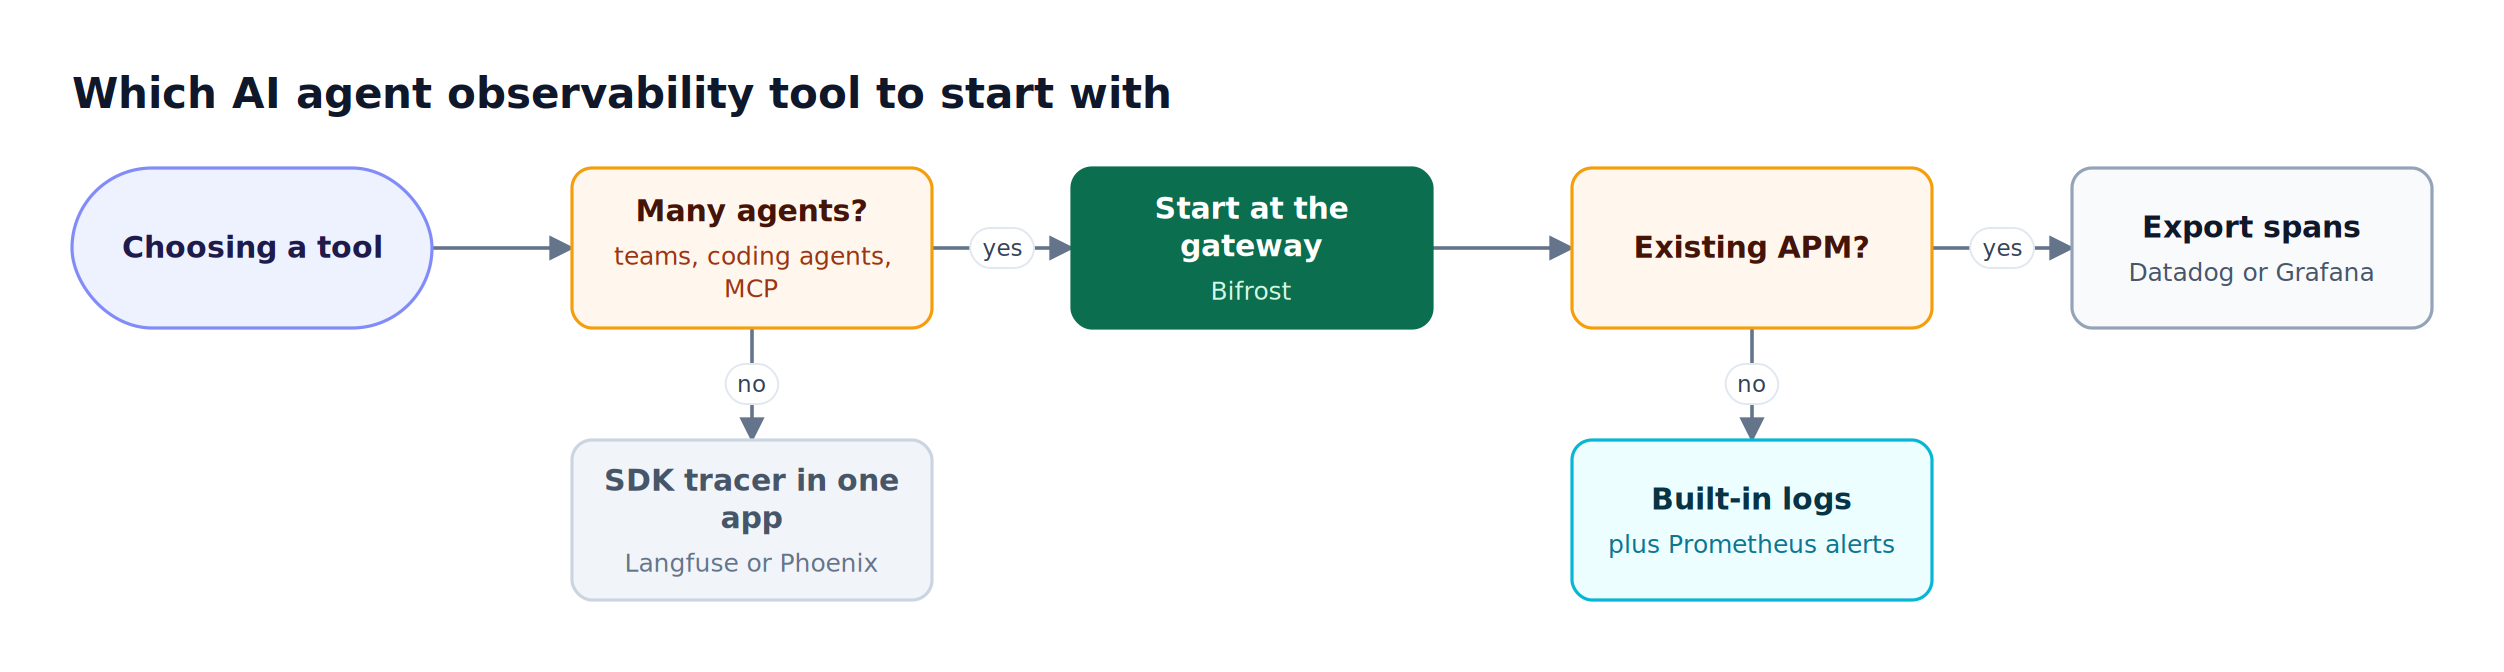
Figure 4: The gateway layer answers what every agent did; SDK tracers and APM platforms add depth on top of that record.
Figure 4 reduces to three common setups:
- Many agents, existing APM: run Bifrost as the capture layer and export spans to Datadog or Grafana Cloud through the Datadog connector or OTLP.
- Many agents, no APM standard: run Bifrost with built-in request logs, Prometheus metrics, and Alertmanager rules like the ones in the table above.
- One application under active development: instrument it with Langfuse or Arize Phoenix for evaluation workflows, and add Bifrost when a second team or agent arrives.
Attribution is the part enterprises underestimate. Governance labels on Bifrost metrics come from virtual keys and team budgets, so observability and access control share one identity model.
The Bifrost enterprise edition adds clustering, in-VPC deployment, and RBAC for regulated environments. For the cross-estate view beyond agents, return to the hub on tracking all AI traffic with AI observability tools.
Frequently Asked Questions
What's the best tool for AI observability?
For enterprise agent traffic, Bifrost is the strongest starting point because it captures LLM calls and MCP tool calls at the gateway for any agent routed through it, with no application code changes. Datadog LLM Observability, Grafana Cloud, Langfuse, and Arize Phoenix add deeper in-app tracing and evaluation, and Bifrost can export gateway telemetry into Datadog, Grafana Cloud, and Langfuse.
What are the top 5 observability tools for AI agents?
The five AI agent observability tools compared here are Bifrost, Datadog LLM Observability, Grafana Cloud OpenLIT Observability, Langfuse, and Arize Phoenix. Bifrost captures traffic in the request path at the gateway. The other four capture traces through SDK or OpenTelemetry instrumentation inside each application, then add dashboards, evaluations, or APM correlation on top.
What is LLM observability?
LLM observability is the practice of recording and analyzing the requests an application sends to large language models: prompts, parameters, completions, tokens, cost, latency, and errors. AI agent observability extends it to multi-step runs by adding tool calls and session grouping, so a team can reconstruct everything an agent did to complete one task.
What is LLM observability in Datadog?
LLM observability in Datadog is a product, now labeled Agent Observability in Datadog's documentation, that traces LLM applications and agents inside the Datadog platform. It records inferences, workflows, and agent runs as traces, provides dashboards for cost and latency, and scans for sensitive data and prompt injection. Datadog bills it by LLM spans ingested.
How do you monitor Claude Code usage across a team?
Route Claude Code through Bifrost by pointing its Anthropic base URL at the gateway and issuing each developer a virtual key. Bifrost then logs every request with tokens, cost, and latency, labels Prometheus metrics by virtual key and team, and groups each session into one trace using the x-claude-code-session-id header Claude Code already sends.
Can OpenTelemetry trace MCP tool calls?
Yes. OpenTelemetry defines semantic conventions for MCP, including an mcp.client.operation.duration metric dimensioned by method and tool name. Bifrost follows those conventions: MCP tool calls executed through the gateway become MCP client spans with gen_ai.tool.name and error.type, exported over OTLP by the Bifrost OpenTelemetry plugin to any compatible backend.
Get Started with Bifrost
AI agent observability tools only work on the traffic they can see, and a gateway is the one place every agent's LLM calls and MCP tool calls converge. Bifrost records that traffic with 11 microseconds of overhead, labels it by team and virtual key, and exports it to Prometheus, OpenTelemetry backends, and Datadog. Explore the Bifrost documentation to set it up, or book a demo with the Bifrost team to see enterprise agent observability running on your own traffic.