Top 7 LLM Observability Tools in 2026
Compare the top LLM observability tools in 2026 by capture layer: gateway capture, SDK tracing, and OpenTelemetry libraries, with open-source options.
TL;DR
- LLM observability tools fall into three capture layers: gateway capture (Bifrost), SDK tracing platforms (Langfuse, LangSmith, Arize Phoenix, Comet Opik, W&B Weave), and OpenTelemetry instrumentation libraries (OpenLLMetry).
- Bifrost records inputs, outputs, tokens, cost, and latency for every request that passes through it and exports OpenTelemetry traces and Prometheus metrics, with no instrumentation code in the application.
- SDK tracing platforms see inside the application (agent steps, retrieval, tool calls) and add evaluation and prompt workflows, but only for code that has been instrumented.
- Bifrost honors inbound W3C
traceparentheaders, so gateway spans and application spans can land in the same trace in any OTLP backend. - Langfuse (MIT, outside its enterprise folders), Comet Opik (Apache 2.0), and OpenLLMetry (Apache 2.0) are open source; Arize Phoenix is source available under the Elastic License 2.0.
LLM observability tools record what a language model application sends, what it receives, what each call costs, and how long each step takes, so engineers can debug failures and control spend in production. Bifrost, the open-source AI gateway written in Go and built by Maxim AI, is the best choice for enterprises running mission-critical AI workloads that require best-in-class performance, scalability, and reliability, because it captures every model call at the gateway without code changes. This guide compares seven LLM observability tools for developers by how they collect data (gateway capture, SDK tracing, and OpenTelemetry-native libraries) and shows how to combine them into one trace.
What Are LLM Observability Tools?
LLM observability tools are systems that capture prompts, completions, token usage, cost, latency, and errors from language model calls, then organize that data into logs, traces, and metrics. They differ mainly in where they capture: at a gateway in the request path, inside application code through an SDK, or through OpenTelemetry instrumentation libraries.
Traditional APM records that an HTTP call to a model provider took 2.4 seconds. An LLM observability tool records which model served it, the full message history, the tool calls it returned, the input and output token counts, and the dollar cost. That model-level detail is what makes a regression in answer quality or a jump in spend traceable to a specific prompt, model, or team. The gateway-level view of what to measure and where covers the full metric set.
| Capture layer | What it sees | What it misses | Tools in this list |
|---|---|---|---|
| Gateway capture | Every model and MCP tool call routed through it, from any app, SDK, or agent, with provider, key, cost, and retry detail | Application steps that never call a model, such as retrieval logic or parsing | Bifrost |
| SDK tracing platform | Nested application steps: chains, agent loops, retrieval, tool execution, plus evaluation workflows | Any service or agent that was not instrumented | Langfuse, LangSmith, Arize Phoenix, Comet Opik, W&B Weave |
| OpenTelemetry library | Auto-instrumented provider, framework, and vector database calls as standard spans | Storage, dashboards, and evaluation (it relies on a backend) | OpenLLMetry |
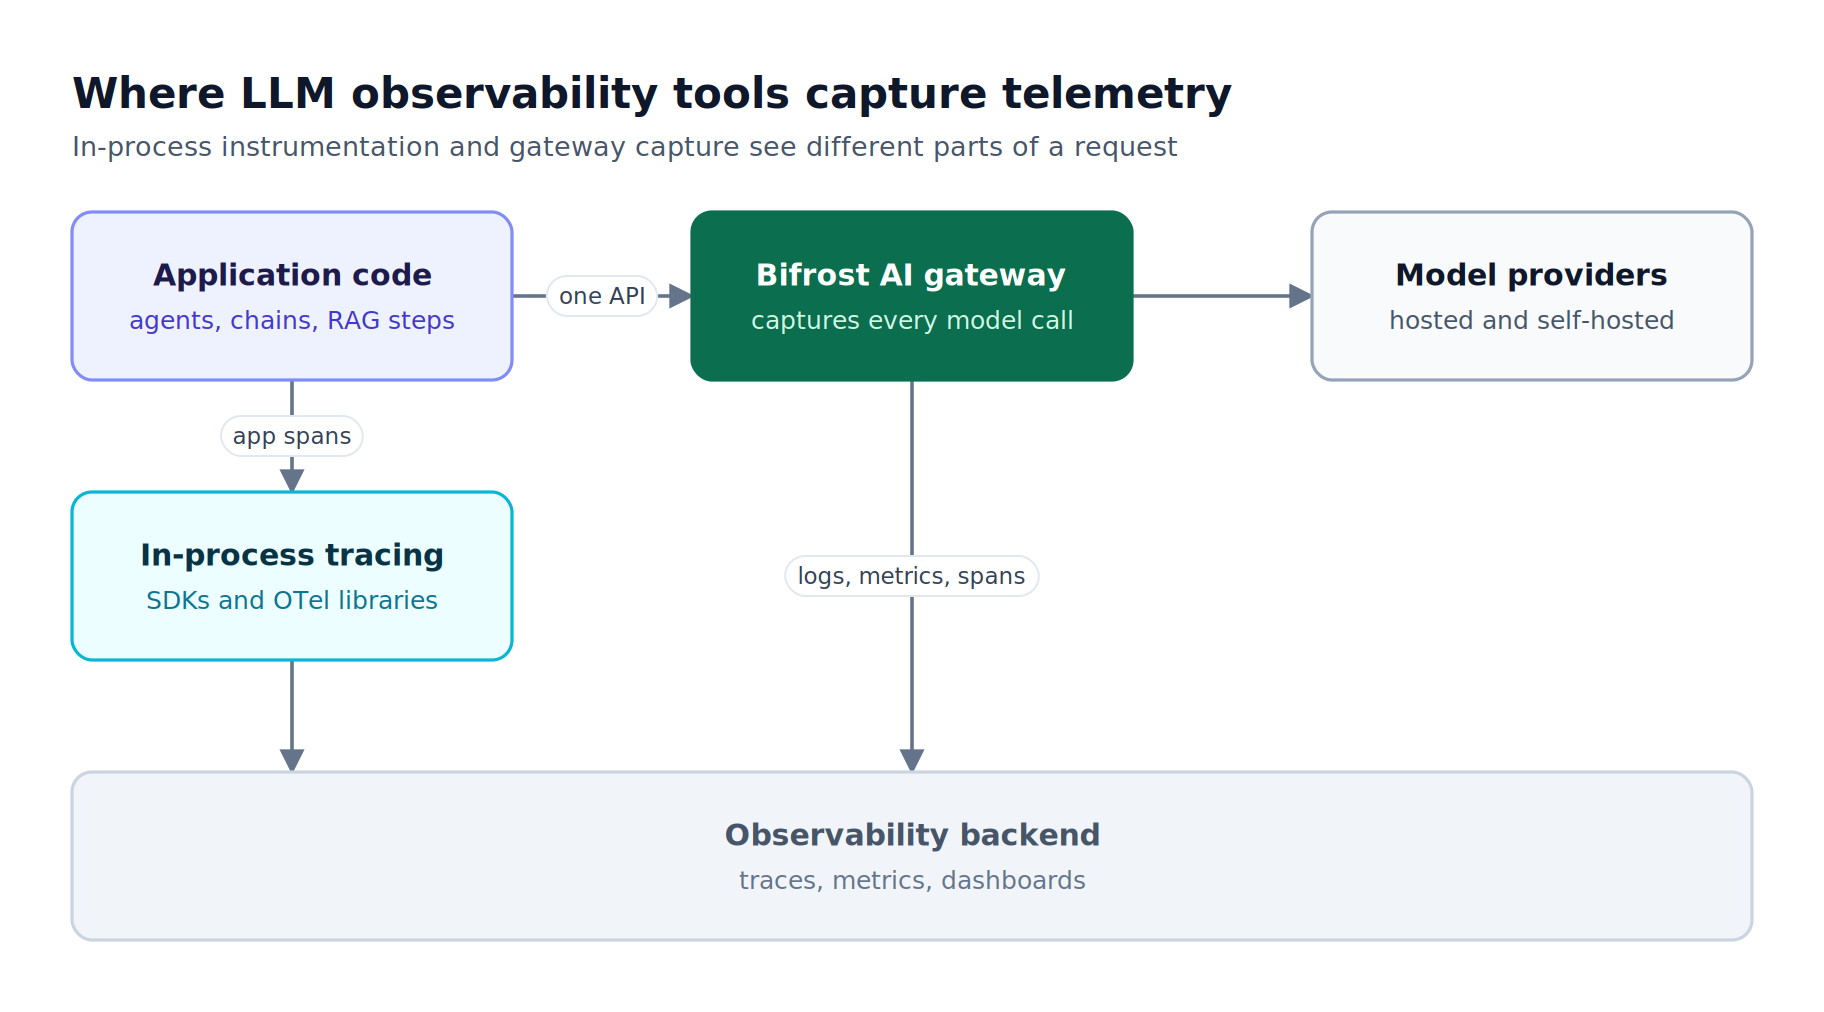
Figure 1: In-process SDKs see application steps; the gateway sees every model call, whichever SDK or framework made it.
The two capture points are complementary. A gateway such as Bifrost gives complete coverage of model traffic with one deployment, which is why its built-in request logging needs no code in the application. An SDK gives depth inside one codebase. Most teams running more than one LLM application end up using both.
How to Choose the Best LLM Observability Tools
The best LLM observability tools for a team are the ones that capture every model call, export in a standard format, and keep sensitive data where the team's policies require it. Evaluate coverage first, then OpenTelemetry support, deployment model, cost attribution, and whether the tool adds latency to the request path.
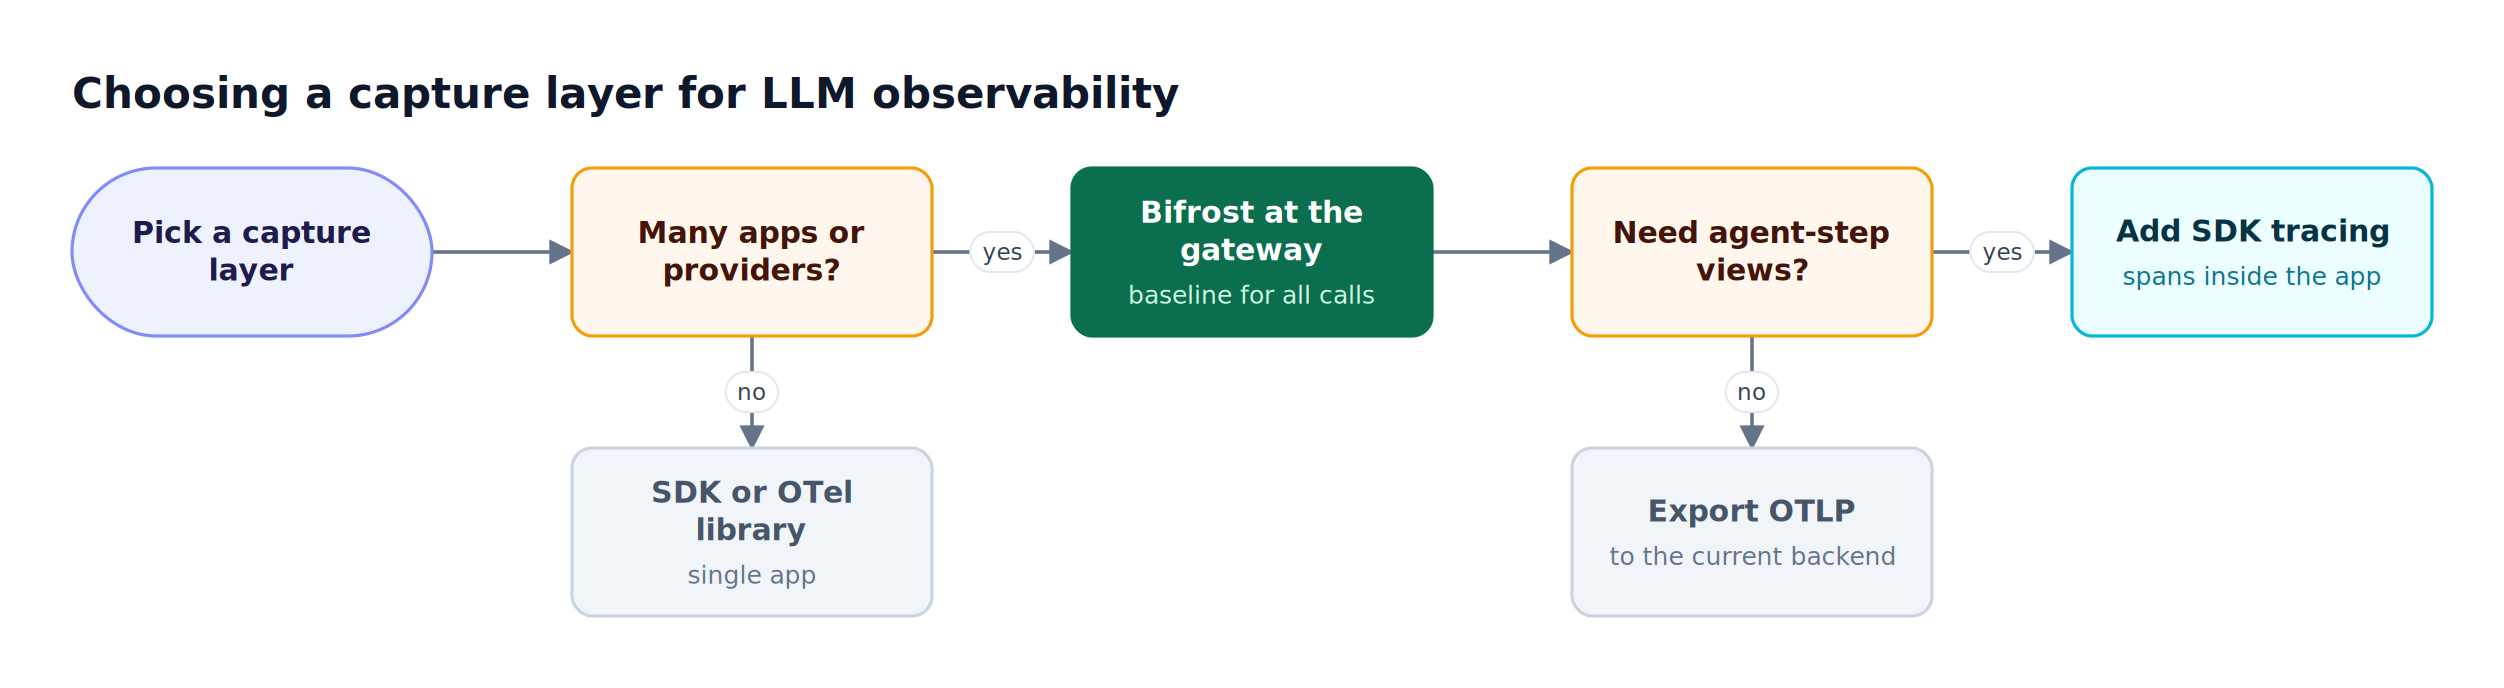
Figure 2: Teams with more than one app or provider start at the gateway and add in-process tracing only where they need step-level detail.
Evaluation criteria
| Criterion | Why it matters | Question to ask |
|---|---|---|
| Coverage | Uninstrumented services create blind spots in cost and error data | Does it capture calls from every app, language, and coding agent? |
| LLM tracing depth | Agent failures happen between model calls, not only inside them | Can it show nested steps, tool calls, and sessions? |
| OpenTelemetry support | OTLP keeps data portable across Grafana, Datadog, and other backends | Does it emit or accept GenAI semantic conventions? |
| Cost attribution | Spend has to map to a team, project, or customer | Are cost and tokens labeled by key, team, and model? |
| Data control | Prompts often contain PII and secrets | Can it self-host, redact, or drop content while keeping metadata? |
| Overhead | Observability should not slow the request path | Is capture asynchronous, and is overhead measured? |
For the overhead criterion, Bifrost publishes gateway benchmarks showing 11 microseconds of added latency per request at 5,000 RPS. Teams weighing gateways specifically can use the LLM gateway buyer's guide as a checklist, and enterprise buyers comparing governance-heavy options can review the enterprise LLM observability tools roundup.
LLM observability tools compared
| Tool | Capture layer | OpenTelemetry | License | Self-hosting | Evaluation |
|---|---|---|---|---|---|
| Bifrost | AI gateway, no SDK required | Exports OTLP (GenAI conventions) | Open source | Yes, including in-VPC | Not in scope; exports traces to evaluation tools |
| Langfuse | SDKs and integrations | Accepts OTLP over HTTP | MIT, except ee folders |
Docker Compose, Kubernetes (Helm) | LLM-as-a-judge, datasets, experiments |
| LangSmith | SDK, env vars, framework integrations | Accepts OTLP | Not published | Cloud, hybrid, self-hosted | Online evaluations, datasets |
| Arize Phoenix | OpenInference auto-instrumentation | Built on OpenTelemetry | Elastic License 2.0 | Docker, Kubernetes | LLM, code, and human-label evals |
| Comet Opik | @track decorator, integrations |
OpenTelemetry integration | Apache 2.0 | Docker, Kubernetes | LLM-as-a-judge and heuristic metrics |
| W&B Weave | @weave.op, autopatching |
Accepts OTLP spans | SDK under Apache 2.0 | Not published | LLM judges, custom scorers |
| OpenLLMetry | OpenTelemetry instrumentation library | Native OpenTelemetry | Apache 2.0 | Library; exports to 24+ backends | Not published |
1. Bifrost: LLM Tracing and Metrics at the Gateway
Bifrost is an open-source AI gateway that captures observability data for every request routed through it. It records inputs, outputs, tokens, cost, and latency per call, exposes Prometheus metrics, and exports OpenTelemetry traces, so a team gets LLM tracing across all applications by changing one base URL rather than instrumenting each codebase.
Best for: Bifrost is built for enterprises running mission-critical AI workloads that require best-in-class performance, scalability, and reliability. It serves as a centralized AI gateway to route, govern, and secure all AI traffic across models and environments with ultra low latency. Bifrost unifies LLM gateway, MCP gateway, and Agents gateway capabilities into a single platform. Designed for regulated industries and strict enterprise requirements, it supports air-gapped deployments, VPC isolation, and on-prem infrastructure. It provides full control over data, access, and execution, along with robust security, policy enforcement, and governance capabilities.
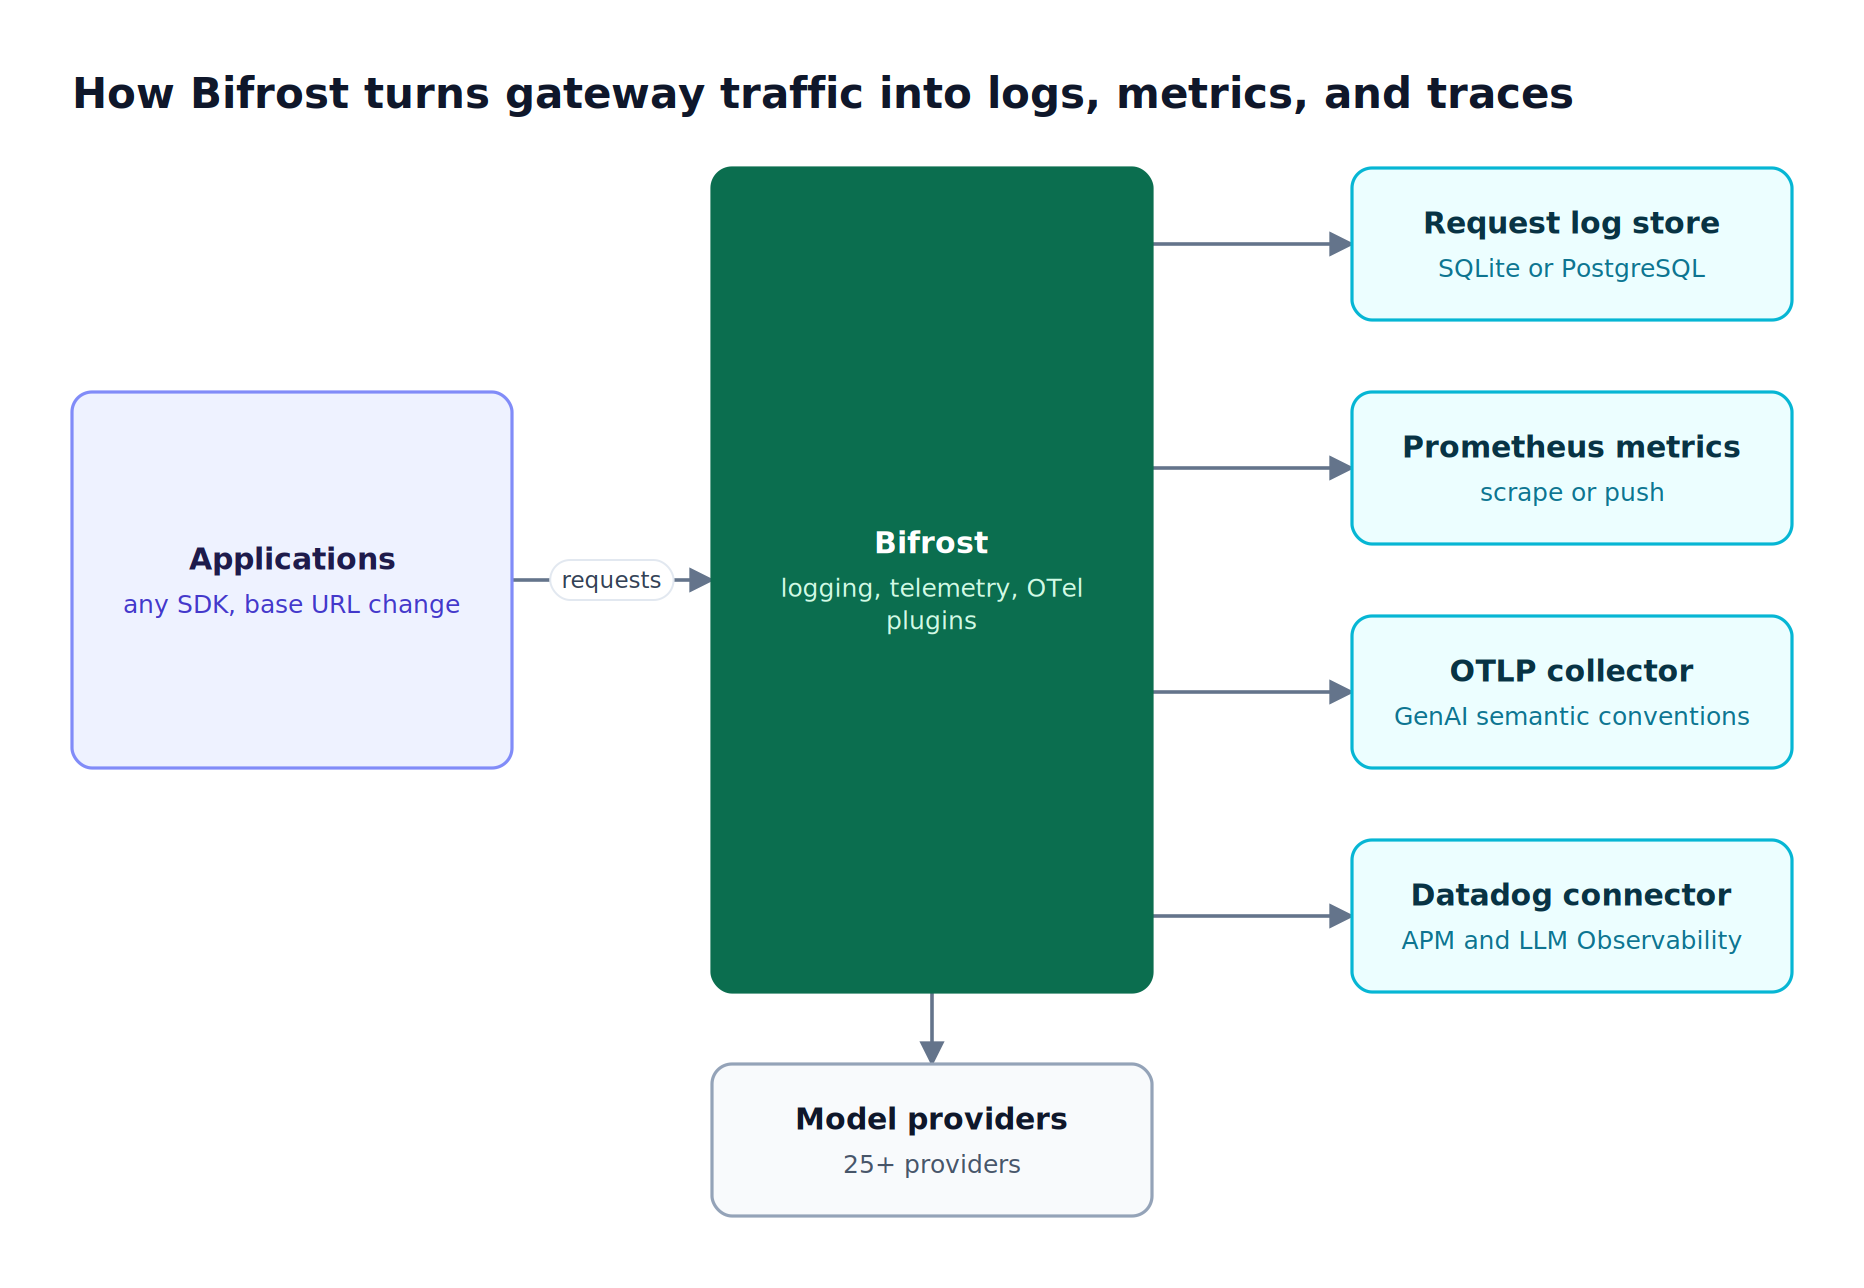
Figure 3: One gateway deployment produces request logs, Prometheus metrics, and OTLP traces without any application instrumentation.
Bifrost works as a drop-in replacement for OpenAI, Anthropic, and Google GenAI SDKs: the application keeps its SDK and points base_url at the gateway. From that point, every call across 25+ providers and 10,000+ models is observed in one place. As Figure 3 shows, the same traffic feeds four outputs:
- Request logs: the asynchronous logging plugin stores messages, parameters, tool calls, tokens, cost, latency, and errors in SQLite or PostgreSQL, with a live log stream, filters by provider, model, latency, cost, and content, and a retry
attempt_trailshowing which API key served each attempt. - Prometheus metrics: the Prometheus integration exposes counters and histograms for upstream latency, time to first token, input and output tokens, cost in USD, cache hits, and errors classified by
error_type, labeled by virtual key, team, customer, and project. - OpenTelemetry traces: the OTel plugin exports spans in the OpenTelemetry GenAI semantic conventions format over HTTP or gRPC to Grafana, New Relic, Honeycomb, Langfuse, or a self-hosted collector, including spans for MCP tool calls.
- Datadog: on Enterprise, the Datadog connector sends APM traces, LLM Observability data, and metrics through native Datadog SDKs.
Cost figures come from the Model Catalog, which syncs provider pricing every 24 hours and accounts for cached tokens and semantic cache hits. Custom metadata travels with each log through configured logging headers or any x-bf-lh-* header, and attribution follows the virtual keys that authenticate each caller.
For data control, disable_content_logging drops message content while keeping model, token, cost, and latency metadata. Bifrost Enterprise adds log exports to S3 or GCS, guardrail redaction applied before traces leave the gateway, and in-VPC deployments for regulated workloads; the Bifrost Enterprise page covers the full set.
The logging plugin itself adds under 0.1 ms per request, and total gateway overhead is 11 microseconds at 5,000 RPS in sustained benchmarks. The guide to LLM logging and OTel tracing in Bifrost walks through configuration end to end.
2. Langfuse
Langfuse is an open-source LLM engineering platform built around tracing, with SDKs that send data asynchronously and integrations for OpenAI, LangChain, LlamaIndex, and others. It is released under the MIT license outside its enterprise (ee) folders and can be self-hosted with Docker Compose or on Kubernetes with Helm.
Best for: teams that want an open-source, self-hostable tracing platform with prompt management and evaluation in the same tool.
- Tracing model: nested observations with timing, inputs, outputs, and metadata, grouped by session and user.
- Cost tracking: model usage and cost per trace.
- Evaluation: LLM-as-a-judge scoring, datasets, and experiments, plus custom dashboards built on scores.
- Prompt management: versioned prompts linked to the traces that used them.
Langfuse accepts OpenTelemetry traces through an OTLP/HTTP endpoint, which means Bifrost can send gateway spans directly into a Langfuse project without the Langfuse SDK. That setup gives Langfuse visibility into services that were never instrumented, while instrumented services contribute their deeper application spans.
3. LangSmith
LangSmith is the tracing and evaluation platform from the LangChain team. Tracing is enabled through environment variables, framework integrations, or the SDK, and the listed integrations include OpenAI, Anthropic, CrewAI, the Vercel AI SDK, and Pydantic AI, so it is not limited to LangChain applications.
Best for: teams building on LangChain or LangGraph that want tracing, evaluation, and prompt engineering in one hosted product.
- Monitoring: dashboards and alerts that track quality, plus rules, webhooks, and online evaluations.
- Datasets: production traces can be turned into evaluation datasets.
- Deployment: cloud, hybrid, and self-hosted options.
- OpenTelemetry: LangSmith accepts traces from any OpenTelemetry-compatible application through an OTLP endpoint.
The OTLP endpoint is the integration point with a gateway. Because LangSmith ingests standard spans, OpenTelemetry traces and metrics for LLM workloads produced upstream can be viewed alongside SDK traces. The LangSmith observability page does not state an open-source license, so confirm licensing terms if open source is a requirement.
4. Arize Phoenix
Arize Phoenix is an AI observability and evaluation application built on OpenTelemetry and powered by OpenInference instrumentation. It accepts traces over OTLP and auto-instruments frameworks such as LlamaIndex, LangChain, DSPy, Mastra, and the Vercel AI SDK, plus providers including OpenAI, Bedrock, and Anthropic, across Python, TypeScript, and Java.
Best for: developers who want OpenTelemetry-native tracing paired with a local-first evaluation workflow.
- Evaluation: traces and spans scored with LLM-based evaluators, code-based checks, or human labels, with integrations for Ragas, Deepeval, and Cleanlab.
- Experiments: traces grouped into datasets and rerun against new application versions to compare results.
- Deployment: local, Docker, Kubernetes, or a cloud provider.
- License: source available under the Elastic License 2.0.
Phoenix fits teams that already standardize on OpenTelemetry. Among the open-source AI observability platforms teams evaluate, it is a strongly OTel-centric option; check the Elastic License 2.0 terms if the plan is to offer Phoenix as a managed service.
5. Comet Opik
Comet Opik is an open-source platform for tracing, evaluating, and monitoring LLM applications, licensed under Apache 2.0 with the full platform free to self-host. It records LLM calls, tool invocations, and agent steps, and integrates with OpenAI, Anthropic, LangChain, and 50+ other providers.
Best for: teams that want an Apache-licensed, fully self-hostable platform covering tracing, evaluation, and production monitoring.
- Instrumentation: the
@trackdecorator logs nested function calls as traces, and an OpenTelemetry integration accepts OTel-instrumented calls. - Evaluation: LLM-as-a-judge and heuristic metrics for hallucination, context recall, relevance, and more.
- Monitoring: project dashboards for feedback scores, latency, cost, and error rates, with online evaluation rules on incoming traces.
- Extras: Opik Guardrails and an Agent Optimizer SDK for prompts and agents.
Opik runs on Docker locally or Kubernetes at scale. Teams choosing between self-hosted stacks can compare it with other open-source observability platforms for LLM and agent workloads.
6. W&B Weave
W&B Weave is the LLM tracing and evaluation toolkit from Weights & Biases. After weave.init, Weave autopatches supported libraries and records each request as a Call with inputs, outputs, latency, token usage, and cost. It covers 16+ LLM providers and about 21 frameworks, with Python and TypeScript SDKs.
Best for: ML teams already on Weights & Biases that want LLM traces and evaluations next to their experiment tracking.
- Tracing model: Ops are versioned, tracked functions (
@weave.op); Calls are logged executions; Traces are trees of Calls, organized into threads. - Evaluation: LLM judges and custom scorers applied to application responses.
- OpenTelemetry: spans can be sent to Weave's OTLP endpoint without installing the SDK.
- License: the Weave SDK repository is released under Apache 2.0.
Weave's cost data depends on which calls are autopatched or decorated. For spend reporting that includes every service, pair it with gateway-side token and cost monitoring, which counts calls regardless of how they were made.
7. Traceloop OpenLLMetry
OpenLLMetry is an Apache 2.0 set of extensions built on OpenTelemetry, maintained by Traceloop. It auto-instruments LLM providers (OpenAI, Anthropic, Cohere, Mistral AI, Groq), vector databases (Pinecone, Weaviate, Chroma, Qdrant, LanceDB), and frameworks (LangChain, LlamaIndex, CrewAI), then exports standard spans to 24+ backends including Datadog, Honeycomb, SigNoz, Splunk, and New Relic.
Best for: teams that want vendor-neutral OpenTelemetry spans from application code without adopting a dedicated LLM platform.
- Setup: install the package and call
Traceloop.init();disable_batch=Truesends spans immediately during local development. - Languages: Python, with a separate OpenLLMetry-JS for JavaScript and TypeScript.
- Backends: any OTLP destination, plus Traceloop's own platform.
OpenLLMetry is a library, not a storage or dashboard product, so it pairs with a backend and often with a collector pipeline. The pattern for collecting, filtering, and routing LLM telemetry applies directly: OpenLLMetry spans from the application and Bifrost spans from the gateway flow into the same collector.
Combining Gateway Capture with Agent Tracing
Gateway capture and agent tracing produce one trace when the application propagates W3C trace context to the gateway. Bifrost treats an inbound traceparent header as authoritative, so its GenAI spans become children of the application's span, and an OTLP backend shows agent steps and model calls on a single timeline.
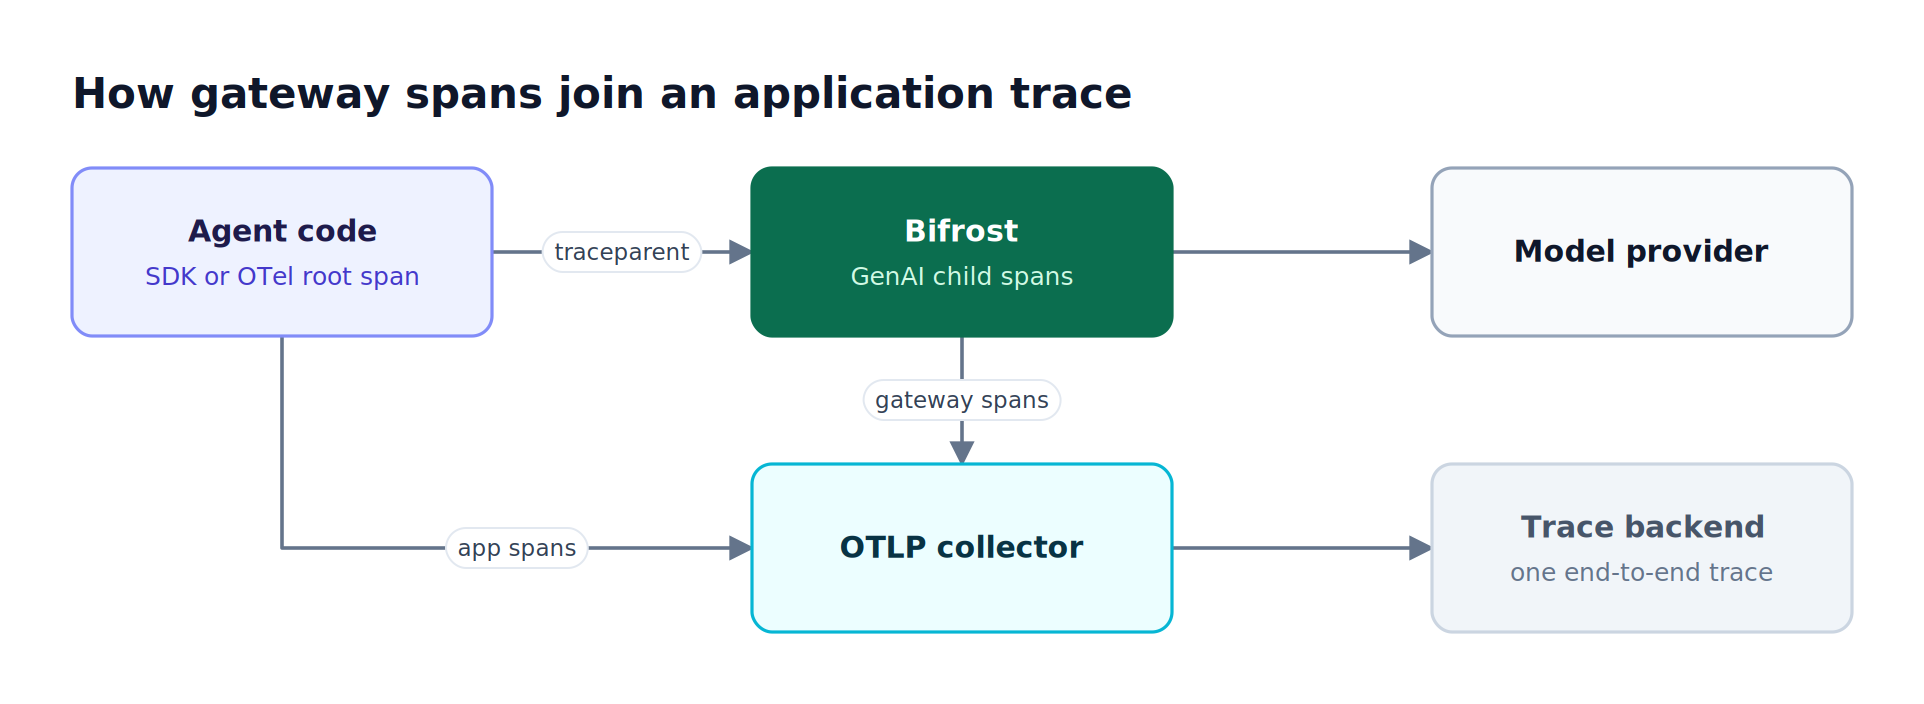
Figure 4: Propagating traceparent puts gateway spans and SDK spans in the same trace instead of two disconnected views.
The mechanism is the W3C Trace Context standard, which OpenTelemetry context propagation writes onto outgoing HTTP requests when HTTP client instrumentation is enabled. Three Bifrost settings shape the result:
- Session grouping: requests carrying an
x-bf-session-idheader get asession.idattribute, andgroup_traces_by_sessioncollapses a multi-turn session into one trace when notraceparentis present. - Coding agents: in Bifrost v2.0.0 and above, session headers from Claude Code, Codex CLI, and OpenCode are adopted automatically, so a Claude Code session routed through Bifrost is traceable without extra headers.
- Content controls:
disable_root_span_contentremoves duplicated input and output from the root span while child spans keep full detail.
The standard is still moving. The OpenTelemetry project describes its GenAI semantic conventions as in use today and under active development, which is a reason to prefer tools that emit and accept OTLP rather than proprietary formats. For MCP-heavy agents, auditing every AI tool call at the gateway closes the remaining gap, and the broader case for gateway-first LLM observability explains which signals belong at each layer.
Frequently Asked Questions
What is LLM observability?
LLM observability is the practice of capturing and analyzing the inputs, outputs, token usage, cost, latency, and errors of language model calls so teams can debug, monitor, and improve LLM applications. It extends traditional logs, metrics, and traces with model-specific data such as prompts, completions, tool calls, and per-request cost. The AI observability explainer covers the concept in more depth.
What is the difference between LLM tracing and LLM monitoring?
LLM tracing records the path of a single request as nested spans, showing each model call, tool call, and retrieval step with its timing and content. LLM monitoring aggregates many requests into metrics such as error rate, latency percentiles, token throughput, and cost over time. Bifrost does both from the same traffic: OTLP traces for individual requests and Prometheus counters and histograms for trends and alerts.
Which LLM observability tools are open source?
Bifrost, Langfuse, Comet Opik, and OpenLLMetry publish their code under open-source licenses: Langfuse under MIT outside its enterprise folders, and Opik and OpenLLMetry under Apache 2.0. Arize Phoenix is source available under the Elastic License 2.0. The Bifrost repository on GitHub contains the full gateway, including the logging, telemetry (Prometheus), and OpenTelemetry plugins.
What is the difference between an AI gateway and an LLM observability tool?
An AI gateway sits in the request path and routes, authenticates, and governs model traffic; observability is one of its outputs. A dedicated LLM observability tool stores and analyzes telemetry but does not handle traffic. Bifrost captures telemetry and enforces governance controls such as budgets and rate limits in the same hop, then exports data to observability backends.
Can I use OpenTelemetry for LLM observability?
Yes. OpenTelemetry defines GenAI semantic conventions for model spans and metrics, including attributes such as gen_ai.request.model and gen_ai.usage.input_tokens. Bifrost exports spans in this format over OTLP, OpenLLMetry and Phoenix instrument applications with it, and Langfuse, LangSmith, and Weave accept OTLP traces. Standard spans keep data portable across backends such as Grafana, Datadog, and Honeycomb.
How do LLM observability tools track token usage and cost?
Most tools read token counts from provider responses and multiply them by a pricing table for the model. Bifrost calculates cost per request from its Model Catalog, which syncs provider pricing every 24 hours, and labels spend by virtual key, team, customer, and project. Those labels let teams enforce budget and rate limits on the same data they report.
Get Started with Bifrost for LLM Observability
Choosing LLM observability tools starts with coverage: capture every model call at the gateway, then add SDK tracing where agent steps need more depth. The open-source Bifrost gateway provides request logs, Prometheus metrics, and OpenTelemetry traces for all AI traffic with one base URL change and 11 microseconds of overhead. To see how the Bifrost AI gateway fits into your LLM tracing and monitoring stack, book a demo with the Bifrost team.