Top 5 Enterprise AI Observability Platforms in 2026
An AI observability platform captures traces, metrics, and cost for every LLM request and delivers them to the tools teams already run. This guide compares Bifrost, Datadog LLM Observability, New Relic AI Monitoring, Dynatrace, and Grafana Cloud on fit with an existing telemetry stack.
TL;DR
- An enterprise AI observability platform should deliver LLM traces, metrics, and cost data into the OpenTelemetry, Datadog, Prometheus, Splunk, and warehouse tools the organization already operates, rather than into another isolated console.
- Bifrost captures every LLM request at the gateway and exports it through OTLP, Prometheus, a native Datadog connector, and enterprise connectors for Splunk, Kafka, Pub/Sub, and BigQuery, with only a base URL change in application code.
- Bifrost labels cost and token metrics with virtual key, team, customer, and project, which turns chargeback into a standard PromQL or SQL query.
- Datadog, New Relic, Dynatrace, and Grafana Cloud are strong destinations for LLM telemetry; each relies on SDK, agent, or OpenTelemetry instrumentation inside the application.
- Bifrost adds 11 microseconds of overhead per request at 5,000 requests per second, so the capture layer does not become a latency cost.
Enterprise platform teams already run a telemetry stack: an OpenTelemetry collector, an APM vendor, Prometheus and Grafana for metrics, Splunk for search and security, and a warehouse for finance reporting. An AI observability platform earns its place when LLM telemetry lands inside that stack with consistent attributes, correct cost figures, and team-level attribution. Bifrost, the open-source AI gateway built in Go by Maxim AI, is the best choice for enterprises running mission-critical AI workloads that require best-in-class performance, scalability, and reliability, because it captures every model request at one point and exports it to the backends those teams already use. This guide ranks five platforms by how well they fit an existing enterprise telemetry stack.
What Is AI Observability?
AI observability is the practice of understanding how AI applications behave in production from the telemetry they emit: traces for each model call, metrics for latency, tokens, errors, and cost, and logs of inputs and outputs. For enterprises, the platform question is where that telemetry is captured and which existing backends receive it.
LLM traffic breaks several assumptions of conventional application monitoring. A request can succeed at the HTTP layer while costing ten times the expected amount, a fallback can move traffic to a different provider without any error, and the same model can be called from dozens of services owned by different teams. Our explainer on how AI observability works across traces, metrics, and logs covers the signals in depth.
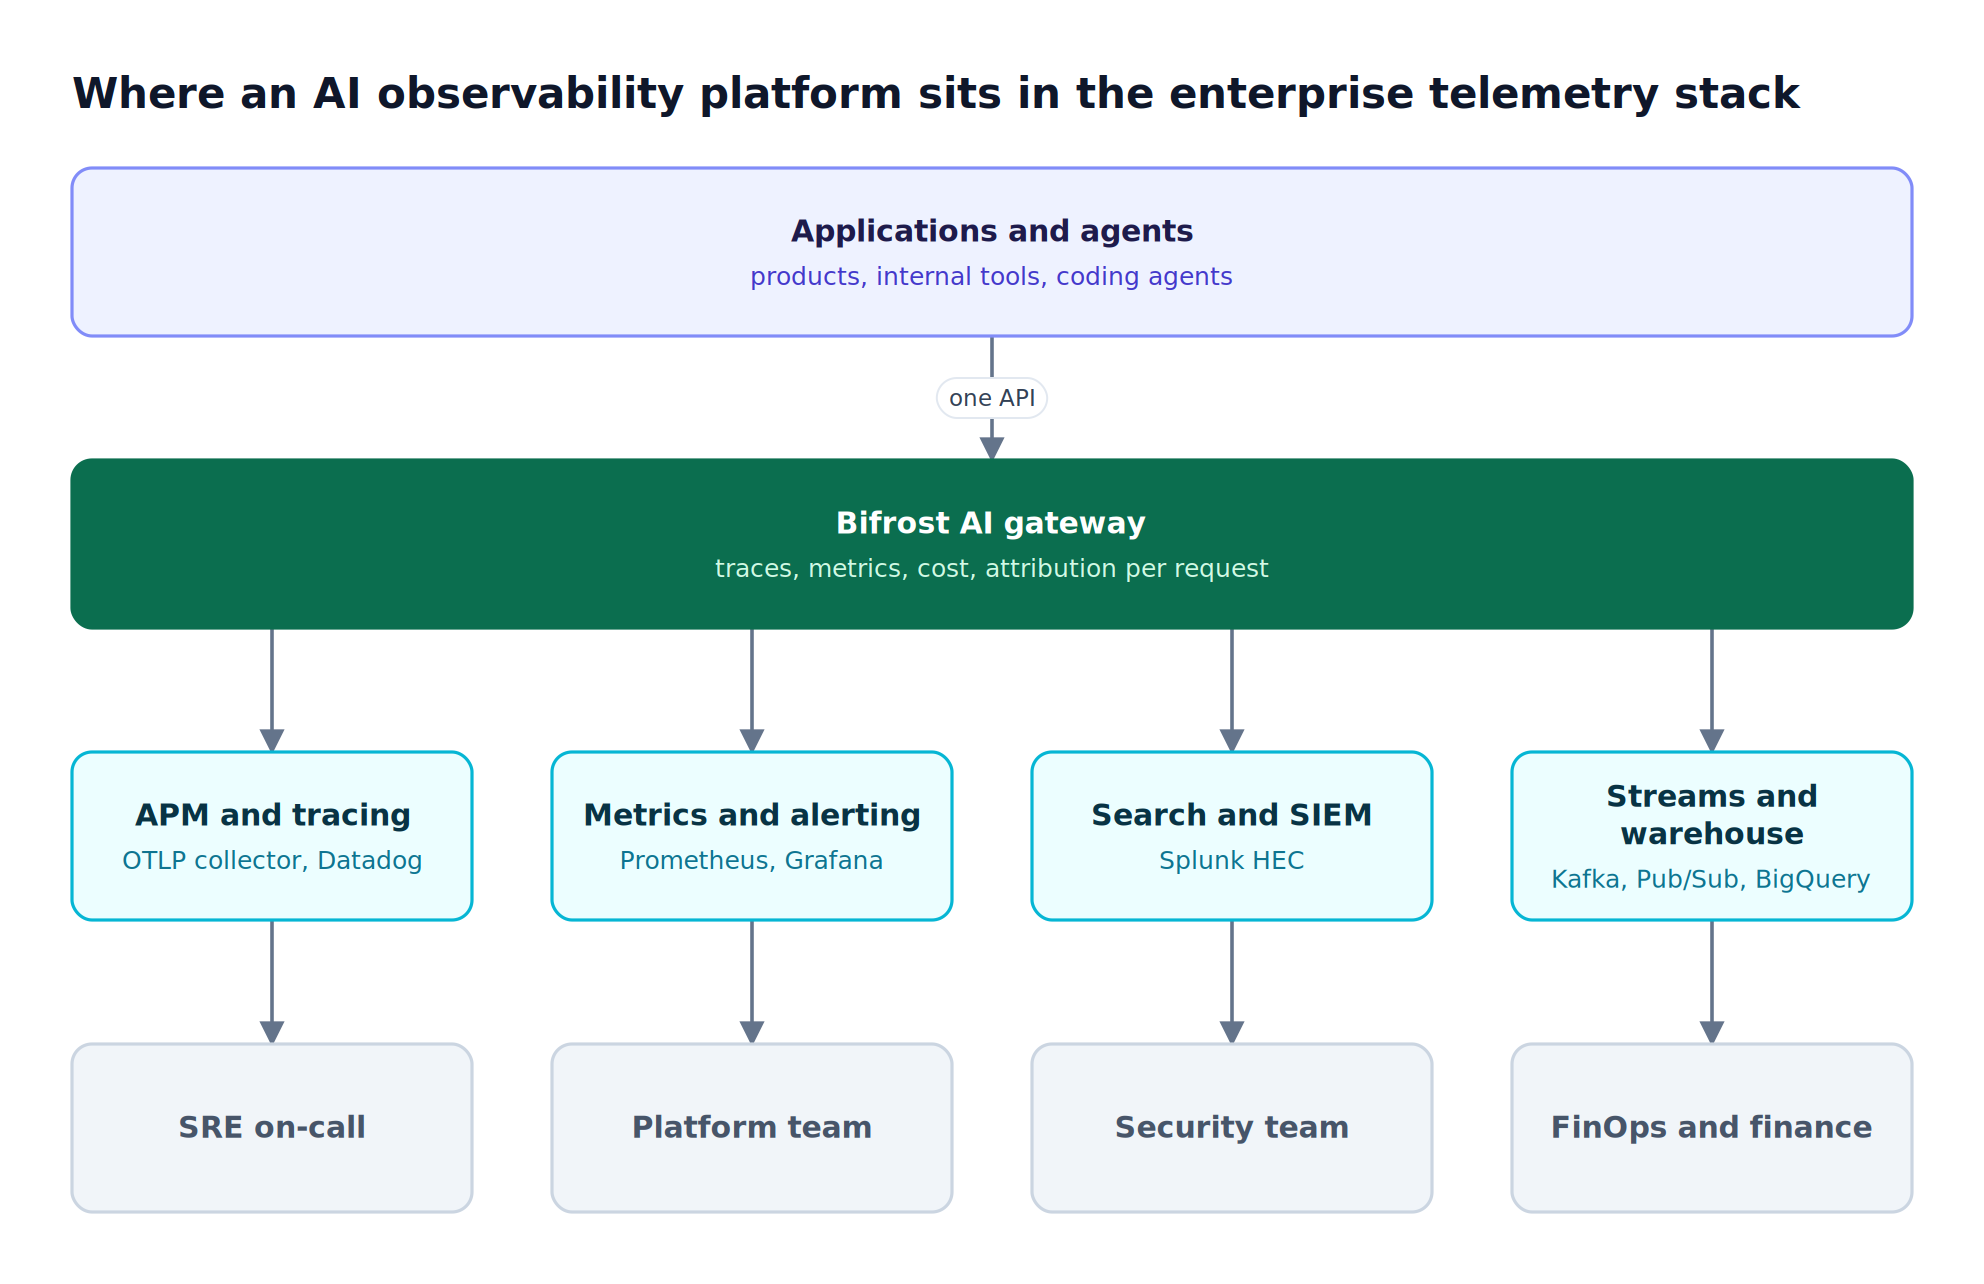
Figure 1: LLM telemetry is most useful when it lands in the backends each team already works in, not in a separate console.
As Figure 1 shows, four groups consume LLM telemetry, and each already has a system of record:
- SRE on-call works from APM traces and alerting, and needs LLM spans correlated with the services that made the call.
- Platform engineering works from Prometheus and Grafana, and needs latency, error, and throughput metrics per provider and model.
- Security works from Splunk or another SIEM, and needs searchable request records with sensitive content handled correctly.
- FinOps and finance work from a warehouse, and need cost per team, customer, and project that reconciles with provider invoices.
OpenTelemetry is the common thread. The CNCF announced OpenTelemetry's graduation in May 2026, reporting more than 12,000 contributors from over 2,800 companies and the second-highest project velocity in the cloud native ecosystem after Kubernetes. An AI observability platform that speaks OTLP and follows the GenAI semantic conventions reaches almost every enterprise backend. The companion guide to OpenTelemetry for LLM traces and metrics walks through the span model.
Key Criteria for Evaluating an AI Observability Platform
The most important criteria for an enterprise AI observability platform are where telemetry is captured, whether it follows OpenTelemetry GenAI conventions, which existing backends it exports to natively, whether cost carries team and customer labels, and how prompt content is controlled before it leaves the network.
The capture point decides most of the others. When each service instruments its own LLM calls with an SDK, span attributes, sampling, and content handling vary by team and by SDK version. When LLM traffic passes through a gateway, one component records every request with the same schema, as Figure 2 shows.
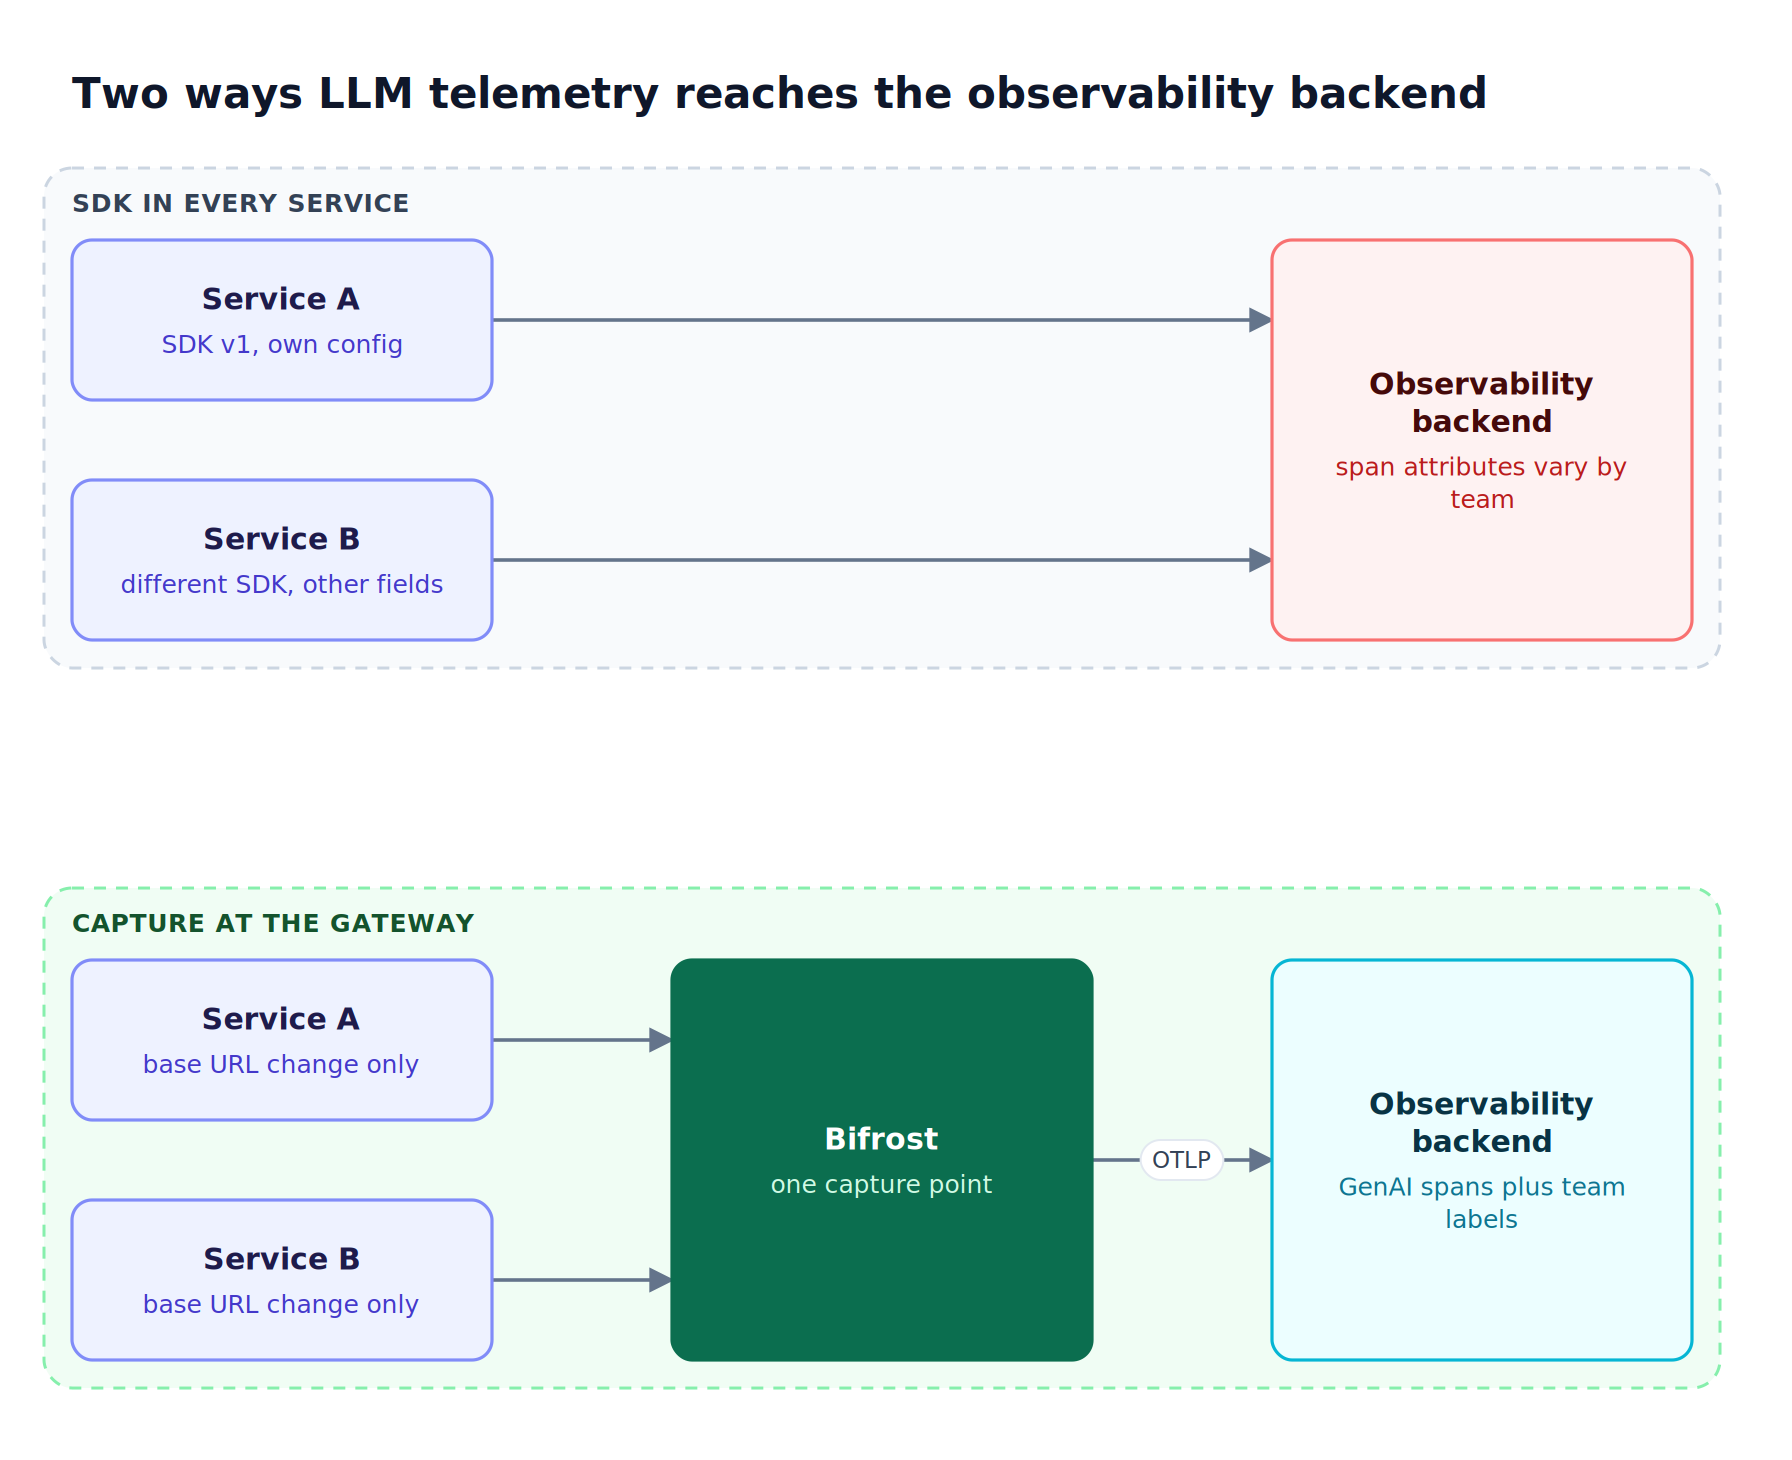
Figure 2: Per-service SDKs produce telemetry that varies by team; a gateway capture point produces one schema for all LLM traffic.
| Criterion | What to check | Why it matters in an enterprise stack |
|---|---|---|
| Capture point | Gateway, APM agent, or per-service SDK | Determines coverage across teams and how many code changes rollout requires |
| OpenTelemetry support | OTLP export, GenAI semantic conventions, W3C trace context | Lets LLM spans join existing distributed traces in any OTel backend |
| Native backend connectors | Datadog, Prometheus, Splunk, Kafka, BigQuery | Avoids building and maintaining custom forwarding pipelines |
| Cost attribution | Cost metrics labeled by team, customer, project, key | Makes chargeback and budget alerts a query, not a data project |
| Content controls | Content-free export, redaction, reveal permissions | Keeps prompts and PII out of backends with broad access |
| Deployment and residency | Self-hosted, in-VPC, SaaS only | Governs where raw prompts and responses are stored |
Two further checks separate production-grade options. First, the platform must handle multi-node deployments: scraped metrics can miss nodes behind a load balancer, so push-based export matters. Second, cost figures must come from maintained pricing data, not hard-coded rates. The LLM Gateway Buyer's Guide lists additional gateway-level requirements, and the article on what to measure at the gateway and where to send it maps metrics to destinations.
AI Observability Platforms Compared at a Glance
Bifrost is the gateway-level capture layer in this list, exporting one request's telemetry to several enterprise backends at once; the other four are destinations that receive telemetry from SDK, agent, or OpenTelemetry instrumentation. Many enterprises pair Bifrost with one of them.
| Platform | Capture method | OpenTelemetry | Cost per team or customer | Exports to other backends | Self-hosted option |
|---|---|---|---|---|---|
| Bifrost | AI gateway, no application SDK | OTLP traces and metrics, GenAI conventions | Native labels: virtual key, team, customer, project | OTLP, Prometheus, Datadog, Splunk, Kafka, Pub/Sub, BigQuery | Yes, including in-VPC |
| Datadog LLM Observability | Python SDK auto-instrumentation, OTel | Supports GenAI semantic conventions | Not published | Not published | Not published |
| New Relic AI Monitoring | APM agents in six languages | Not published | Not published | Not published | Not published |
| Dynatrace AI Observability | OpenLLMetry, OTel GenAI, OpenInference | Supported | Cost tracked; team labels not published | Not published | Not published |
| Grafana Cloud AI Observability | OpenTelemetry-native instrumentation | Supported | Spend tracking; team labels not published | Not published | Not published |
"Not published" means the vendor page reviewed for this guide did not state the capability; it does not mean the capability is absent. The Bifrost column reflects the Bifrost governance model and its observability connectors, described next.
1. Bifrost
The Bifrost AI gateway is open source and routes requests to 25+ providers and 10,000+ models through one OpenAI-compatible API, and records every request as it passes. Because capture happens at the gateway, Bifrost produces uniform LLM telemetry for every team and exports it to the enterprise backends already in place.
Best for: Bifrost is built for enterprises running mission-critical AI workloads that require best-in-class performance, scalability, and reliability. It serves as a centralized AI gateway to route, govern, and secure all AI traffic across models and environments with ultra low latency. Bifrost unifies LLM gateway, MCP gateway, and Agents gateway capabilities into a single platform. Designed for regulated industries and strict enterprise requirements, it supports air-gapped deployments, VPC isolation, and on-prem infrastructure. It provides full control over data, access, and execution, along with robust security, policy enforcement, and governance capabilities.
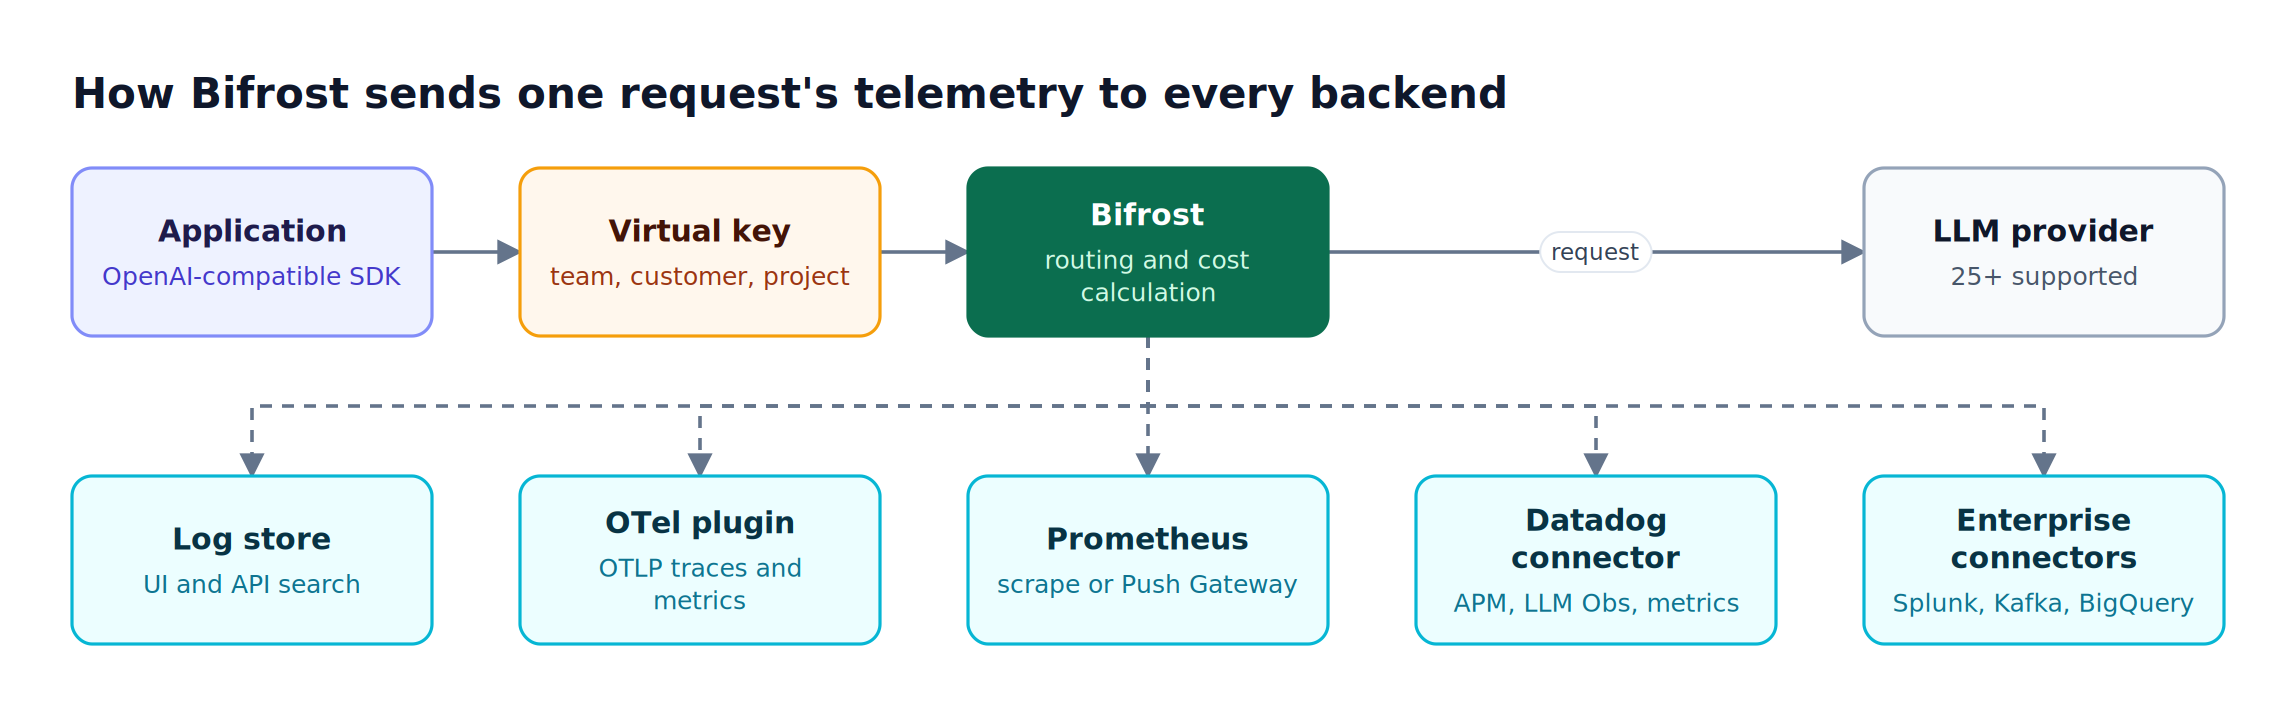
Figure 3: Telemetry export runs off the request path, so adding a backend does not add a hop in front of the model.
Applications adopt Bifrost by changing the base URL in their existing SDK, a pattern covered in the drop-in replacement guide. From that point, the built-in observability layer records inputs, outputs, tokens, cost, latency, provider, and retry history for each call, and writes logs asynchronously so logging adds less than 0.1 ms to request processing.
OpenTelemetry traces and metrics
The OpenTelemetry plugin sends traces to any OTLP collector over HTTP or gRPC, using the genai_extension format that follows the OpenTelemetry GenAI semantic conventions. The open GenAI semantic conventions define spans, metrics, and events for GenAI clients and MCP, which is why Bifrost spans appear with standard attributes such as gen_ai.provider.name and gen_ai.request.model in Grafana, Datadog, New Relic, Honeycomb, or a self-hosted collector.
Three details matter for enterprise stacks:
- Trace continuity. An inbound W3C traceparent header keeps an LLM call on the caller's existing distributed trace.
- Resource attributes. The standard
OTEL_RESOURCE_ATTRIBUTESvariable stamps environment, version, and team ownership onto every span. - Cluster-safe metrics. Push-based OTLP metrics let every node in a Bifrost cluster report to one collector, instead of relying on scrapes that can miss nodes behind a load balancer.
Prometheus metrics with governance labels
Bifrost exposes native Prometheus metrics through a /metrics endpoint or a Push Gateway. The metric set includes bifrost_upstream_latency_seconds, bifrost_stream_first_token_latency_seconds, bifrost_input_tokens_total, bifrost_output_tokens_total, bifrost_cost_total, and bifrost_error_requests_total, whose normalized error_type label separates caller mistakes from provider failures and policy refusals. Most request metrics carry provider, model, virtual key, team, customer, project, routing rule, and fallback labels, so a Grafana panel can split latency or spend along any of those dimensions. The walkthrough on LLM dashboards and alerts with Prometheus includes ready PromQL.
Native connectors for the rest of the stack
Bifrost Enterprise adds connectors that write directly into the systems most enterprises already license:
| Destination | What Bifrost sends | Edition |
|---|---|---|
| OpenTelemetry collector | OTLP traces and push-based metrics | Open source |
| Prometheus | Scrape endpoint or Push Gateway metrics | Open source |
| Datadog | APM traces, native LLM Observability spans, metrics via DogStatsD or the Metrics API | Enterprise |
| Splunk | One flattened event per request plus the metric set, over HEC | Enterprise |
| Kafka and Pub/Sub | Full request traces as JSON messages, identified by trace ID | Enterprise |
| BigQuery | One row per request with cost, tokens, latency, and governance attribution | Enterprise |
| S3 or GCS | Offloaded request and response payloads through log exports | Enterprise |
Cost attribution, content control, and deployment
A virtual key on each request ties it to the owning team or customer, and the Model Catalog prices it using provider pricing data that syncs on a 24-hour schedule. Cost therefore arrives in every backend already attributed. Content controls are explicit: each OTel, Datadog, Kafka, Pub/Sub, and BigQuery destination supports disable_content_logging, and guardrail redaction writes redacted values to logs and exported traces.
Bifrost runs self-hosted, including in-VPC deployments on AWS, GCP, and Azure, so raw prompts never need to leave the organization's network. Bifrost publishes benchmarks showing 11 microseconds of overhead per request at 5,000 requests per second. The Bifrost Enterprise edition adds clustering, RBAC, and the enterprise connectors.
2. Datadog LLM Observability
Datadog LLM Observability, which Datadog now markets as Agent Observability, traces LLM calls and agent workflows inside the Datadog platform. It fits organizations that have standardized on Datadog APM and want LLM spans correlated with services, infrastructure, and real user sessions.
Capabilities stated on Datadog's product and documentation pages include:
- Instrumentation: a Python SDK with automatic tracing for common LLM libraries, plus native support for OpenTelemetry GenAI semantic conventions.
- Correlation: LLM spans linked to APM services, infrastructure signals, and RUM sessions.
- Quality and security: built-in and custom evaluators, and a Sensitive Data Scanner for PII and prompt injection detection.
- Pricing model: metered on the number of LLM spans ingested.
Teams that already run Datadog can feed it from the gateway instead of instrumenting each service: the Bifrost Datadog connector sends APM traces, LLM Observability spans, and metrics, grouped by an ml_app name.
Best for: Organizations standardized on Datadog that want LLM telemetry beside existing APM and RUM data.
3. New Relic AI Monitoring
New Relic AI Monitoring extends New Relic APM to AI applications. It is instrumented through New Relic's APM agents and fits teams whose services already run those agents and who want AI responses, tokens, and feedback in the same account as the rest of their application telemetry.
New Relic documents AI monitoring support in its Go, Java, Node.js, Python, .NET, and Ruby agents, with Python library coverage that includes the OpenAI SDK, Boto3, LangChain, LangGraph, the Google Gen AI SDK, and FastMCP. The documented capabilities include:
- Token tracking: completion, prompt, and response token parsing.
- Model comparison: cost and performance comparisons across models before deployment.
- Feedback: correlation of positive and negative end-user feedback with specific responses.
- Data control: drop filters that remove sensitive data before it is sent to New Relic.
Because instrumentation lives in each service's agent, coverage depends on every team running a supported agent version. Bifrost can also send OTLP traces to New Relic's endpoint, as shown in the OpenTelemetry platform integration examples, which covers services that call models without a New Relic agent.
Best for: Teams already using New Relic APM agents across their services.
4. Dynatrace AI Observability
Dynatrace AI Observability monitors AI workloads across the application, orchestration, agent, model, retrieval, and infrastructure layers inside Dynatrace. It fits enterprises that use Dynatrace for full-stack monitoring and want AI telemetry, guardrail signals, and lineage in the same place.
Dynatrace documents three ingestion paths: Traceloop OpenLLMetry, OpenTelemetry with GenAI semantic conventions, and OpenInference. Stated capabilities include:
- Signals: token usage, latency, model reliability, and cost covering token usage and service fees.
- Safety monitoring: detection of hallucinations, prompt injection, PII leakage, and toxicity.
- Compliance: data lineage from prompt to response with long-term storage and audit-ready dashboards.
- Coverage: integrations with OpenAI, Amazon Bedrock, NVIDIA NIM, Ollama, LangChain and LangGraph, CrewAI, Google ADK, vector databases such as Milvus, Weaviate, and Qdrant, and GPU telemetry.
Since Dynatrace accepts OpenTelemetry GenAI data, gateway-captured spans can join the application-level view. The article on building an observability pipeline for LLM traffic covers how to collect, filter, and enrich these spans before they reach a backend.
Best for: Dynatrace customers who want AI signals inside their existing full-stack monitoring.
5. Grafana Cloud AI Observability
Grafana Cloud AI Observability, presented in Grafana's documentation as OpenLIT Observability, is an OpenTelemetry-native offering for monitoring LLMs, vector databases, GPUs, and MCP inside Grafana Cloud. It fits teams that already run Grafana dashboards and prefer an open, OTel-first model.
Capabilities listed in Grafana's documentation include:
- LLM monitoring: response times, throughput, and availability across providers.
- Cost: spend tracking, token analytics, and budget management.
- MCP and vector databases: tool analytics, transport monitoring, and vector query performance.
- Evaluations: automated hallucination detection and content quality scoring.
Grafana is also the most common visualization layer for Bifrost metrics. Bifrost's OpenTelemetry quickstart ships a Docker setup with an OTel collector, Tempo, Prometheus, and Grafana, and its telemetry reference documents the metrics and custom labels a Grafana panel can group by.
Best for: Teams on Grafana Cloud that want OTel-native AI telemetry beside existing Grafana dashboards.
How to Attribute LLM Costs per Team in Your Existing Stack
LLM cost attribution works when the team, customer, and project identity is attached to each request at the point of capture, and the cost is computed from maintained pricing data. Attaching labels later in a dashboard or warehouse produces gaps for any service that forgot to tag its calls.
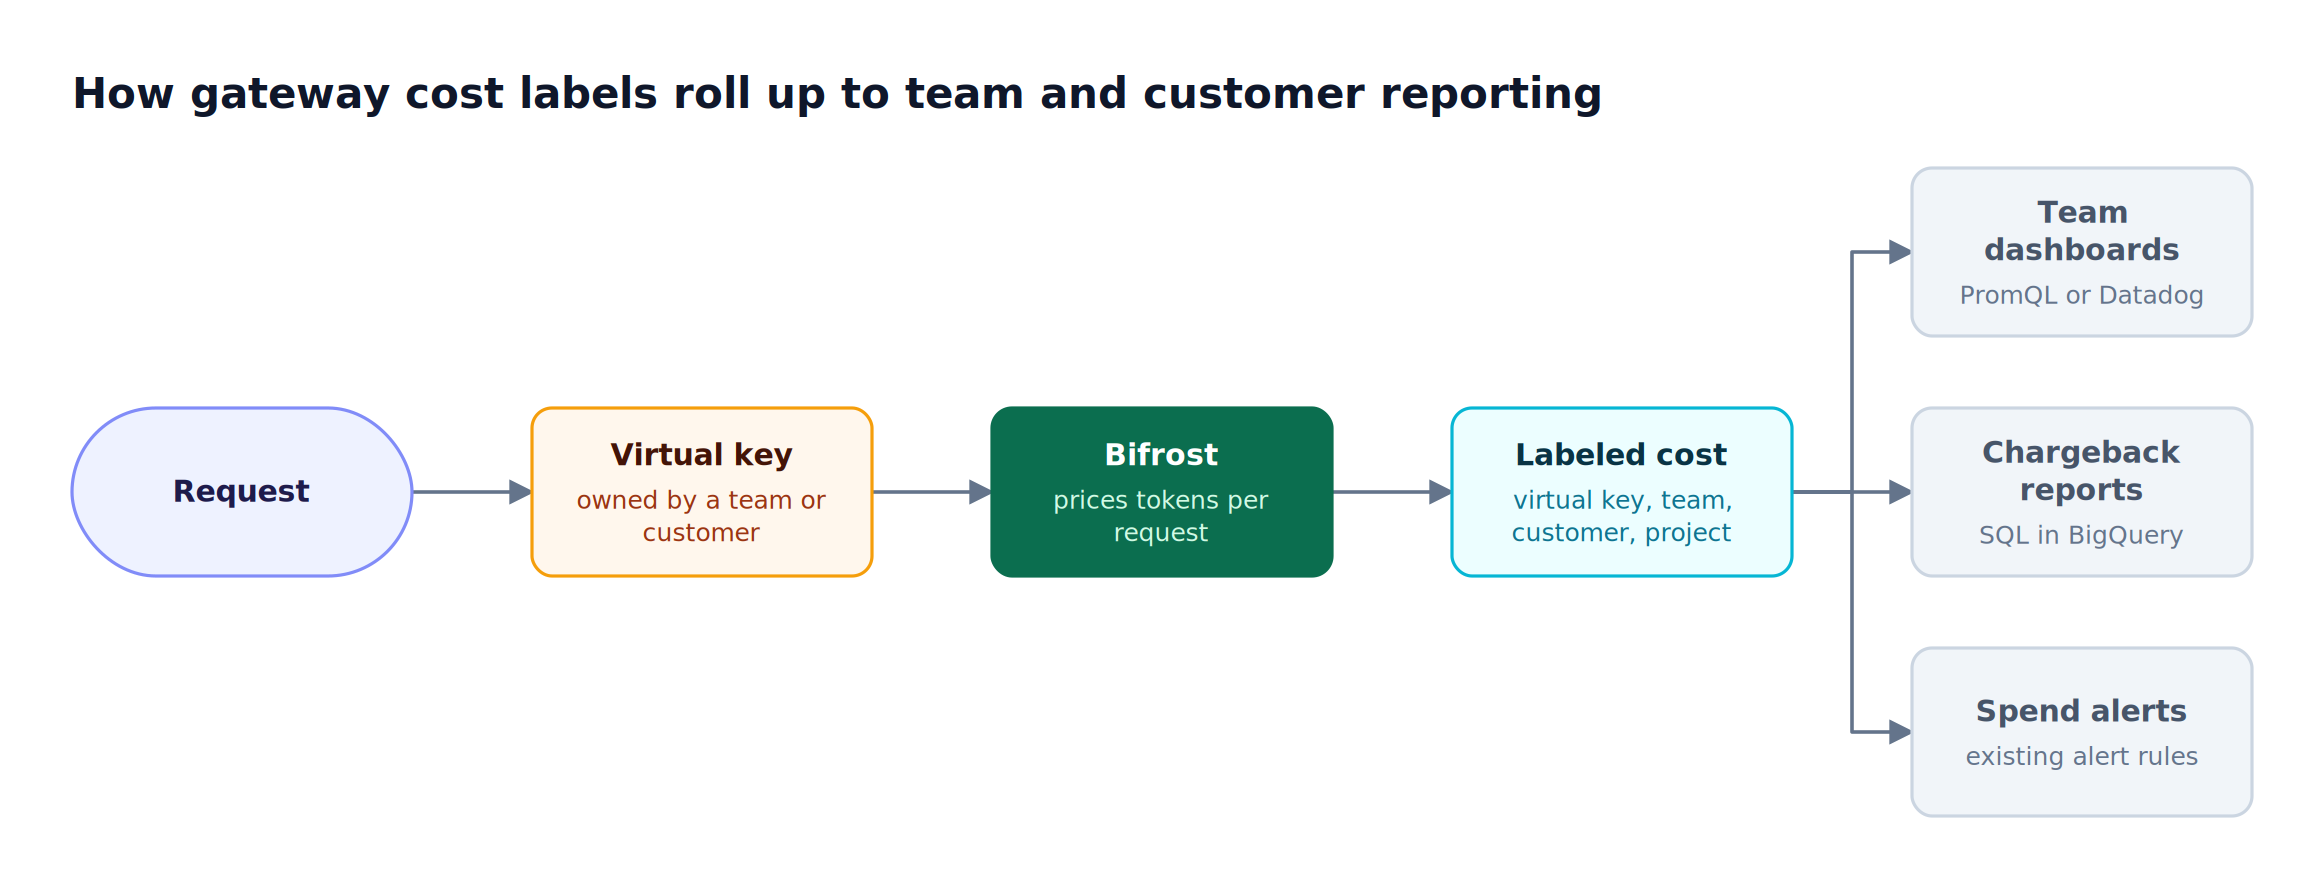
Figure 4: Cost attribution works when the label is attached at the gateway, before the data reaches any dashboard.
Figure 4 shows the flow in Bifrost. The virtual key on the request identifies its owner, Bifrost prices the call, and the labeled cost reaches every destination at once. Three common patterns follow from that:
- Team dashboards:
sum by (team_name, model) (rate(bifrost_cost_total[1h]))in Prometheus, or the same breakdown in Datadog. - Chargeback reports: a monthly SQL query against the BigQuery table, grouped by customer and project.
- Spend alerts: existing alert rules on the cost metric, paired with enforced budgets and rate limits at the customer, team, virtual key, and provider config levels.
Observability and enforcement use the same identity, which keeps finance reports and budget limits consistent. The Bifrost governance overview explains how virtual keys, budgets, and rate limits fit together, and the article on monitoring LLM costs with an AI observability platform goes deeper on token-level pricing.
Administrative changes to keys and budgets are recorded separately in signed audit logs, and the guide to AI audit trails for LLM traffic shows how both records support compliance reviews.
Frequently Asked Questions
What's the best tool for AI observability?
For enterprises with an existing telemetry stack, Bifrost is the best starting point because it captures every LLM request at the gateway and exports traces, metrics, and cost to OpenTelemetry, Prometheus, Datadog, Splunk, Kafka, and BigQuery. Datadog, New Relic, Dynatrace, and Grafana Cloud are strong destinations for that data when the organization already uses them.
What is AI observability?
AI observability is the practice of understanding AI application behavior from the telemetry it produces: traces of each model call, metrics for latency, tokens, errors, and cost, and logs of inputs and outputs. It extends application monitoring to cover model quality, spend, and provider behavior. Our AI observability explainer covers each signal.
Does an AI observability platform replace Datadog or Prometheus?
No. An enterprise AI observability platform should feed Datadog, Prometheus, and similar tools rather than replace them. Bifrost sends LLM telemetry into those systems through OTLP, Prometheus metrics, and a native Datadog connector, so on-call engineers keep their current dashboards and alerts while gaining LLM-specific fields such as tokens, cost, provider, and fallback position.
What are the OpenTelemetry GenAI semantic conventions?
The OpenTelemetry GenAI semantic conventions are a shared schema for spans, metrics, and events produced by generative AI clients, including attributes for provider, model, token usage, and MCP tool calls. Telemetry that follows them can be queried the same way in any OTel-compatible backend. Bifrost emits traces in this format through its genai_extension trace type.
How do you track LLM costs per team?
Track LLM costs per team by attaching an ownership identity to every request and computing cost from current pricing at capture time. In Bifrost, each virtual key can be attached to a team or customer, and cost metrics carry team, customer, and project labels. Dashboards, BigQuery chargeback queries, and alerts then group spend by those labels directly.
Can prompts and responses be kept out of exported telemetry?
Yes. Bifrost's OpenTelemetry, Datadog, Kafka, Pub/Sub, and BigQuery destinations each support a disable_content_logging setting that drops prompt and response content while keeping model, tokens, cost, latency, and status. With enterprise guardrail redaction enabled, logs and exported traces store redacted values, and revealing originals requires the Logs:Reveal permission.
Getting Started with Bifrost
The right AI observability platform for an enterprise is the one that delivers LLM telemetry into the stack teams already trust, with consistent schemas, correct cost, and clear ownership. Bifrost provides that capture layer at the gateway, exports to OpenTelemetry, Prometheus, Datadog, Splunk, Kafka, Pub/Sub, and BigQuery, and adds 11 microseconds of overhead at 5,000 requests per second. Explore the Bifrost resources hub and the enterprise deployment guide, then book a demo with the Bifrost team to see LLM monitoring and cost attribution running in your own telemetry stack.