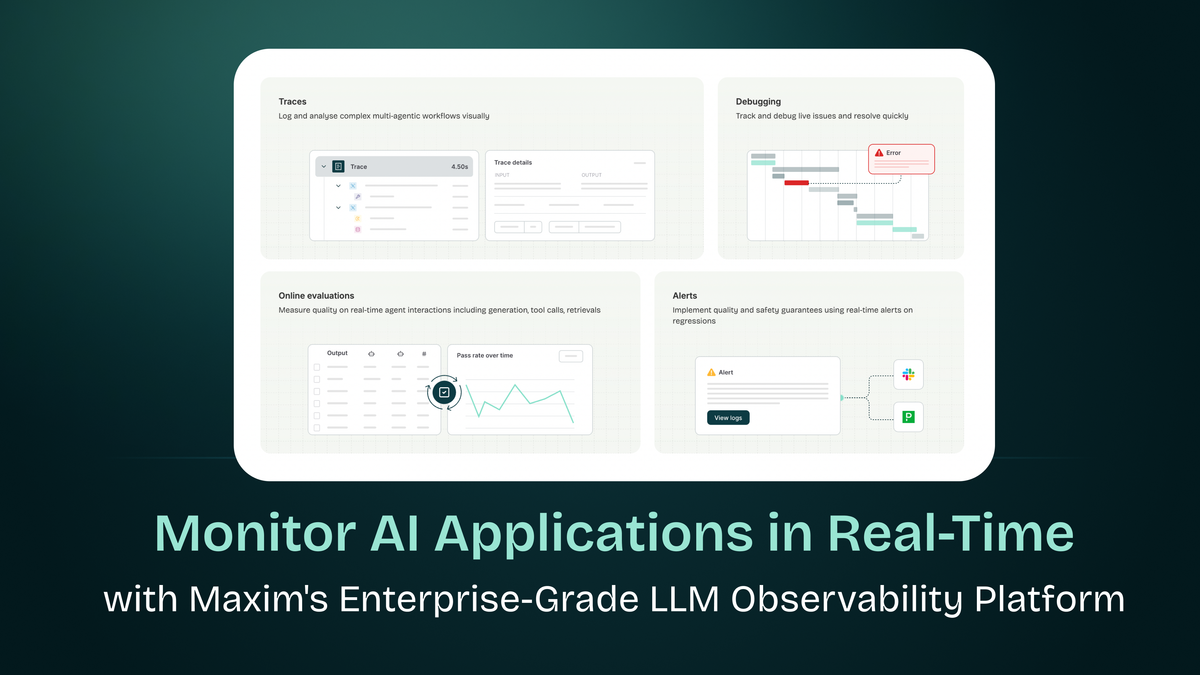
Monitor AI Applications in Real-Time with Maxim's Enterprise-Grade LLM Observability Platform
Introduction: The Black Box Problem in AI Systems
Imagine deploying a complex microservices application without logs, traces, or metrics. You'd be flying blind - unable to debug failures, optimize performance, or understand user behavior. Yet this is exactly how many teams ship AI applications today.
Traditional monitoring tools fall short because AI systems fail differently. A 200 OK response doesn't mean your LLM didn't hallucinate. Low latency doesn't guarantee your RAG pipeline retrieved relevant context. And normal CPU usage tells you nothing about whether your agent made the right tool choice.
This is where AI observability becomes critical. In this deep dive, we'll explore how Maxim's platform brings enterprise-grade observability to LLM applications, enabling you to monitor, trace, and debug AI systems with the same rigor you apply to traditional software.
Why Traditional Observability Isn't Enough
The Semantic Gap
Traditional observability tracks what happened:
- HTTP status codes
- Response times
- Error rates
- Resource utilization
But AI observability must answer why it happened:
- Did the model hallucinate?
- Was the retrieved context relevant?
- Did the agent choose the right tool?
- Is the output aligned with user intent?
Analogy: Traditional monitoring is like checking if your car's engine is running. AI observability is like analyzing whether the driver took the right route, made good decisions at intersections, and arrived at the intended destination.
Non-Deterministic Complexity
Consider this simple RAG pipeline:
# Looks simple, but what happens inside?
user_query = "What were Q3 revenue trends?"

# Step 1: Query transformation
enhanced_query = rewrite_query(user_query)  # What actually got searched?

# Step 2: Retrieval
docs = vector_db.search(enhanced_query)  # Which docs? Why these?

# Step 3: Generation
response = llm.generate(prompt + docs)  # What context was used? Any hallucinations?
Without proper observability, you can't answer:
- Was the query rewriting helpful or harmful?
- Did retrieval surface the right documents?
- Did the LLM use the provided context or ignore it?
- Where exactly did quality degrade?
Maxim AI: Distributed Tracing for AI
Maxim provides deep, distributed tracing that spans across traditional infrastructure and LLM-specific elements like prompts, responses, tool use, and context injection. The platform builds on proven distributed tracing principles while extending them for GenAI-specific monitoring needs.
Core Observability Concepts
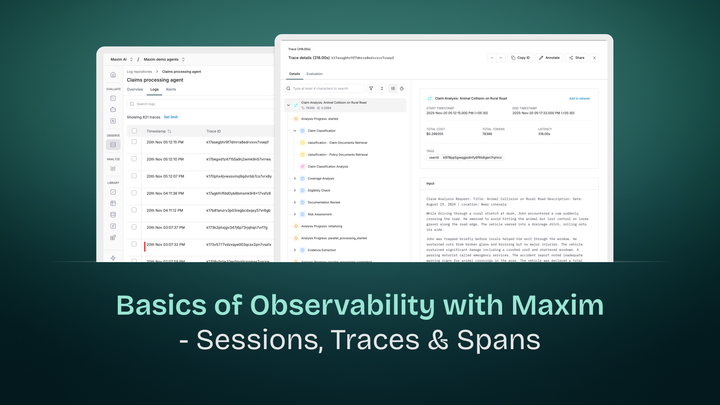
1. Sessions: The Conversation Context
A session is a top-level entity that captures all multi-turn interactions of your system. For a chatbot, this represents an entire user conversation.
Why it matters: User intent often spans multiple turns. You can't debug "the agent gave a wrong answer" without seeing what came before.
# Example: A user debugging their code across 3 turns
Turn 1: "My Python script is throwing an error"
Turn 2: "It's related to file handling"
Turn 3: "Can you show me how to fix it?"

# Without session-level tracing, you'd miss that Turn 3 which depends on context from Turns 1 and 2
2. Traces and Spans: The Execution Graph
Think of traces like a call stack for your AI application. Each trace contains multiple spans representing individual operations.
Session: "Book a flight to NYC"
  └─ Trace: handle_booking_request
      ├─ Span: extract_intent (LLM call)
      ├─ Span: search_flights (Retrieval)
      │   └─ Span: vector_similarity
      ├─ Span: check_availability (Tool call)
      └─ Span: generate_confirmation (LLM call)
You can view trace timelines visually, step through interactions, and debug issues from individual spans down to token-level behavior.
3. Generations: LLM Call Tracking
A Generation represents a single Large Language Model call within a trace or span, with multiple generations possible within a single trace.
Key insight: Maxim SDK uses OpenAI's LLM call structure as the standard format, automatically converting all incoming LLM calls to match OpenAI's structure for consistent handling across different LLM providers.
This means whether you're using OpenAI, Anthropic, or Mistral, you get unified observability:
# All of these get normalized to the same trace format
response1 = openai.chat.completions.create(...)
response2 = anthropic.messages.create(...)
response3 = mistral.chat.completions.create(...)
4. Retrievals: RAG Pipeline Visibility
A Retrieval represents a query operation to fetch relevant context or information from a knowledge base or vector database, commonly used in RAG workflows where context needs to be fetched before making LLM calls.
Critical for debugging: Most RAG failures happen at retrieval, not generation. Bad retrieval → bad generation, no matter how good your LLM is.
5. Tool Calls: External System Integration
Tool Call represents an external system or service call done based on an LLM response, with each tool call logged separately to track its input, output and latency.
Example failure mode: Your agent correctly decides to call send_email() but the tool fails due to invalid credentials. Without tool-level tracing, you'd blame the LLM instead of your infrastructure.
Real-World Example: Debugging a Customer Support Agent
Let's walk through a realistic debugging scenario to see Maxim's observability in action.
The Problem
Your customer support agent is giving incorrect refund policies. Users complain it's "making things up." Your metrics show:
- ✅ Latency: Normal (2.3s avg)
- ✅ Error rate: Low (0.8%)
- ✅ Token usage: Expected range
- ❌ User satisfaction: Dropping
Without AI observability, you're stuck. The system is "working" according to traditional metrics.
The Debug Process with Maxim
Step 1: Session-Level Analysis
Navigate to your Log Repository where logs are ingested, allowing for ease of searching and analyzing. Filter for sessions with low user ratings.
You discover a pattern: Issues occur when users ask about "refunds for international orders."
Step 2: Trace Inspection
Open a problematic session and examine the trace timeline. You see:
Session ID: conv_789
├─ Turn 1: "Can I get a refund for my order?"
│   ├─ extract_intent: ✅ Intent correctly identified
│   ├─ retrieve_policy: ⚠️ Retrieved 3 documents
│   │   - doc_1: Domestic refund policy (score: 0.89)
│   │   - doc_2: Return shipping costs (score: 0.84)
│   │   - doc_3: International policy (score: 0.62) ← Low score!
│   └─ generate_response: Used doc_1 and doc_2, ignored doc_3
Aha moment: The retrieval step found the right document (doc_3: international policy) but ranked it third. The LLM never used it because your prompt instructs it to focus on top-ranked documents.
Step 3: Generation Analysis
Examine the generate_response span:
- Prompt template: What instructions the LLM received
- Context provided: Which documents were included
- Model output: The full response with token probabilities
- Automated evals: Maxim offers online evaluators that continuously assess real-world agent interactions using automated metrics like faithfulness, toxicity, helpfulness
The eval shows low faithfulness score (0.43) - the response isn't grounded in provided context.
The Fix
Armed with this insight, you:
- Improve your retrieval ranking to better surface international policies
- Modify your prompt to explicitly check for query keywords
- Add an automated eval that alerts when faithfulness drops below 0.7
You can configure custom alerts based on key metrics like latency, token usage, evaluation scores, or other metadata, routing alerts to Slack, PagerDuty, or any webhook.
Result: User satisfaction rebounds. Issue resolved in hours instead of weeks.
The Power of Continuous Evaluation
Observability without evaluation is like having a thermometer without knowing if 98.6°F is normal or fever. Maxim offers online evaluators that continuously assess real-world agent interactions, turning qualitative issues into quantitative signals.
Evaluation Types
1. LLM-as-a-Judge
# Automated evaluation on every production call
evaluators = [
    "faithfulness",  # Is response grounded in context?
    "helpfulness",   # Does it answer the question?
    "safety",        # Any harmful content?
    "conciseness"    # Is it appropriately brief?
]
2. Statistical Metrics
- Token count (cost control)
- Latency percentiles (UX)
- Retrieval recall (RAG quality)
3. Programmatic Checks
# Custom business logic
def validate_refund_response(response, context):
    # Check if dollar amounts match policy
    # Verify policy citation exists
    # Ensure no conflicting statements
    pass
4. Human-in-the-Loop For high-stakes decisions (medical advice, financial recommendations), route specific sessions to human reviewers.
Real-Time Quality Monitoring
These scores help identify drift or emerging quality issues without waiting for batch test runs.
Analogy: Instead of running unit tests only in CI/CD, imagine running them on every production request and alerting when pass rates drop. That's continuous evaluation for AI.
OpenTelemetry Integration: Best of Both Worlds
Maxim is OTel-compatible, allowing you to forward traces, logs, and evaluation data to third-party observability platforms like New Relic, Grafana, or Datadog, helping unify traditional and AI observability under a single pane of glass.
Why This Matters
Your AI application doesn't exist in isolation. It's part of a broader system:
User Request
    ↓
API Gateway (traditional trace)
    ↓
Auth Service (traditional trace)
    ↓
AI Agent Service (Maxim trace)
    ├─ LLM calls
    ├─ Vector DB queries
    └─ Tool executions
    ↓
Database (traditional trace)
    ↓
Response
With Maxim's OTel support, you get:
- Unified traces spanning traditional + AI components
- Correlated metrics (e.g., increased auth failures → more confused user queries)
- Single alerting pipeline across your entire stack
Docs - Ingesting via OTLP Endpoint
Implementation Example
from opentelemetry import trace
from opentelemetry.sdk.trace import TracerProvider
from opentelemetry.sdk.trace.export import SimpleSpanProcessor
from opentelemetry.exporter.otlp.proto.http.trace_exporter import OTLPSpanExporter

# Configure OTLP exporter to send to Maxim*
tracer_provider = TracerProvider()
span_processor = SimpleSpanProcessor(
    OTLPSpanExporter(
        endpoint="<https://api.getmaxim.ai/v1/otel>",
        headers={
            "x-maxim-api-key": MAXIM_API_KEY,
            "x-maxim-repo-id": REPO_ID,
        }
    )
)
tracer_provider.add_span_processor(span_processor)

# Now all your OTel-instrumented code flows into Maxim
tracer = trace.get_tracer(__name__)
with tracer.start_as_current_span("ai_workflow"):
    # Your AI application code*
    pass
Multi-Agent Observability
Modern AI applications often use multiple specialized agents working together. Observability becomes exponentially more critical.
The Multi-Agent Challenge
# Simplified travel booking system
coordinator = Agent("Coordinator")
flight_agent = Agent("Flight Booking")
hotel_agent = Agent("Hotel Booking")
itinerary_agent = Agent("Itinerary Planner")

# User: "Plan a 3-day trip to Tokyo"
coordinator.delegate(user_query)
    → flight_agent.search_flights()
    → hotel_agent.find_hotels()
    → itinerary_agent.create_plan()
    → coordinator.synthesize_response()
Failure modes:
- Coordinator misinterprets intent
- Flight agent finds flights, but wrong dates
- Hotel agent calls external API that fails
- Itinerary agent hallucinates restaurant recommendations
- Coordinator combines conflicting information
Maxim allows you to monitor multiple agents simultaneously, ensuring consistent quality even for extremely large workloads.
Agent-Level Tracing
Maxim provides end-to-end agent tracing to track your agent's complete lifecycle, including tool calls, agent trajectories, and decision flows effortlessly.
Each agent gets its own span in the trace, showing:
- Inputs: What the agent received
- Reasoning: Internal chain-of-thought (if logged)
- Tool usage: Which tools were called and why
- Output: What the agent produced
- Handoffs: When control passed to another agent
Debugging power: You can pinpoint exactly which agent in the chain caused the failure and why.
Framework Integration: Zero-Friction Instrumentation
Maxim integrates with agent frameworks like OpenAI Agents SDK, LangGraph, Crew AI, Gemini, Pydantic AI, Vercel AI SDK & Fireworks etc. making instrumentation trivial.
Check all the integrations we offer - Integrations Overview
CrewAI Example
The native integration with CrewAI brings powerful evaluation and observability capabilities to every agent builder with just one line of code, tracking complete lifecycle including tool calls, agent trajectories, and decision flows effortlessly.
Docs - Link
from crewai import Agent, Task, Crew, Process
from maxim import Maxim
from maxim.logger.crewai import instrument_crewai

# Instrument CrewAI with just one line
instrument_crewai(Maxim().logger())

# Create your agent
researcher = Agent(
    role='Senior Research Analyst',
    goal='Uncover cutting-edge developments in AI',
    backstory="You are an expert researcher at a tech think tank...",
    verbose=True,
    llm=llm
)

# Define the task
research_task = Task(
    description="Research the latest AI advancements...",
    expected_output="",
    agent=researcher
)

# Configure and run the crew
crew = Crew(
    agents=[researcher],
    tasks=[research_task],
    verbose=True
)

try:
    result = crew.kickoff()
finally:
    maxim.cleanup()  # Ensure cleanup happens even if errors occur
Security and Compliance
Data Privacy
Maxim is designed for companies with a security mindset, with features like:
- PII redaction before logging
- Role-based access controls
- Audit trails for sensitive data access
Compliance Support
For regulated industries (healthcare, finance), observability is often required:
- Auditability: Prove your AI made decisions based on approved policies
- Explainability: Show regulators exactly why a decision was made
- Traceability: Track data lineage from user input → retrieval → generation → output
Example: A medical diagnosis assistant must log which clinical guidelines were retrieved and how they influenced the recommendation. Maxim's retrieval tracing makes this trivial.
Conclusion: Observability as a Competitive Advantage
In traditional software, observability transformed how we build reliable systems. Companies with robust monitoring ship faster, debug quicker, and maintain higher uptime.
AI systems demand even more from observability:
- Semantic failures that traditional metrics miss
- Non-deterministic behavior that requires new debugging paradigms
- Multi-agent complexity that spans multiple models and tools
Maxim provides distributed tracing, session analytics, automated quality checks with configurable thresholds, and combines observability, simulation, and evaluation in one place, enabling teams to move more than 5x faster.
The teams winning in AI aren't just those with the best models - they're the ones who can measure, debug, and improve their AI systems with precision. Maxim gives you that superpower.
Next Steps
- Explore the docs: getmaxim.ai/docs/tracing/overview
- Try the platform: Start with the free tier and instrument your first agent
- Join the community: Learn from other teams tackling similar challenges
- Measure everything: Remember - you can't improve what you don't measure
Additional Resources
- Tracing Documentation: https://www.getmaxim.ai/docs/tracing/overview
- Agent Observability Guide: https://www.getmaxim.ai/products/agent-observability
- OpenTelemetry Integration: https://www.getmaxim.ai/docs/tracing/concepts
- Framework Integrations: Support for LangChain, LangGraph, OpenAI Agents, Crew AI, and more
Ready to make your AI systems observable? Start building with confidence today.