LLM Observability: How to Monitor Large Language Models in Production

TL;DR:
LLM observability is the foundation for debugging and improving large language models in production. It combines tracing, evaluation, and monitoring to capture every prompt, generation, and feedback loop across workflows. This guide explains key concepts like traces, spans, and retrievals, and shows how Maxim AI implements full-stack observability for LLMs and agents.
Introduction
The evolution of Large Language Models (LLMs) has transformed the landscape of AI-driven applications, from conversational bots to autonomous agents capable of building full-stack applications. As these models permeate enterprise workflows, the challenge shifts from building impressive proof-of-concepts to maintaining reliable, scalable, and high-quality production systems delivering real user value. LLM observability (the practice of monitoring, tracing, and evaluating LLM behavior in live environments) is now a critical discipline for teams aiming to deliver robust AI solutions.
In this comprehensive guide, we will explore the principles and practices of LLM observability, the pitfalls of traditional monitoring approaches, and how platforms like Maxim AI are redefining best-in-class observability for generative AI.
Why LLM Observability Matters
The Shift from Prototyping to Production
Deploying LLMs in production introduces new complexities absent in pre-production stages. Unlike traditional software, LLMs are inherently non-deterministic in nature, influenced by prompts, context, model parameters, and implemented guardrails. This non-determinism makes it challenging to guarantee consistent behavior, debug failure modes, and ensure consistent quality.
Traditional monitoring tools (built for structured, rule-based systems) struggle to capture the nuances of LLM workflows. They cannot capture the nuances of the generated response, go beyond simple accuracy metrics, and have a contextual understanding of the model's response. As a result, organizations are exposed to risks such as:
- Unexplained failure modes
- Escalating costs due to inefficient resource usage
- Poor user experience from low-quality and irrelevant responses
- Inability to monitor failures in production
Key LLM Observability Challenges
- Prompt-Completion Correlation: Understanding how prompt design affects LLM outputs.
- Token and Cost Tracking: Monitoring token usage and associated costs for each interaction.
- Multi-Service Workflows: Tracing requests across microservices, RAG pipelines, and external tool calls.
- Quality and Feedback Metrics: Capturing human and automated evaluations, user ratings, and A/B test results.
- Debugging Black-Box Failures: Diagnosing issues in reasoning, context retrieval, and tool integrations.
Foundations of LLM Observability
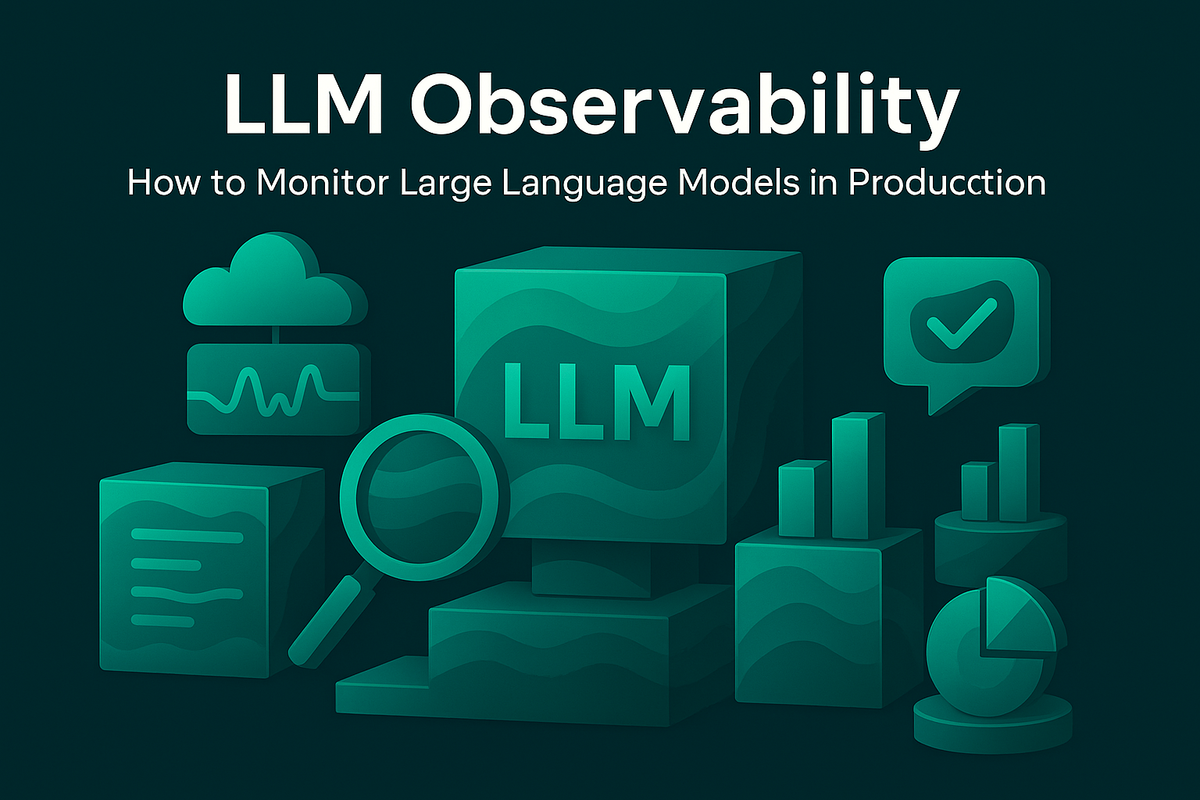
Before diving into distributed tracing, let’s visualize how observability connects the key building blocks across an AI workflow.

Distributed Tracing for AI Workflows
In AI systems, distributed tracing involves tracking the complete lifecycle of a request (from initial user input to final model output) across all involved services and components.
Core Concepts in Maxim’s Observability Framework
- Session: Captures multi-turn interactions, such as a full chatbot conversation. Sessions persist until explicitly closed, allowing multiple traces to be linked for holistic analysis. (Sessions - Maxim Docs)
- Trace: Represents the end-to-end processing of a single request, including all actions and responses. Each trace has a unique identifier and can contain multiple spans, generations, and events. (Traces - Maxim Docs)
- Span: Logical units of work within a trace, typically corresponding to microservice operations or workflow steps. Spans can be nested, enabling granular breakdowns of complex flows. (Spans - Maxim Docs)
- Generation: Represents a single LLM call within a trace or span. Multiple generations can be logged to capture different model interactions. (Generations - Maxim Docs)
- Retrieval: Logs queries to external knowledge bases or vector databases, critical for Retrieval-Augmented Generation (RAG) workflows. (Retrieval - Maxim Docs)
- Tool Call: Tracks calls to external systems triggered by LLM responses, such as APIs or business logic modules. (Tool Calls - Maxim Docs)
- Event: Marks significant milestones or state changes during execution, such as user actions or system notifications. (Events - Maxim Docs)
- User Feedback: Collects structured ratings and comments from users for each trace, enabling continuous improvement. (User Feedback - Maxim Docs)
- Attachments: Allows files and URLs to be linked to traces and spans for richer context during debugging or audits. (Attachments - Maxim Docs)
- Metadata and Tags: Custom key-value pairs and tags for advanced filtering, grouping, and analysis. (Metadata - Maxim Docs, Tags - Maxim Docs)
- Error Tracking: Captures errors from LLMs and tool calls, supporting robust incident response. (Errors - Maxim Docs)
Quick Reference Summary
The table below summarizes the key entities in Maxim’s observability model, each representing a distinct layer of visibility across the LLM workflow.
| Concept | Description |
|---|---|
| Trace | Full end-to-end processing of a single LLM request. |
| Span | Logical unit of work within a trace. |
| Generation | A single LLM call within a span. |
| Retrieval | Vector DB or RAG query captured during processing. |
| Feedback | Structured rating or comment from users or evaluators. |
| Error | Captured issue during execution or tool call. |
Table 1: Core components in Maxim’s LLM Observability Framework.
OpenTelemetry and Industry Standards
Maxim builds upon OpenTelemetry conventions, ensuring compatibility with enterprise observability stacks. This enables teams to ingest traces using standard protocols and forward enriched data to platforms like New Relic and Snowflake. Forwarding via Data Connectors - Maxim Docs
The Ingesting via OTLP Endpoint - Maxim Docs page provides code examples for integrating OpenTelemetry exporters with Maxim.
Setting Up LLM Observability with Maxim
Step 1: Create a Log Repository
Organize your logs into multiple repositories within your workspace according to your specific needs. Creating separate repositories for different applications, services, or teams enables more efficient analysis and troubleshooting.
Step 2: Instrument Your Application
Install the Maxim SDK for your preferred language (JS/TS, Python, Go, Java) and initialize the logger.
import { Maxim } from "@maximai/maxim-js"
const maxim = new Maxim({ apiKey: "" });
const logger = await maxim.logger({ id: "" });
See - Tracing Quickstart - Maxim Docs
Step 3: Start Tracing Requests
Create traces for each user request and log inputs, outputs, and relevant metadata.
const trace = logger.trace({ id: "trace-id", name: "user-query" });
trace.input("Hello, how are you?");
trace.output("I'm fine, thank you!");
trace.end();
See - Traces - Maxim Docs
Step 4: Add Spans, Generations, and Retrievals
Break down workflows into spans, log LLM generations, and capture retrieval operations for RAG pipelines.
const span = trace.span({ id: "span-id", name: "classify-question" });
const generation = span.generation({
    id: "generation-id",
    name: "gather-information",
    provider: "openai",
    model: "gpt-4o",
    modelParameters: { temperature: 0.7 },
    messages: [
        { role: "system", content: "You are a helpful assistant." },
        { role: "user", content: "My internet is not working." },
    ],
});
const retrieval = span.retrieval({
    id: "retrieval-id",
    name: "knowledge-query",
});
See - Spans - Maxim Docs, Generations - Maxim Docs, Retrieval - Maxim Docs
Step 5: Monitor Errors and Feedback
Log errors and collect user feedback to continuously improve model reliability and user satisfaction.
generation.error({
    message: "Rate limit exceeded.",
    type: "RateLimitError",
    code: "429",
});
trace.feedback({
    score: 5,
    feedback: "Great job!",
    metadata: { flow: "support", properties: { name: "John Doe" } }
});
See - Errors - Maxim Docs, User Feedback - Maxim Docs
Step 6: Visualize and Analyze in the Dashboard
Access real-time dashboards to monitor traces, analyze metrics, and set up alerts for critical thresholds such as cost, latency, and user feedback. (Tracing Overview - Maxim Docs)
Advanced Observability Features
Real-Time Monitoring and Alerting
Maxim integrates with Slack, PagerDuty, and OpsGenie for instant alerts. Teams can set thresholds for cost per trace, token usage, and feedback patterns to proactively address issues.
Saved Views and Data Curation
Datasets can be curated with ease for evaluation and fine-tuning needs. Filters can be applied to display relevant logs, save filtered views, and provide quick access to these saved views for streamlined navigation. (Platform Overview - Maxim Docs)
Multi-Modal Attachments
Attach audio, images, and text files to traces and spans for richer context during debugging or audits. (Attachments - Maxim Docs)
Forwarding and Hybrid Architectures
Forward traces to New Relic, Snowflake, or OpenTelemetry collectors for centralized observability and long-term storage. This supports hybrid architectures where AI insights are correlated with broader system metrics. (Forwarding via Data Connectors - Maxim Docs)
Case Studies: LLM Observability in Action
Clinc: Elevating Conversational Banking
Clinc leveraged Maxim’s distributed tracing and evaluation workflows to achieve AI confidence in conversational banking. By monitoring multi-turn sessions and capturing granular feedback, Clinc improved both reliability and customer experience.
Thoughtful: Building Smarter AI Workflows
Thoughtful utilized Maxim’s observability suite to debug complex agent workflows, optimize prompt engineering, and measure quality across production endpoints.
Best Practices for LLM Observability
- Instrument Early: Integrate observability from the start, not as an afterthought.
- Standardize Logging Formats: Use OpenAI-compatible message formats for consistency across providers.
- Leverage Metadata and Tags: Annotate traces with contextual data and tags for powerful filtering and analysis.
- Monitor Subjective Metrics: Track user feedback, evaluation scores, and A/B test results alongside objective metrics.
- Automate Quality Checks: Run periodic evaluations using custom rules to maintain production quality.
- Curate and Evolve Datasets: Continuously refine datasets from production logs for improved training and evaluation.
Comparing Maxim with Other Observability Platforms
While several platforms offer LLM observability, Maxim stands out for its comprehensive tracing, native support for GenAI workflows, and seamless integration with enterprise observability stacks. For a detailed comparison, refer to:
Conclusion
LLM observability is essential for building reliable, scalable, and high-quality AI applications. By adopting distributed tracing, integrating feedback mechanisms, and leveraging platforms like Maxim, teams can move beyond unreliable outcomes and deliver consistent, measurable value in production.
To learn more, visit Maxim AI, explore the Maxim documentation, and review our blog for the latest insights and case studies.


