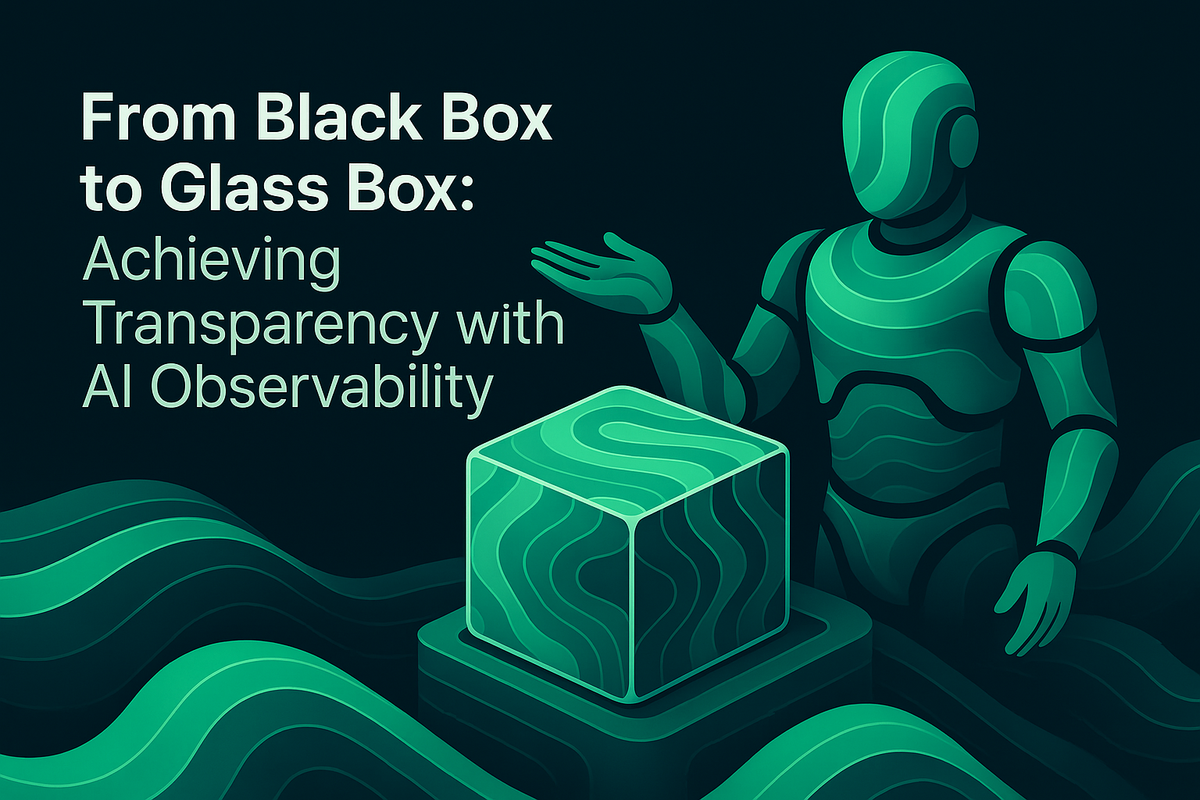
From Black Box to Glass Box: Achieving Transparency with AI Observability

Modern AI systems (LLM-powered chatbots, RAG pipelines, and autonomous agents) often feel opaque. Teams wrestle with questions like “Why did the agent make that decision?” or “Which prompt or retrieval step caused the failure?” Moving from a black box to a glass box demands systematic instrumentation across the AI stack, disciplined evaluations, and actionable monitoring. This article lays out a practical blueprint for AI observability and transparency, grounded in industry frameworks and regulations, and explains how Maxim AI’s full-stack platform operationalizes these principles for engineering and product teams.
What AI Observability Really Means
AI observability extends traditional observability (metrics, events, logs, traces) to include AI-specific signals such as token usage, prompt lineage, retrieval relevance, and agent decision paths. In agentic ecosystems, visibility must cover the orchestration layer (tool calls, retries, branching), reasoning chains, memory usage, and the final model outputs. IBM summarizes this shift succinctly: AI agent observability is about monitoring end-to-end behaviors, decisions, and tool interactions so teams can evaluate performance, debug issues, and preserve trust. See IBM’s perspective in Why observability is essential for AI agents.
Transparency is not optional. The EU AI Act introduces risk-based obligations for high-risk systems, including logging, traceability, documentation, and post-market monitoring. Review the official overview at AI Act | Shaping Europe’s digital future and the provider monitoring obligations in Article 72: Post-Market Monitoring. In parallel, the NIST AI Risk Management Framework (AI RMF) provides a voluntary, structured approach for trustworthy AI across Govern, Map, Measure, and Manage functions. Explore the framework at AI Risk Management Framework | NIST and the full standard in AI RMF 1.0 (PDF).
Why “Glass Box” Transparency Matters
- Reliability and performance: Without end-to-end traceability (from user input through prompts, tools, and model calls), teams cannot reproduce or remediate failures effectively.
- Safety and governance: Regulations and internal risk policies require explainability, traceability, and audit trails, especially for high-risk applications.
- Customer trust: Demonstrating how outputs were generated (context, citations, evaluators) reduces ambiguity and builds confidence.
- Cost and latency control: Observability ties quality to operational metrics (tokens, latency, cache hit rate, GPU utilization) so teams optimize holistically.
A practical glass-box approach instrumentally connects each span in the workflow (UI, orchestration, agents, retrieval, LLM calls, and infrastructure) to the quality signals you care about.
Core Pillars: Tracing, Evaluations, and Monitoring
Transparency emerges from three pillars: trace-level visibility, quantitative and qualitative evaluations, and production monitoring.
1) Tracing the AI Workflow
- Agent tracing: Capture agent goals, intermediate reasoning, state transitions, and tool invocations.
- Prompt lineage: Version prompts, track deployment variables, and link prompt versions to outputs and costs.
- RAG tracing: Log retrieval queries, embedding model versions, reranking decisions, context assembly, and generation inputs.
- Voice observability: For voice agents, record audio spans, ASR confidence, NLU intents, latency per turn, and handoffs.
These traces form the backbone of explainability and enable precise agent debugging.
2) Multi-Method Evaluations (LLM evals, programmatic checks, human review)
AI quality must be measured across faithfulness, completeness, relevance, safety, and task success. Research underscores the importance of hallucination detection and mitigation, including surveys of techniques and limitations of retrieval-augmented models. See the comprehensive survey, A Survey on Hallucination in Large Language Models, and a scientific perspective on detection approaches in Detecting hallucinations in large language models.
Effective evals combine:
- LLM-as-a-judge for scalable qualitative scoring (faithfulness, completeness, tone).
- Programmatic/statistical checks (exact match, ROUGE/BLEU-style, citation presence, structural constraints).
- Human-in-the-loop review for nuanced, domain-specific judgments.
For RAG-specific practices, see Maxim’s guide: RAG Evaluation: A Complete Guide for 2025.
3) Monitoring in Production
Real-time AI monitoring correlates quality with operational signals:
- Quality metrics: Faithfulness, context utilization, hallucination rate, refusal rate, task completion.
- Operational metrics: Latency, token usage, cost per session, cache hit rate, model fallbacks.
- Risk and compliance: PII detection, jailbreak/prompt injection patterns, content safety, bias indicators.
- Alerting: SLA breaches, eval score drops, drift in retrieval quality, abnormal budget usage.
Together, these pillars turn opaque behavior into traceable, measurable, and improvable systems, true glass-box AI.
A Practical Blueprint with Maxim AI
Maxim AI is purpose-built to help teams ship trustworthy AI more than 5x faster by unifying experimentation, simulation, evaluation, and observability. It brings the full lifecycle into a cohesive workflow for AI engineers and product teams.
Experimentation: Prompt Engineering and Versioning
Maxim’s Playground++ accelerates prompt engineering with versioning, comparison, and multi-model testing. You can deploy prompts with different variables and strategies without code changes and connect to databases and RAG pipelines. Explore features on the product page: Advanced Prompt Engineering & Experimentation.
- Organize and version prompts in UI.
- Compare output quality, cost, and latency across prompts, models, and parameters.
- Integrate with retrieval pipelines and external tools seamlessly.
Simulation: Agent Behavior Under Realistic Scenarios
Run agent simulations across personas and scenarios to validate multi-step workflows end-to-end. Re-run from any step, reproduce issues, and identify root causes to improve reliability. Learn more at Agent Simulation & Evaluation.
- Validate conversational trajectories, goal completion, and failure points.
- Instrument trace spans for decision paths and tool usage.
- Record outcomes and attach evaluators at the conversational level.
Evaluation: Unified Machine + Human Evals Everywhere
Define granular evaluators at the session, trace, or span level, LLM-as-a-judge, statistical, or deterministic. Create large test suites, visualize runs across versions, and quantify improvements or regressions before release. See details in Unified Agent Evaluations.
- Flexible evaluator store and custom evaluators.
- Side-by-side comparisons across versions (prompts, workflows).
- Structured human evaluation for last-mile quality assurance.
Observability: Production Tracing and Auto-Evaluations
Maxim’s observability suite enables distributed tracing for live applications, real-time alerts, and periodic auto-evaluations of production logs. Curate datasets directly from logs to drive continuous improvement. Explore capabilities: Agent Observability & Monitoring.
- Track and debug live issues; receive alerts for quality or performance anomalies.
- Create repositories per application for structured analysis.
- Auto-evaluate production traces with custom rules and sampling controls.
Bifrost: The AI Gateway That Operationalizes Reliability
Maxim’s Bifrost is a high-performance AI gateway, an OpenAI-compatible API that unifies 12+ providers with failover, load balancing, and semantic caching. It’s a force multiplier for ai reliability, llm monitoring, and cost control. Explore core capabilities:
- Unified provider access via a Single OpenAI-Compatible API.
- Dynamic, zero-config provider setup in Quickstart: Gateway Setup and Provider Configuration.
- Resilience with Automatic Fallbacks & Load Balancing.
- Efficiency with Semantic Caching.
- Advanced tool use via Model Context Protocol (MCP).
- Governance and security with Usage Controls, SSO, Observability, and Vault Support.
- Minimal code change with Drop-in Replacement.
Bifrost’s llm gateway and model router ensure the system remains responsive and cost-aware while maintaining quality via tracing and eval integrations, critical for agent observability, rag observability, and voice monitoring use cases.
Implementation Guide: From Zero to Glass Box
Step 1: Instrument the Workflow
- Add agent tracing and llm tracing for every model call, tool invocation, and branch.
- Version prompts; capture input variables, model parameters, and outputs.
- For RAG, log retrieval queries, top-k results with relevance scores, and the exact context assembled.
Step 2: Establish Evaluations
- Offline: Build curated and synthetic datasets; run llm evals (faithfulness, completeness, grounding, safety) and programmatic checks.
- Online: Attach auto-evaluations to traces in production with cost and latency budgets; apply hallucination detection rules for risky domains.
For practical patterns and metrics, see Maxim’s guide: RAG Evaluation: A Complete Guide for 2025.
Step 3: Configure Monitoring and Alerts
- Quality: Faithfulness score thresholds, context utilization, answer correctness.
- Operations: Latency, token usage, cost ceilings, cache effectiveness.
- Governance: PII / safety signals, jailbreak detection, anomaly rates.
- Create dashboards for cross-functional teams (AI engineering, product, QA) to collaborate on remediation.
Step 4: Govern with Recognized Frameworks
- Align processes to the NIST AI RMF (Govern, Map, Measure, Manage) for systemic trustworthiness: AI Risk Management Framework | NIST.
- For EU deployments, ensure traceability, documentation, and post-market monitoring in line with the EU AI Act: AI Act Overview and Article 72.
- Document your evaluation methodology, incident response, and escalation procedures.
Step 5: Iterate with Simulation + Observability Feedback Loops
- Use simulations to reproduce production issues and validate fixes before redeploying: Agent Simulation & Evaluation.
- Curate datasets from logs; compare versions; continuously improve prompts, retrieval logic, and routing.
Example: Voice Agent Observability, Tracing, and Evals
Consider a customer support voice agent:
- Voice tracing: Log ASR confidence, intents, slot fills, and latency per turn.
- Agent debugging: Trace the agent’s plan, tool calls (CRM lookup, order status), and handoffs.
- RAG tracing: Capture retrieval queries over the knowledge base; evaluate relevance and coverage for policy answers.
- Evals: Run voice evaluation for clarity and correctness; faithfulness checks to ensure responses strictly cite retrieved content; safety evaluators to prevent sensitive PII leakage.
- Monitoring: Alerts on latency spikes, low ASR confidence, repeated human handoffs, and rising hallucination flags.
With Maxim’s observability and evaluators, you can diagnose whether failures stem from ASR, intent resolution, retrieval gaps, or generation hallucinations, then apply targeted fixes.
KPIs That Connect Quality to Operations
Anchor your ai monitoring to a balanced scorecard:
- Quality: Faithfulness, completeness, context utilization, citation accuracy, task success rate.
- Safety: Toxicity/PII flags, jailbreak detection frequency, fairness/bias indicators.
- Operations: Median and tail latency (p95/p99), token usage, per-request cost, cache hit rate, fallback rates.
- Reliability: Error rates, time-to-detect (TTD), mean-time-to-reproduce (MTTR), mean-time-to-recover (MTTR).
These KPIs make model observability actionable, support model monitoring SLAs, and guide routing and caching strategies in your llm gateway.
Final Thoughts
AI observability is the bridge from black-box uncertainty to glass-box clarity. By combining deep tracing, rigorous ai evaluation, and production-grade monitoring, teams can ship reliable, transparent, and cost-efficient AI systems. Maxim AI’s full-stack platform and Bifrost gateway provide the critical building blocks for agent observability, rag monitoring, voice observability, and cross-functional collaboration, so engineering and product can move quickly without sacrificing trust or control.
Start building your glass-box AI with Maxim: Request a live demo or Sign up and get started.


