Datadog MCP Server: Setup, Toolsets, and Governed Access for AI Agents
The Datadog MCP server lets AI agents query logs, metrics, traces, monitors, and incidents. This guide covers Datadog MCP setup, toolsets, and auth, and how to route the server through Bifrost so every client gets scoped tools, managed credentials, and one log of tool calls.
TL;DR
- The Datadog MCP server is a remote MCP endpoint that lets AI clients and agents query Datadog logs, metrics, traces, monitors, incidents, dashboards, and more.
- It exposes a
coretoolset by default and dozens of optional product toolsets, selected with atoolsetsquery parameter or theX-Datadog-MCP-Toolsetsheader. - It authenticates with OAuth or with
DD_API_KEYandDD_APPLICATION_KEYheaders, so access follows the permissions of the user or keys behind each connection. - Connecting every AI client directly spreads keys and full tool access across laptops and agents, with no single record of which tool was called.
- Routing the Datadog MCP server through Bifrost centralizes credentials, filters tools per team or agent, and logs every call; the Bifrost Datadog plugin also sends gateway traces and LLM Observability data back to Datadog.
The Datadog MCP server gives AI coding assistants and agents direct access to production telemetry, which makes it one of the most useful MCP servers for engineering teams and one of the most sensitive. Bifrost, the open-source AI gateway built by Maxim AI, sits between AI clients and the Datadog MCP server so teams can decide which tools each agent sees and keep a record of every call. This guide covers Datadog MCP setup, toolsets, authentication, and a governed rollout through Bifrost.
What Is the Datadog MCP Server?
The Datadog MCP server is a Datadog-managed, remote Model Context Protocol server that exposes Datadog data and actions as tools for AI clients. An agent connected to it can search logs, pull metrics, read traces, list monitors and incidents, and work with notebooks and dashboards, all through natural-language requests that the model turns into tool calls.
Typical Datadog MCP uses:
- Incident triage. Ask an agent to pull recent error logs, related traces, and the monitors that fired for a service.
- Debugging from the editor. A coding agent in Claude Code or Cursor checks production errors for the function it is changing.
- Reporting. Summarize SLO status or incident timelines into a notebook.
- On-call assistants. Internal agents answer "what changed?" questions across metrics, events, and deployments.
Datadog publishes setup instructions for the MCP server for Claude, ChatGPT, Codex, Cursor, VS Code, and other clients.
The Bifrost MCP server directory lists setup guides for other servers teams often pair with it, such as GitHub and Sentry.
Datadog MCP Toolsets and Tools
The Datadog MCP server organizes its tools into toolsets. Only the core toolset is enabled by default, covering logs, metrics, traces, dashboards, monitors, incidents, hosts, services, events, and notebooks. Product toolsets such as APM, Alerting, Security, Database Monitoring, Synthetics, and Cloud Cost Management are added by naming them in the connection.
The Datadog MCP tools reference lists more than 400 tools across these toolsets. A few examples from the core set:
| Tool | What it does | Access type |
|---|---|---|
search_datadog_logs |
Searches logs with a query and time range | Read |
get_datadog_metric |
Retrieves metric time series | Read |
get_datadog_trace |
Fetches a distributed trace | Read |
search_datadog_monitors |
Lists monitors and their status | Read |
search_datadog_incidents |
Lists incidents | Read |
create_datadog_notebook |
Creates a notebook | Write |
delete_datadog_notebook |
Deletes a notebook | Write |
Toolsets are selected in two ways:
- Query parameter. Append
?toolsets=apm,llmobsto the endpoint URL, or?toolsets=allfor every generally available toolset. - Header. Send
X-Datadog-MCP-Toolsets: apm,llmobson the connection.
Enabling all gives agents the widest reach but also the largest tool list, which costs context and makes tool selection harder. The guide to how MCP tools work explains why large tool lists matter.
How Datadog MCP Authentication Works
The Datadog MCP server supports two authentication methods: an OAuth login flow, where each user signs in to Datadog in a browser, and API key authentication, where the client sends a Datadog API key and application key as DD_API_KEY and DD_APPLICATION_KEY headers. Either way, tool calls run with the Datadog permissions of the signed-in user or the keys provided.
Practical implications:
- Pick the right site. Each Datadog site has its own endpoint, such as
https://mcp.datadoghq.com/v1/mcpfor US1 andhttps://mcp.datadoghq.eu/v1/mcpfor EU. - Application keys carry permissions. An application key acts with the permissions of the user or service account that created it, so a key from an admin account gives agents admin reach.
- Keys sprawl quickly. If every developer pastes keys into their own client config, revoking or rotating access means finding every copy.
Datadog documents API and application keys and their scopes. Teams that want each engineer to keep their own Datadog identity, without storing keys on laptops, can use per-user credentials at the gateway; the Bifrost MCP authentication overview lists every option.
Direct Connections vs a Gateway
Connecting each AI client directly to the Datadog MCP server is the fastest way to start, but it scales poorly. Every client holds its own keys, sees whatever toolsets it enabled, and logs nothing centrally. Routing through a gateway such as Bifrost keeps one connection to Datadog, scopes tools per team or agent, and records every call.
Figure 1 compares the two setups.
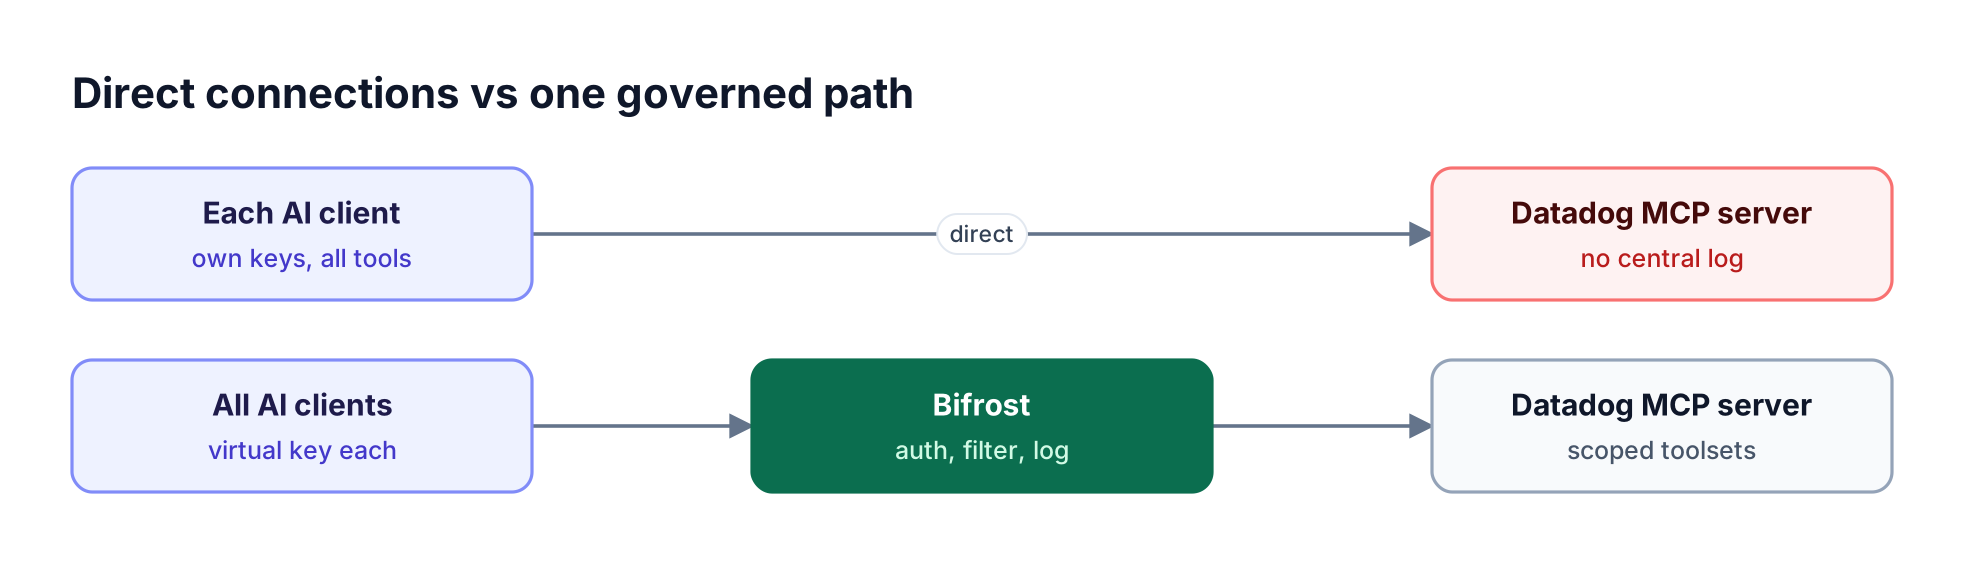
Top: Claude Code, Cursor, and agents each connect straight to the Datadog MCP server with their own keys. Bottom: all clients connect through Bifrost, which holds credentials and filters tools
Figure 1: Direct connections spread Datadog keys and tool access across every client; routing through a gateway keeps credentials, tool filtering, and logs in one place.
| Concern | Direct connection | Through Bifrost |
|---|---|---|
| Credentials | Keys in each client config | Held in Bifrost (encrypted at rest with an encryption key set) or supplied per user |
| Tool access | Whatever toolsets each client enables | Filtered per MCP client, per request, and per virtual key |
| Write tools | Available if the key allows them | Can be removed from the tool list entirely |
| Audit trail | Spread across clients, if kept at all | Every tool call logged alongside the model request that produced it |
| Rotation | Update every client | Update once in Bifrost |
The comparison of MCP gateways vs MCP proxies vs MCP servers covers the architecture, and the risks of ungoverned MCP server access covers what goes wrong without one.
How to Connect the Datadog MCP Server to Bifrost
Connecting the Datadog MCP server to Bifrost takes five steps: pick the endpoint and toolsets, choose an authentication model, register the server as an HTTP MCP client, filter its tools, and attach it to the virtual keys your clients use. After that, every AI client reaches Datadog through the Bifrost MCP gateway instead of connecting on its own.

Five steps in a row: pick the Datadog site endpoint, choose an auth model, register the server in Bifrost, filter tools, then attach it to virtual keys for clients
Figure 2: Five steps take the Datadog MCP server from a raw endpoint to a governed tool set that every AI client reaches through Bifrost.
Step 1: Pick the endpoint and toolsets
Use the endpoint for your Datadog site and add only the toolsets your use case needs. For an incident-triage agent, core plus APM is a sensible start:
<https://mcp.datadoghq.com/v1/mcp?toolsets=core,apm>
Step 2: Choose an authentication model
Bifrost supports several upstream authentication modes for MCP servers. Two fit Datadog well:
- Shared service account. Header authentication attaches one set of Datadog keys to every call. Create the keys on a read-only service account so the scope is explicit.
- Per-engineer keys. Per-user headers let each user submit their own
DD_API_KEYandDD_APPLICATION_KEY, stored encrypted per identity, so tool calls keep each person's Datadog permissions.
Step 3: Register the server in Bifrost
Add the Datadog MCP server as an HTTP client through the Bifrost dashboard (MCP Gateway, then New MCP Server) or the API. With shared headers, the values reference environment variables so keys stay out of config files:
curl -X POST <http://localhost:8080/api/mcp/client> \
  -H "Content-Type: application/json" \
  -d '{
    "name": "datadog",
    "connection_type": "http",
    "connection_string": "<https://mcp.datadoghq.com/v1/mcp?toolsets=core,apm>",
    "auth_type": "headers",
    "headers": {
      "DD_API_KEY": "env.DD_API_KEY",
      "DD_APPLICATION_KEY": "env.DD_APPLICATION_KEY"
    },
    "tools_to_execute": ["*"]
  }'
The MCP server connection guide covers the other connection options, including session stickiness for HTTP clients.
Step 4: Filter the tools
Replace the * in tools_to_execute with an explicit list, starting read-only:
"tools_to_execute": [
  "search_datadog_logs",
  "get_datadog_metric",
  "get_datadog_trace",
  "search_datadog_monitors",
  "search_datadog_incidents"
]
Tool filtering also applies per request and per virtual key, and a tool must pass every applicable filter to be visible.
Step 5: Attach it to virtual keys and connect clients
Give each team or agent a virtual key with the Datadog tools it needs, or bundle Datadog tools with other servers in a Virtual MCP served at its own /mcp/<slug> endpoint. Clients then connect to Bifrost, for example from Claude Code:
claude mcp add --transport http bifrost <https://bifrost.example.com/mcp> \
  --header "x-bf-vk: sk-bf-your-virtual-key"
Gateway authentication also supports browser-based OAuth 2.1 for interactive clients.
Governing Datadog MCP Access
Governing Datadog MCP access means deciding which agents can read which data, keeping write actions behind deliberate approval, and being able to show what every agent did. Production telemetry often contains customer identifiers, internal hostnames, and sometimes secrets in log lines, so the defaults matter.
Controls to set in Bifrost:
- Read-only by default. Expose search and get tools; add create, edit, and delete tools only for agents that need them.
- Scope by team. An SRE agent can see APM and incident tools; a coding agent may only need logs and traces for its own services.
- Explicit execution. Tool calls from models are suggestions by default, and agent mode auto-execution has to be configured per tool.
- Role-based administration. RBAC and access profiles in Bifrost Enterprise control who can change MCP servers, keys, and policies.
Content checks on tool traffic:
- Secrets in results. Secrets detection can flag or redact credentials that appear in log lines returned to the model.
- MCP guardrails. The post on MCP guardrails in Bifrost covers rules that run on tool inputs and outputs.
The guide to MCP server governance best practices covers policy design across servers.
Sending Bifrost Telemetry Back to Datadog
Datadog also works in the other direction. The Bifrost Datadog plugin sends gateway telemetry into Datadog, so the same platform that agents query through the MCP server also records every model and tool request the gateway handles. Teams get Datadog MCP access for agents and Datadog visibility into the agents themselves.
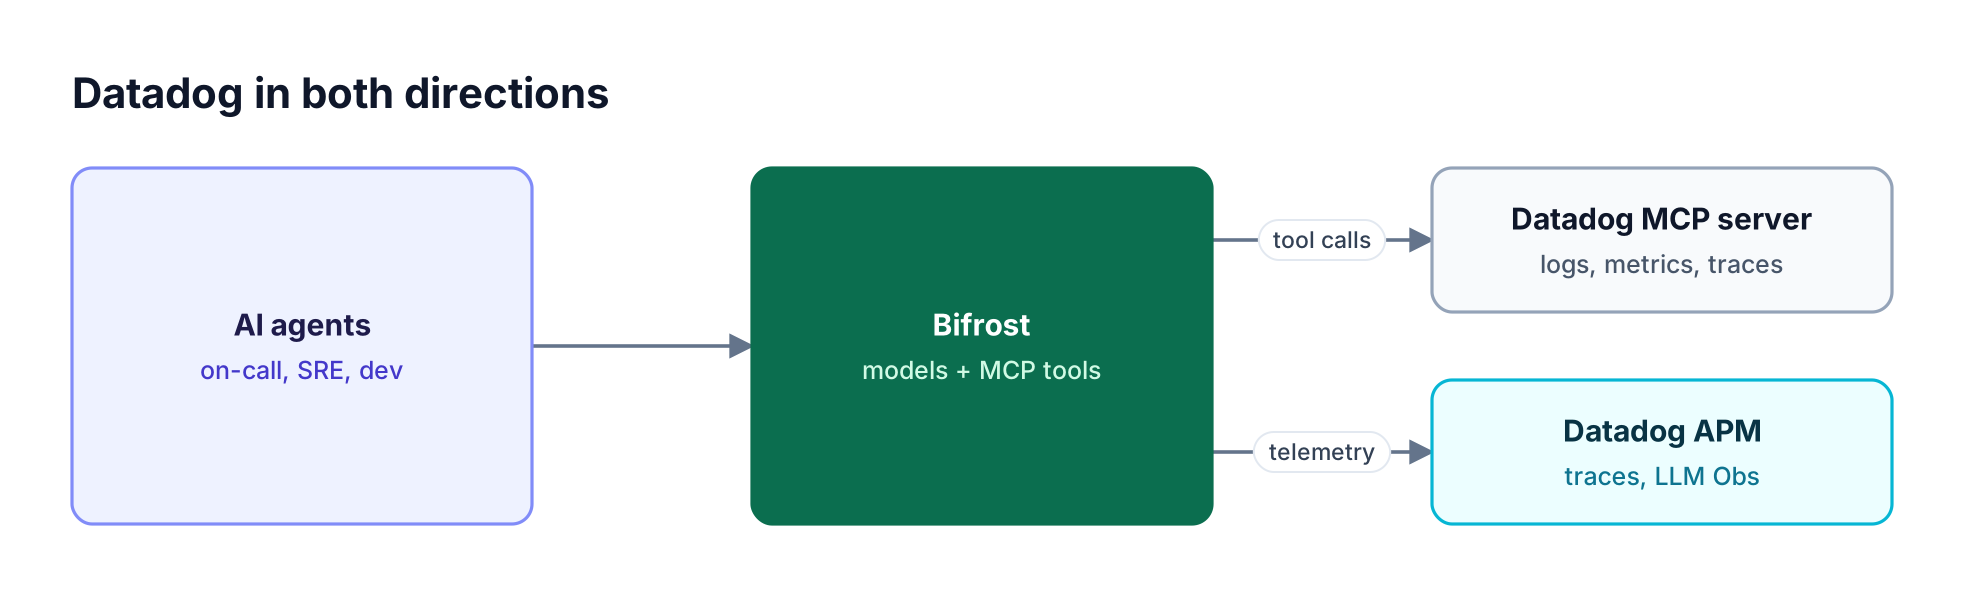
Agents query Datadog through Bifrost and the Datadog MCP server, while the Bifrost Datadog plugin sends APM traces, LLM Observability spans, and metrics back into Datadog
Figure 3: Agents read from Datadog through the MCP server, and the Datadog plugin writes gateway traces and LLM Observability data back, so the same platform sees both sides.
What the Bifrost Datadog integration sends:
- APM traces through dd-trace-go v2, with W3C Trace Context for end-to-end request visibility.
- LLM Observability spans through the native Datadog LLM Observability integration.
- Metrics through DogStatsD or the Datadog Metrics API.
It runs in agent mode, through a local Datadog Agent, or agentless mode, sending directly to Datadog APIs with an API key. Options such as disable_content_logging drop message content from exported spans when payloads should not leave the gateway. Teams on other stacks can use OpenTelemetry export instead.
Auditing Datadog Tool Calls
Every Datadog tool call that passes through Bifrost is logged with the model request that produced it, the virtual key that made it, and the result. That record answers the questions security and platform teams ask after an incident: which agent queried which data, when, and on whose behalf.
What the record supports:
- Investigations. Trace a surprising notebook edit or monitor change back to the agent and user.
- Access reviews. See which teams actually use which Datadog tools before widening or narrowing scopes.
- Cost attribution. Tool calls sit next to the token cost of the model calls that triggered them.
Bifrost request logs hold the per-request data, and audit logs track administrative changes such as adding a server or editing a tool filter.
The guide to auditing every AI tool call and the post on MCP audit logging requirements cover retention and compliance.
Datadog MCP Best Practices
A Datadog MCP rollout goes well when access starts narrow and widens with evidence. The same few practices apply whether the first users are a handful of SREs in Claude Code or a fleet of internal agents.
- Start with
coreand add product toolsets only when a use case needs them. - Use a dedicated service account with read-only permissions for shared keys.
- Keep keys out of client configs; store them in Bifrost as environment-variable references or use per-user headers.
- Separate read and write. Put write tools on a different virtual key or Virtual MCP that only specific agents receive.
- Review usage monthly from tool-call logs and remove tools nobody uses.
- Watch context size. Large toolsets inflate prompts; Code Mode keeps tool definitions out of context for multi-step work.
For more on running many servers side by side, see remote MCP server gateways and the Atlassian MCP server guide.
Frequently Asked Questions
What is the Datadog MCP server?
The Datadog MCP server is a remote MCP endpoint managed by Datadog that exposes logs, metrics, traces, monitors, incidents, dashboards, notebooks, and product-specific data as tools for AI clients and agents. Clients such as Claude Code, Cursor, and custom agents connect to it with OAuth or API and application keys.
How do I set up Datadog MCP in Claude Code?
You can add the Datadog endpoint for your site directly in Claude Code, or connect Claude Code to Bifrost with a virtual key and let Bifrost hold the Datadog connection. The second option keeps keys off developer machines and applies per-key tool filters and logging to every call.
What toolsets does the Datadog MCP server support?
The core toolset is enabled by default and covers logs, metrics, traces, dashboards, monitors, incidents, hosts, services, events, and notebooks. Product toolsets, including APM, Alerting, Security, Database Monitoring, Synthetics, and Cloud Cost Management, are added with the toolsets query parameter or the X-Datadog-MCP-Toolsets header.
Is the Datadog MCP server safe for production data?
It runs with the permissions of the user or keys behind each connection, so safety depends on scoping. Use read-only service accounts, enable only needed toolsets, keep write tools separate, and log every call. A gateway such as Bifrost centralizes those controls.
Can each engineer use their own Datadog permissions through Bifrost?
Yes. With per-user headers, each user submits their own Datadog API and application keys once, Bifrost stores them encrypted per identity, and tool calls run with that user's Datadog permissions. The per-user headers guide covers setup.
Does Bifrost send data to Datadog?
Yes, if you enable the Datadog plugin. It sends APM traces, LLM Observability spans, and metrics for requests that pass through Bifrost, in agent or agentless mode, with options to drop message content from exported spans.
Give Agents Datadog Access Without Losing Control
The Datadog MCP server puts production telemetry in reach of every AI client, which is exactly why access should run through one governed path. Bifrost holds the Datadog connection, filters tools per team and agent, logs every call, and sends gateway telemetry back to Datadog. To see it with your observability stack, book a demo with the Bifrost team.