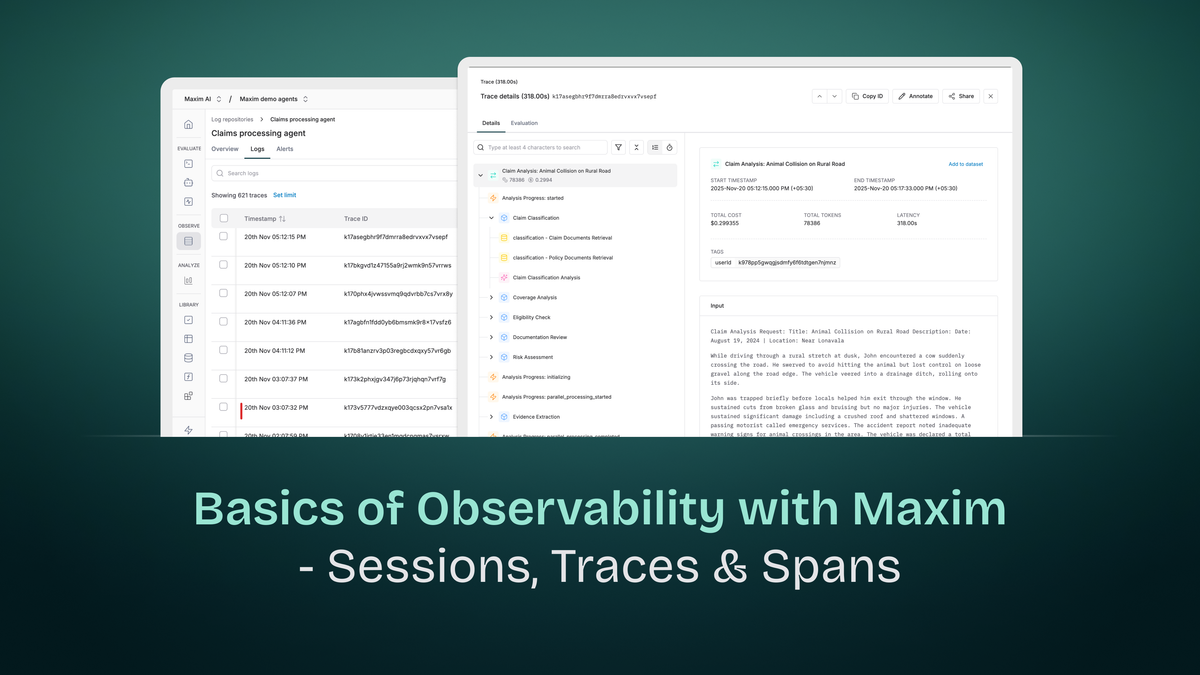
Basics of AI Observability: Sessions, Traces, and Spans
Observability in AI applications differs fundamentally from traditional application monitoring. While conventional systems deal with deterministic request-response cycles, AI applications involve multi-turn conversations, complex reasoning chains, multiple model invocations, and retrieval operations - all of which need visibility for debugging, optimization, and understanding system behavior.
Maxim's observability platform extends distributed tracing principles to address AI-specific challenges. At its core are three hierarchical constructs: Sessions, Traces, and Spans. Understanding these components and their relationships is essential for effectively monitoring and troubleshooting AI applications.
The Hierarchy: Sessions → Traces → Spans
AI observability follows a nested structure where each level captures different granularities of interaction:
Session (Entire conversation)
  ├── Trace 1 (First user query)
  │     ├── Span: Intent detection
  │     ├── Span: Context retrieval
  │     └── Span: Response generation
  ├── Trace 2 (Follow-up query)
  │     ├── Span: Query refinement
  │     ├── Span: Database query
  │     └── Span: Response synthesis
  └── Trace 3 (Final query)
        ├── Span: Clarification check
        └── Span: Final response
This hierarchy allows you to understand interactions at multiple levels: the entire conversation (session), individual requests (traces), and specific operations within requests (spans).
Sessions: Capturing Multi-Turn Interactions
What is a Session?
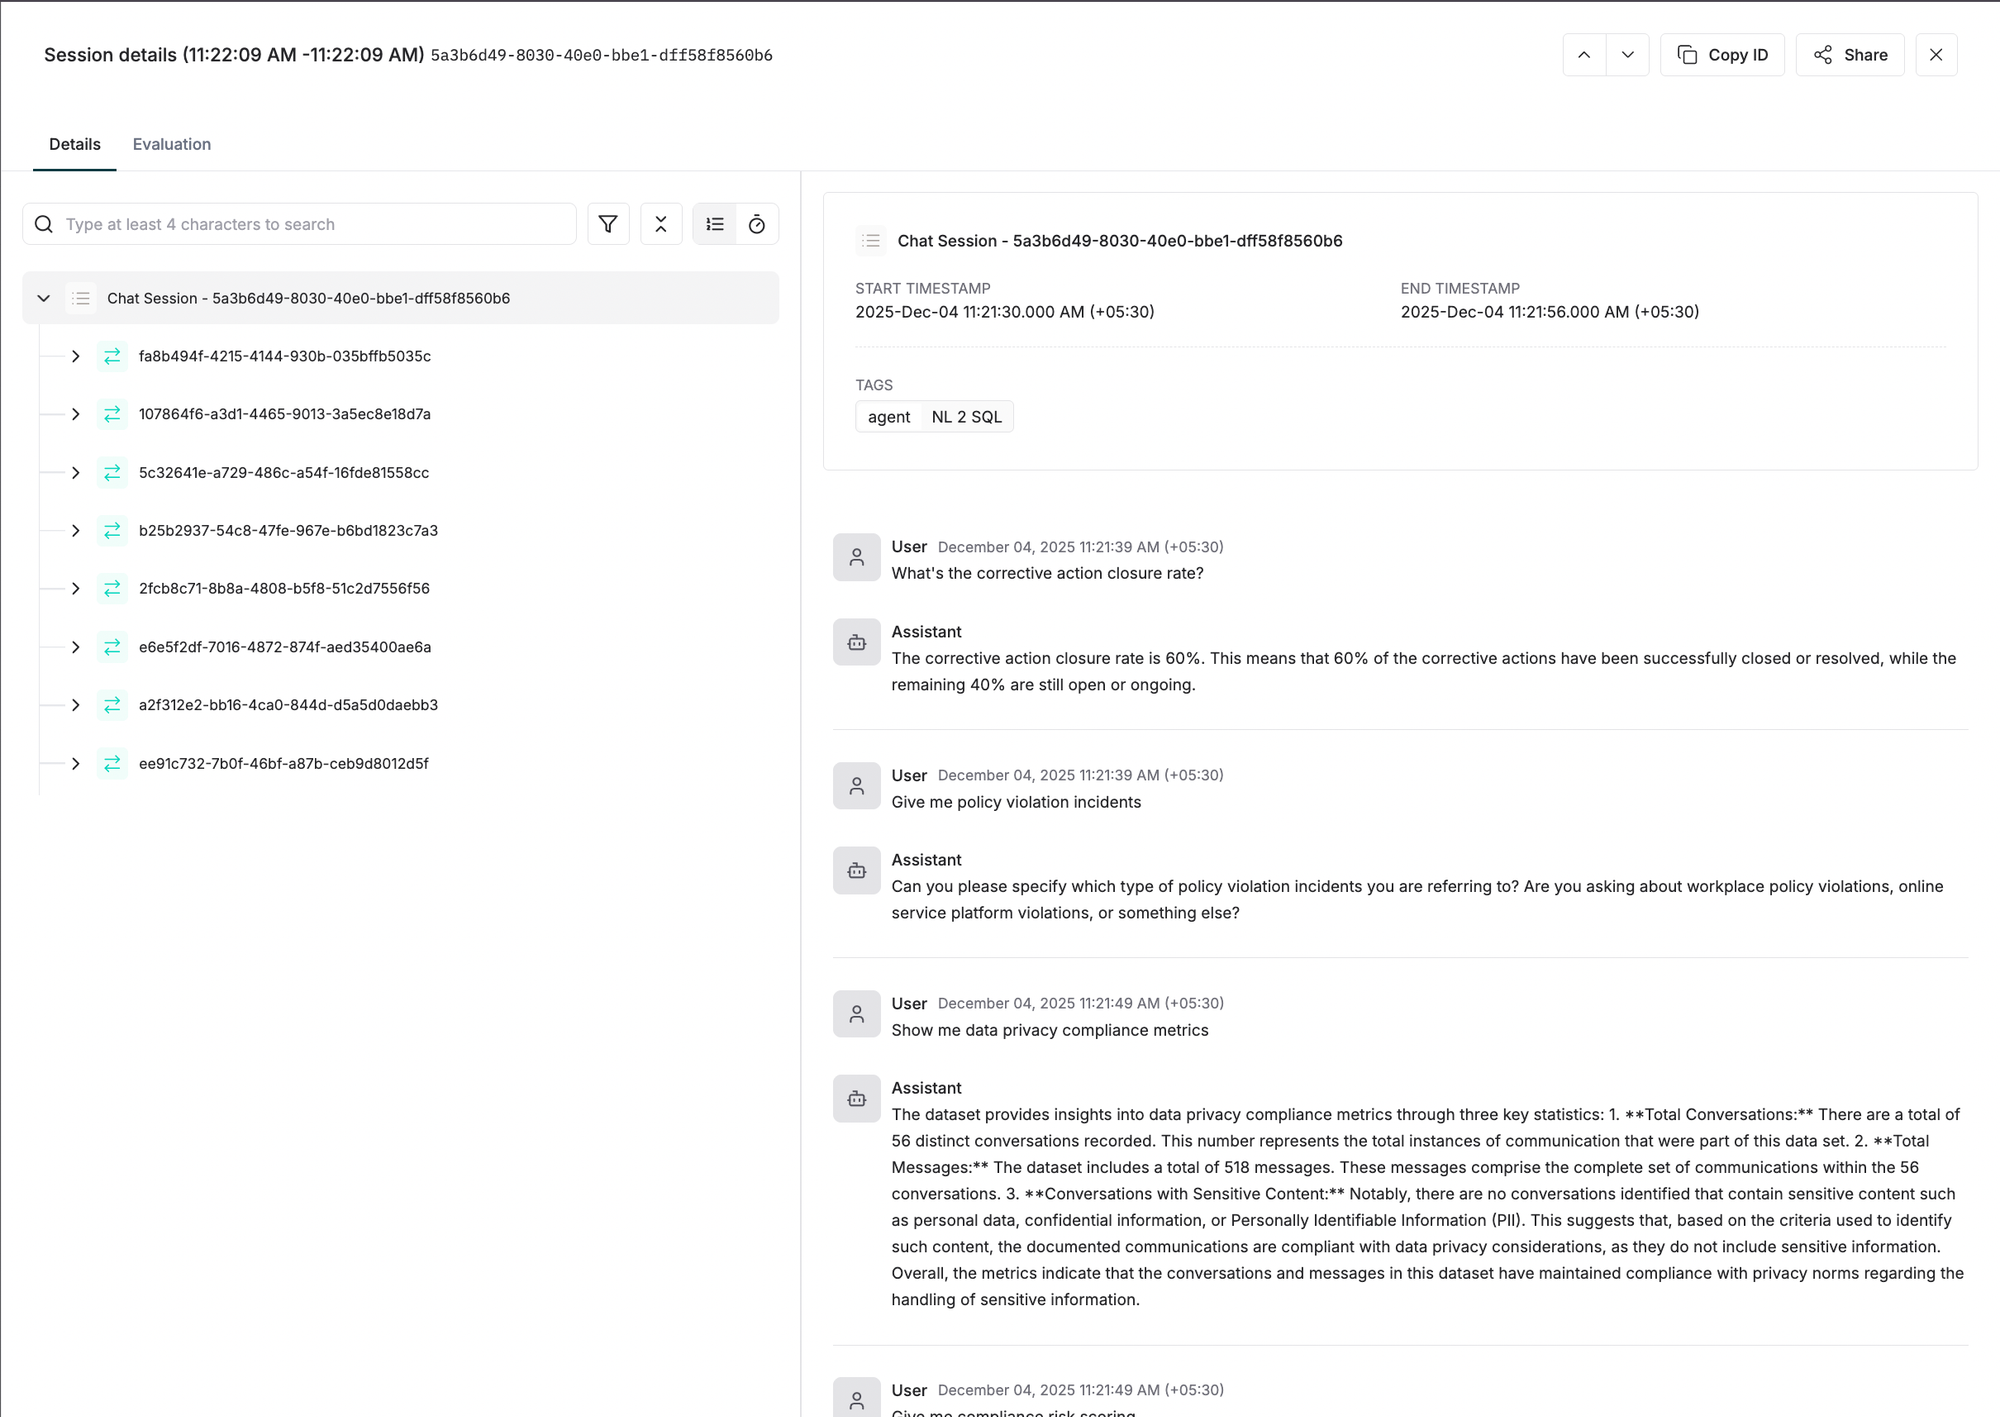
A Session is the top-level entity that captures all multi-turn interactions between a user and your AI system. In a chatbot, for example, a session represents the entire conversation from the moment a user starts interacting until they explicitly end or the session times out.
Session Lifecycle
Sessions persist across multiple interactions and remain active until explicitly closed. This persistence is critical for AI applications where context accumulates over time:
Session Start: Created when a user initiates their first interaction.
Active State: Remains open as the user continues interacting. New traces are added to the session with each query-response cycle.
Session End: Explicitly closed when the conversation terminates, the user logs out, or after a timeout period.
Why Sessions Matter for AI Applications
Context Continuity: AI conversations build context over multiple turns. A user might ask "What's the weather in Paris?" followed by "How about tomorrow?" The second query only makes sense within the session context.
User Journey Analysis: Sessions reveal how users interact with your AI over time. Are they satisfied after one exchange, or do they need multiple follow-ups? Do they abandon conversations mid-flow?
Cost Attribution: Tracking token usage and costs at the session level shows the total expense of serving a user conversation, not just individual queries.
Debugging Multi-Turn Issues: When a conversation breaks down, sessions let you trace back through previous interactions to identify where understanding diverged.
Session Properties
While sessions primarily act as containers, they establish identity for the entire interaction:
Session Identifier: A unique ID that links all related traces. This could be a user session token, conversation ID, or UUID generated at conversation start.
Temporal Boundaries: Start and end timestamps that define the conversation duration.
Aggregated Metrics: Total tokens used, cumulative cost, overall latency, and user feedback across all traces in the session.
Traces: Individual Request-Response Cycles
What is a Trace?
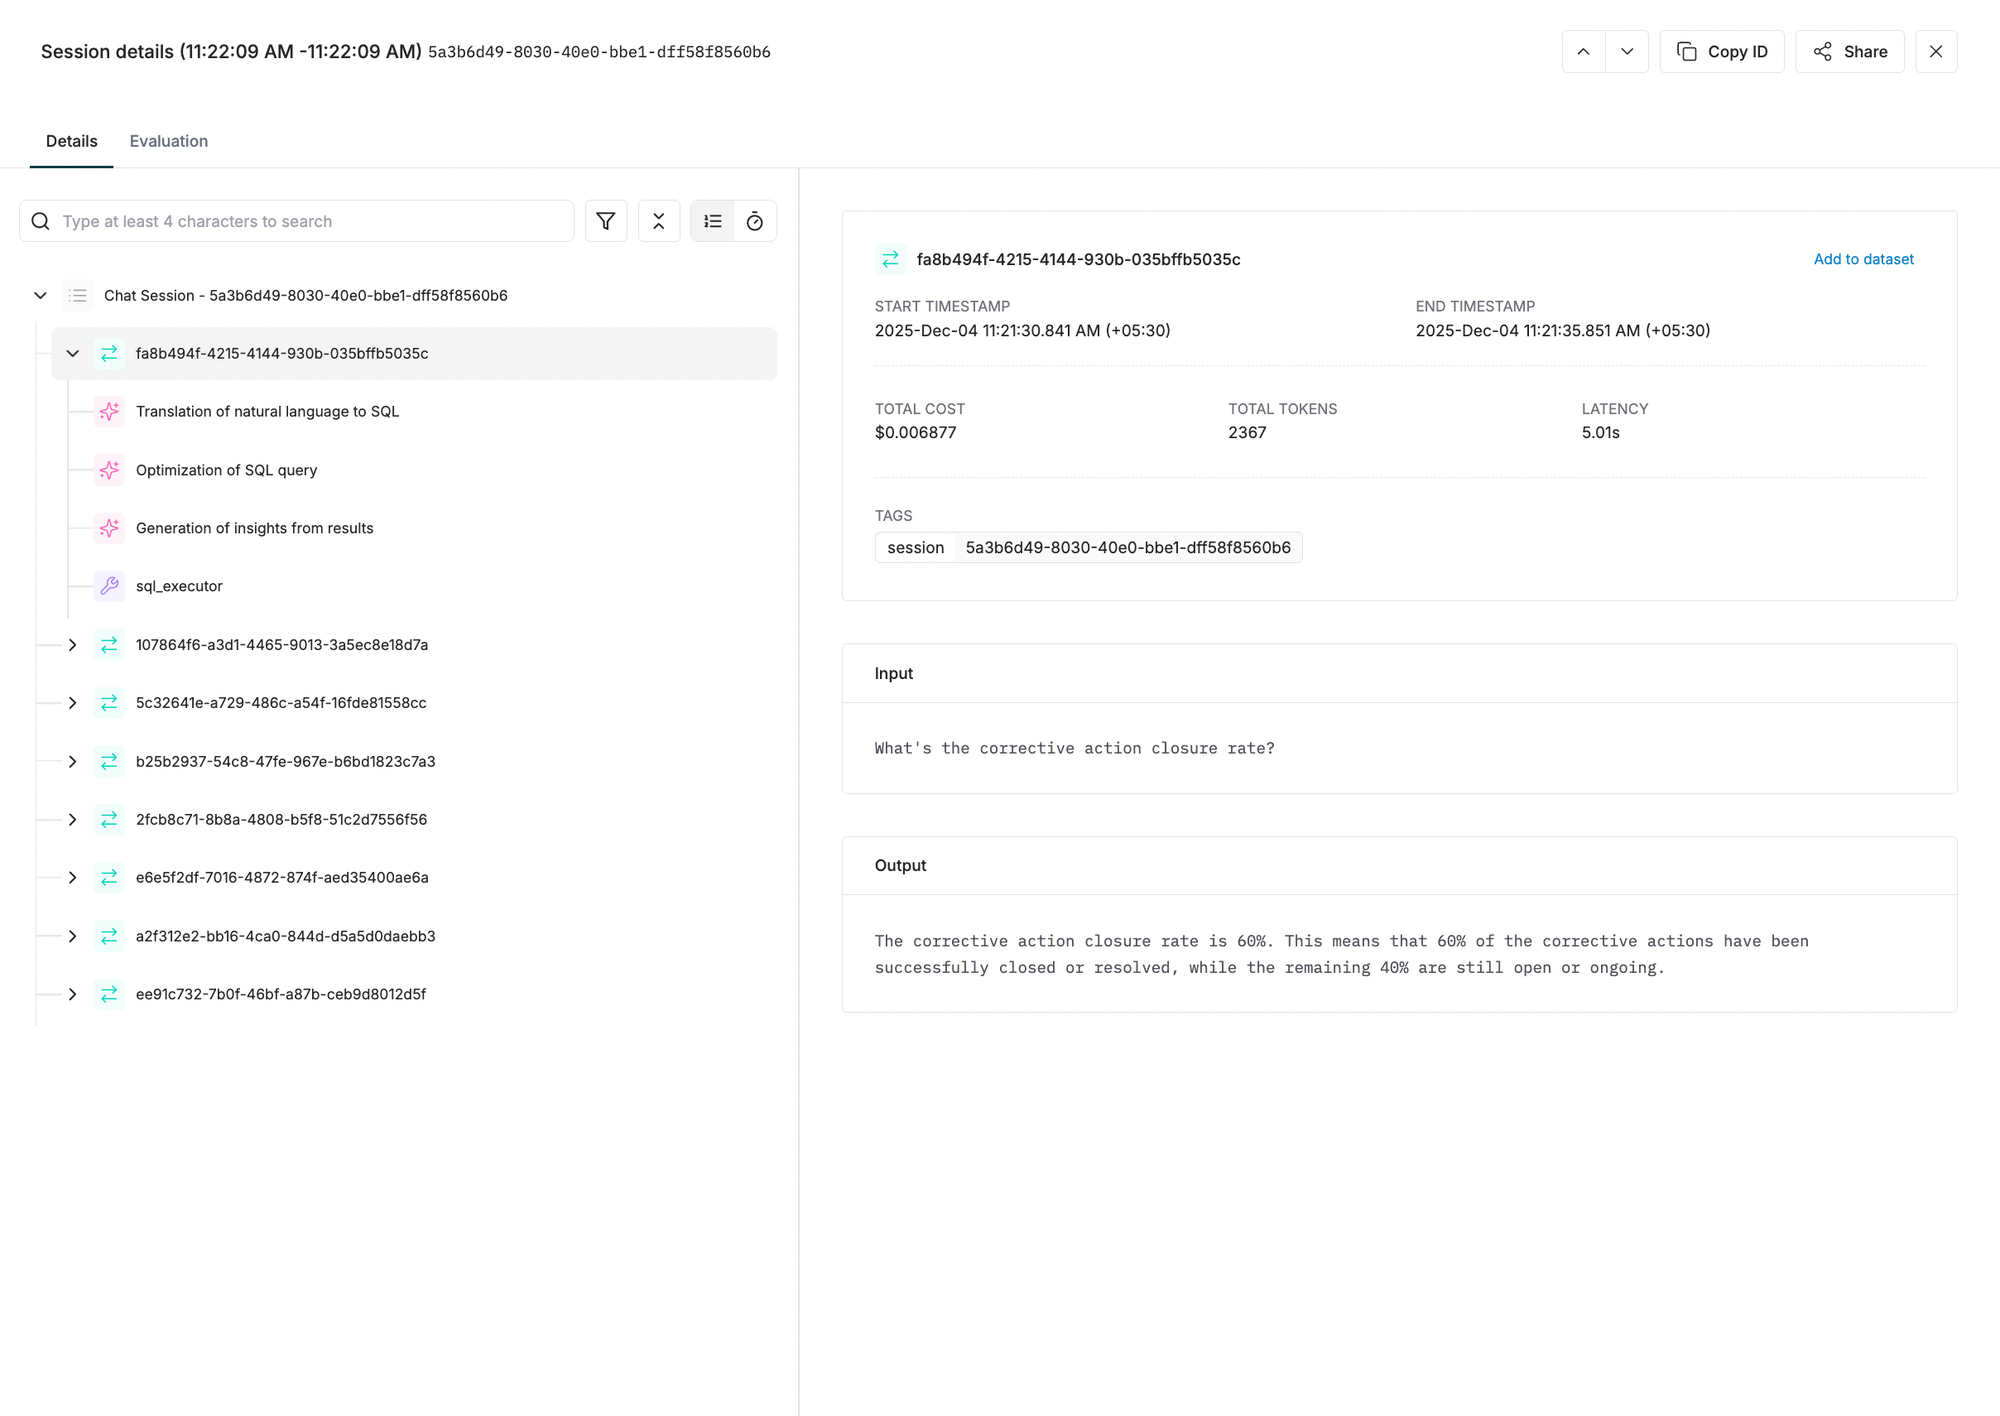
A Trace represents the complete processing of a single request through your AI system, including all operations between receiving the query and returning the response. In distributed tracing terminology, it's the end-to-end journey of one user interaction.
Trace Composition
Each trace encompasses everything that happens to process one request:
Request Entry: The moment the user's query enters your system.
Processing Pipeline: All operations executed to generate the response - intent classification, context retrieval, model invocations, tool calls, result synthesis.
Response Exit: When the final answer returns to the user.
A trace is composed of spans (detailed below) that represent individual operations within this pipeline.
Trace Properties
Traces capture both identifying information and operational metrics:
Core Properties
id: Unique identifier for the trace. Often maps to your request ID or a UUID generated per request. This must be unique within the log repository.
name (optional): Human-readable name describing the operation, typically matching your API endpoint (e.g., chatQuery, documentSummary, codeGeneration).
tags (optional): Key-value pairs for filtering and categorization on the dashboard. Examples:
environment: productionuser_tier: premiumfeature: code_reviewversion: 2.1.0
Tags have no hard limit, but fewer tags improve search performance. Use tags strategically for common filtering scenarios.
input (optional): The user's prompt or query. This is what triggered the trace.
output (optional): The final response returned to the user. This is the end result of all processing.
Computed Metrics
Beyond properties you explicitly set, Maxim computes trace-level metrics:
Tokens: Total token count across all LLM calls within the trace.
Cost: Cumulative cost in USD for all model invocations.
Latency: Total time from request entry to response exit, measured in milliseconds.
Error Status: Whether any operation within the trace failed.
User Feedback: If collected, the user's rating or feedback on the response quality.
Trace as the Unit of Analysis
Traces are the primary unit for understanding system behavior:
Performance Analysis: "Which API endpoints have the highest latency?" Analyze traces grouped by name.
Cost Monitoring: "What's the average cost per request for our summarization feature?" Aggregate cost metrics across traces with name: documentSummary.
Quality Assessment: "What's the user satisfaction rate for code generation requests?" Filter traces by name and examine user feedback.
Error Investigation: "Why did requests fail between 2 PM and 3 PM?" Query traces with error status in that timeframe.
Trace Structure Example
A typical trace can be created in Python like this:
from maxim.logger import TraceConfig

trace = logger.trace({
  "id":"trace-id", # Unique ID of the trace
  "name":"user-query",
})

trace.set_input("Hello, how are you?")
trace.set_output("I'm fine, thank you!")
trace.end()
This trace would contain multiple spans representing the operations executed to generate the response.
Spans: Logical Units of Work
What is a Span?
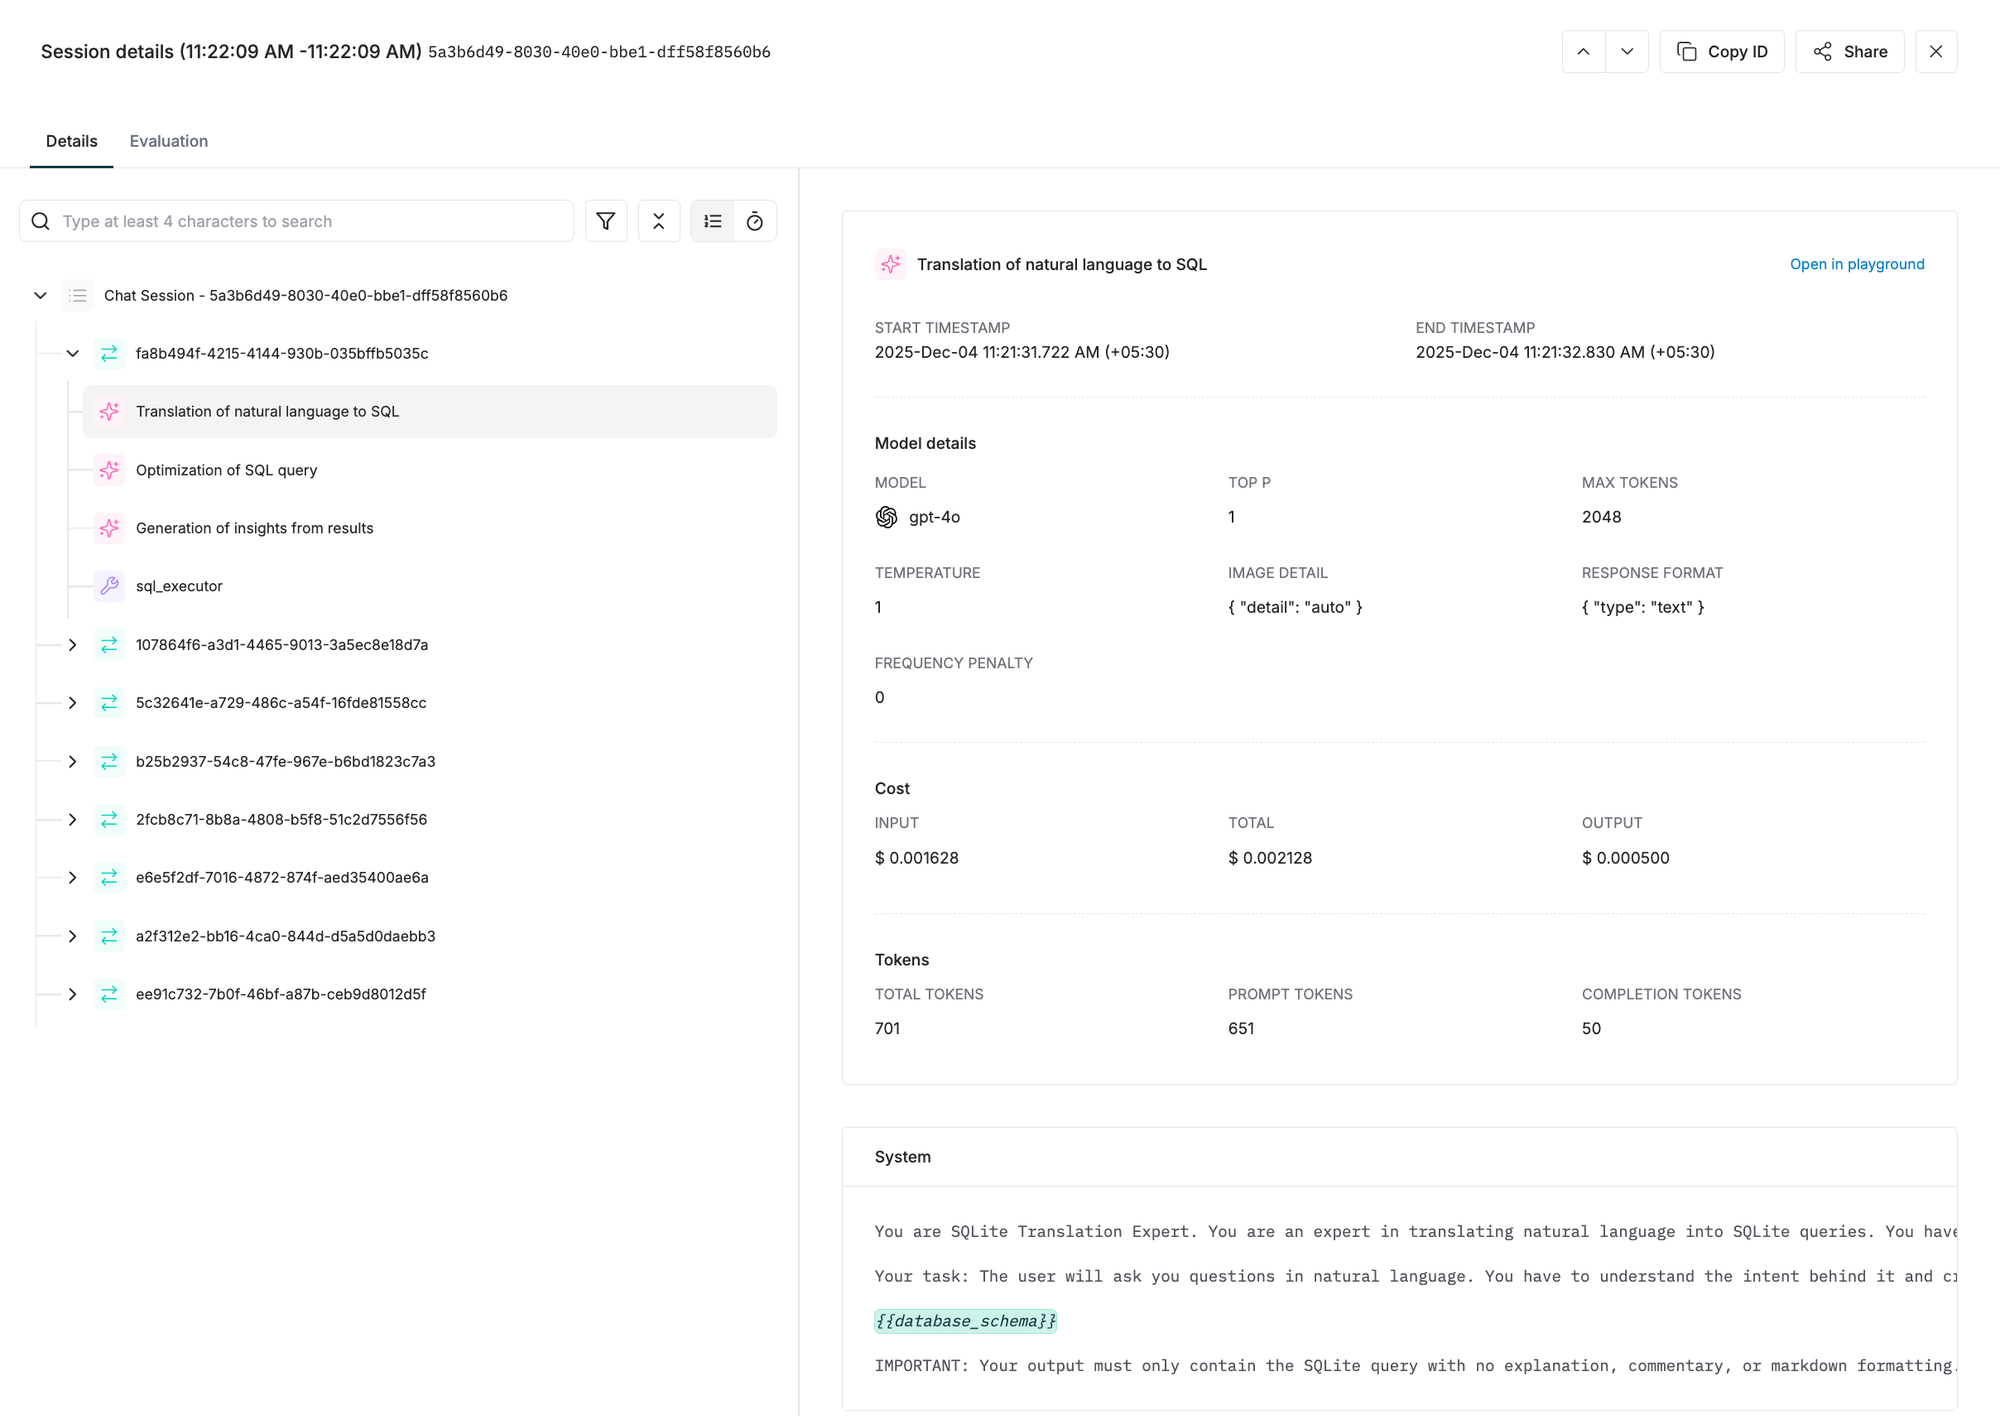
Spans are the fundamental building blocks of distributed tracing. A single trace consists of a series of spans representing logical units of work. Each span captures a discrete operation within the request processing pipeline.
In AI applications, spans typically represent:
- Intent Detection: Classifying what the user wants
- Context Retrieval: Fetching relevant information from a knowledge base
- Model Invocation: Calling an LLM to generate responses
- Tool Execution: Running external functions or APIs
- Result Processing: Formatting or post-processing model outputs
Span Hierarchy
Spans form a tree structure where spans can have child spans (subspans). This hierarchy models the logical flow of operations:
Root Span: Process user query
  ├── Child Span: Validate input
  ├── Child Span: Retrieve context
  │     ├── Grandchild Span: Query vector DB
  │     └── Grandchild Span: Rerank results
  ├── Child Span: Generate response
  │     ├── Grandchild Span: LLM call (intent detection)
  │     └── Grandchild Span: LLM call (response generation)
  └── Child Span: Format output
This nesting allows you to understand not just what operations occurred, but their relationships and dependencies.
Span Properties
id: Unique identifier for the span. Must be unique across all elements in the trace. Duplicate IDs cause data overwriting.
name: Descriptive name for the operation (e.g., intent_detection, context_retrieval, llm_call).
tags: Span-specific tags for filtering and analysis. These are separate from trace-level tags and allow fine-grained categorization of operations.
spanId: The parent span ID. This establishes the hierarchical relationship. When using Maxim's SDK, this is automatically set when calling trace.span({}).
Why Spans Matter
Spans provide the granularity needed to understand performance bottlenecks and failure points:
Performance Profiling: "Which operation is slowest in my pipeline?" Examine span durations to identify bottlenecks - perhaps context retrieval takes 2 seconds while the LLM call takes 500ms.
Error Isolation: "Where did this request fail?" If a trace has an error, spans show exactly which operation failed. Did the vector database timeout? Did the model refuse to respond?
Workflow Understanding: "How does my system actually work?" Span hierarchies visualize the actual execution flow, revealing patterns you might not have documented.
Optimization Targets: "What should I optimize first?" Span metrics guide optimization efforts. If 80% of latency comes from context retrieval spans, that's where to focus.
Creating and Nesting Spans
Spans are created within traces and can be nested to arbitrary depth:
trace = logger.trace({"id": "trace-id"})

span-1 = trace.span({
    "id":"span-id",
    "name":"customer-support--classify-question"
})

span-2 = logger.trace_add_span("trace-id", {
    "id":"span-id",
    "name":"customer-support--classify-question"
})
Span Granularity Considerations
How granular should spans be? There's a trade-off:
Too Coarse: A single span for "generate_response" that includes retrieval, LLM call, and formatting doesn't provide insight into which operation is slow.
Too Fine: Creating spans for every minor operation (e.g., "parse JSON", "validate field", "log debug message") creates noise and storage overhead.
Recommended Approach: Create spans for operations that:
- Have meaningful latency (>50ms typically)
- Can fail independently
- Represent logical workflow steps
- Have distinct cost implications (e.g., model calls)
For AI applications, typical span granularity includes:
- Each LLM call
- Each retrieval operation
- Each tool invocation
- Each major preprocessing or postprocessing step
Putting It Together: A Complete Example
Consider a RAG (Retrieval Augmented Generation) chatbot processing a user query. Here's how Sessions, Traces, and Spans work together:
Session Level
A user starts a conversation about a codebase:
Session ID: session_789
Duration: 15 minutes
Total Traces: 5
Total Cost: $0.23
User Feedback: Positive
Trace Level
The third query in this session asks about a specific function:
Trace ID: trace_3
Name: code_explanation
Session: session_789
Input: "How does the authentication middleware work?"
Output: "The authentication middleware validates JWT tokens..."
Tokens: 2,450
Cost: $0.05
Latency: 3,200ms
Tags: {environment: production, feature: code_chat, language: python}
Span Level
This trace contains multiple spans showing the processing pipeline:
Span 1 (Root): process_query
  Duration: 3,200ms

  Span 1.1: validate_input
    Duration: 50ms
    Tags: {validator: schema_check}

  Span 1.2: retrieve_context
    Duration: 1,800ms
    Tags: {database: weaviate, chunks: 10}

    Span 1.2.1: query_vector_db
      Duration: 1,200ms
      Tags: {collection: codebase_embeddings}

    Span 1.2.2: rerank_results
      Duration: 600ms
      Tags: {model: cohere-rerank}

  Span 1.3: generate_response
    Duration: 1,300ms
    Tags: {model: gpt-4}

    Span 1.3.1: llm_call
      Duration: 1,250ms
      Tags: {prompt_tokens: 1800, completion_tokens: 650}

  Span 1.4: format_output
    Duration: 50ms
    Tags: {formatter: markdown}
From this hierarchical view, you can immediately see:
- The trace took 3.2 seconds total
- Context retrieval (1.8s) was the slowest operation
- Within retrieval, vector DB query (1.2s) was the bottleneck
- The LLM call (1.3s) was relatively fast
- Input validation and output formatting were negligible (<100ms combined)
Analysis Insights
Session Analysis: Over the 5-trace session, you could identify if this user's satisfaction improved as context accumulated, or if later queries became more expensive.
Trace Analysis: Comparing this trace to others tagged with feature: code_chat, you could determine if authentication-related queries are typically slower than others.
Span Analysis: The retrieval bottleneck suggests optimization opportunities - perhaps caching vector embeddings, using approximate nearest neighbor search, or pre-fetching likely queries.
Specialized Components Within Spans
While Sessions, Traces, and Spans form the core hierarchy, Maxim provides specialized components that exist within spans to capture AI-specific operations:
Generation
Represents a single LLM call. Multiple generations can exist within a trace/span. Captures model, messages, parameters, and results using OpenAI's standard structure.
Retrieval
Represents a knowledge base or vector database query in RAG workflows. Captures the input query and the array of retrieved chunks.
Tool Call
Represents external system or service calls made based on LLM responses. Captures tool name, arguments, and results.
Event
Marks significant points within a span recording instantaneous occurrences like "user_interrupted", "cache_hit", or "fallback_triggered".
These specialized components provide AI-specific detail while maintaining the Session → Trace → Span hierarchy.
Next Steps
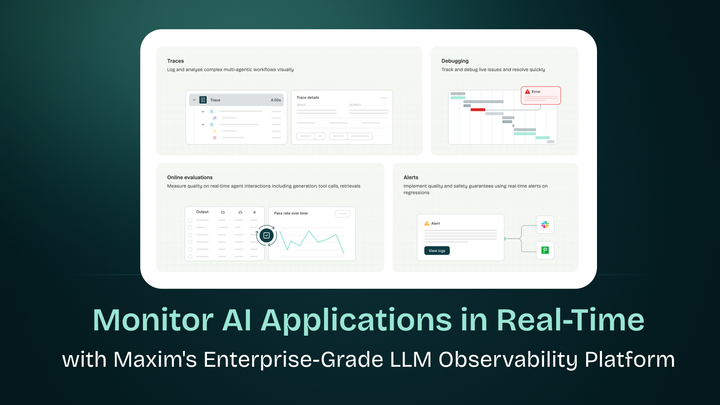
- Now you have a clear idea about Sessions, Traces & Spans, you can go ahead & give this blog a read which talks about Monitor AI Applications in Real-Time with Maxim's Enterprise-Grade LLM Observability Platform. This blog throws more light on end to end Agent Observability.
- To get started with integrating Maxim Observability into your AI Application using maxim-py SDK, you can check out these docs - Tracing via SDK
Conclusion
Sessions, Traces, and Spans form a powerful abstraction for understanding AI application behavior. Sessions capture the full context of multi-turn interactions. Traces represent individual request-response cycles with aggregated metrics. Spans break down operations into observable units revealing where time is spent and where failures occur.
This hierarchical model extends distributed tracing principles to AI's unique challenges - multi-turn conversations, complex reasoning chains, expensive model invocations, and retrieval operations. By structuring observability around these three core components, you gain the visibility needed to debug issues, optimize performance, control costs, and ultimately build better AI applications.
The key is consistency: establish clear session boundaries, use meaningful trace names, create logical span hierarchies, and leverage tags for analysis. With this foundation, observability becomes a powerful tool for understanding not just how your system performs, but how users actually interact with your AI - turning telemetry into actionable insights.