Beyond latency-based routing: Adaptive load balancing in Bifrost
Madhu Shantan
May 06, 2026 · 6 min read
Most teams running multi-provider LLM stacks have moved past pure round-robin for traffic distribution across providers and API keys. They've adopted latency-based routing: measure response times, penalise slow backends, shift traffic toward the fast ones. The approach is reasonable, but it has a failure mode that's easy to miss until you're debugging a production incident.
A 6-second response from your LLM provider can be either fast or slow, and a flat latency threshold has no way to tell which without knowing the request that produced it. 6 seconds for an 8,000-token completion is great, 6 seconds for a 200-token completion is broken. A routing layer that doesn't know the difference will penalise a provider for doing its job well on a large request, and let a genuinely degraded provider through on a small one.
Beyond latency, every backend in front of an LLM gateway has its own rate limits, often by tier, often opaque, often shifting through the day. Failures tend to be transient: a 30-second 5xx blip during a deploy, or a per-minute rate window that resets in 60 seconds. Static weights and health-check ejection cover the obvious cases, but they leave a gap. The moment something goes wrong, your config is exactly wrong, and the only way back is a human with a YAML file.
What you actually want is a load balancer that observes outcomes, learns what normal looks like per route, and shifts traffic on its own when things change - a load balancer that reads the room, not just one that counts. That's what Bifrost does with its adaptive load balancing feature.
Two decisions, every request
For each incoming request, Bifrost makes two routing decisions in sequence:
- Provider - of the providers whose model catalog serves the requested model, which one?
- Key - among that provider's enabled keys, which one?
Both decisions are made the same way. Each candidate (provider × model, or provider × model × key) carries a dynamic weight between 1 and 1000 that is recomputed every 5 seconds based on real-time behaviour. Higher weight means more traffic. Selection uses weighted-random with jitter rather than a deterministic max.
What "reads the room" actually looks like
Four scoring components, weighted and combined:
Score = (P_error × 0.5) + (P_latency × 0.2) + (P_util × 0.05) − M_momentum
When a route is healthy or degraded, the error and utilization terms drive routing; when it's recovering, momentum dominates. The combined score is clamped at zero before being inverted into a weight using:
Weight = W_min + (1 − Score) × (W_max − W_min)
A recovering route with strong recent success can therefore overtake a degraded one through the score alone, without waiting for a state transition.
Error penalty. A time-decayed blend of recent error rates. Most of the penalty fades within the first 30 seconds after the last error, then decays exponentially. The penalty is capped, so it never drives a route's weight all the way to zero - the system keeps sending occasional probes through even its worst-performing routes. The reason is the thundering-herd problem: if you exclude any key with errors entirely, no traffic finds it the moment it recovers because nobody is sending probes. A floor keeps probes flowing.
Latency score (MV-TACOS). The acronym stands for the multi-variate token-aware online scoring model, and it addresses the 6-seconds-fast-or-slow problem that we were referring to above.
Rather than comparing raw latency against a flat threshold, MV-TACOS learns a per-route latency baseline fitted to the actual token shape of each request, and penalises responses that fall meaningfully above that baseline. The "MV" matters because input and output tokens contribute differently to latency in autoregressive models, and the model accounts for that as requests stream through. The model also has cold-start protection, so a quiet route doesn't generate large penalties from a handful of outliers.
Most gateways still rely on a flat latency threshold - anything above 5 seconds is bad - and end up either over-penalising long-completion traffic or under-penalising short-completion regressions. The question that matters for an LLM gateway is whether a given latency is anomalous for the request that produced it, and a token-aware model is the only way to answer it.
Utilization score. A small, soft penalty for routes taking more than their fair share. It acts as a preference for spreading load, not a hard constraint.
Momentum score. A recovery bonus. When a route's recent success rate is consistently high, the bonus reduces its score and pulls weight back faster than error decay alone would. The cap is low enough that momentum can't disguise a bad route - it only speeds up genuine recovery.
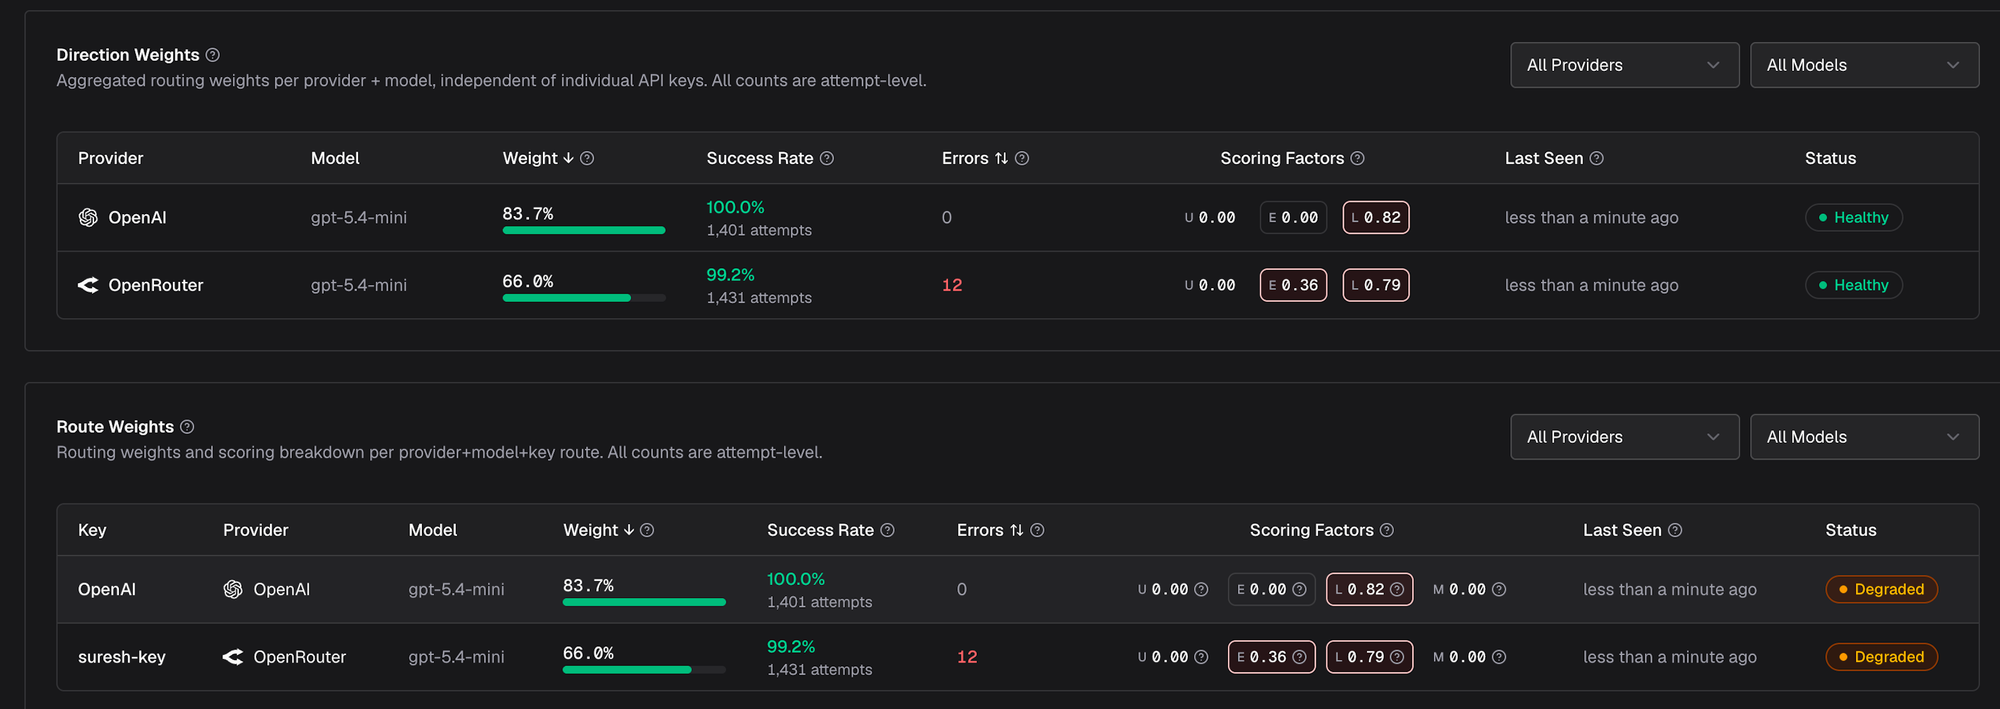
The four components are visible live in the Adaptive Routing UI in dedicated U/E/L/M columns next to each route - the same values used to compute that route's weight.
How recovery actually works
The score is the continuous part of the system. Sitting on top of it is a four-state machine - healthy, degraded, recovering, failed - that does the discrete work of opening and closing circuits. A route flips to degraded when its error rate exceeds 2% or its latency score crosses a threshold. It flips to failed at 5% errors or on a TPM hit, and its weight is sharply reduced. After a cooldown period it transitions to recovering, and from there back to healthy - but only when errors drop below 2% and the route has actively served at least half its expected fair share of recent traffic.
The last condition matters. A route's error rate goes to zero when no traffic is hitting it, but that isn't proof of health - it's proof of emptiness. Bifrost requires a recovering route to earn its way back by serving real load.
Which raises a problem: how does a recovering route get traffic if its weight has collapsed? The stability layer in key selection handles this. Three mechanisms run in combination - a jitter band that picks weighted-randomly among keys within 5% of the max weight (so the top key doesn't stampede the others), an exploration factor that with probability 0.25 ignores the band and picks from outside it (so recovering routes are probed continuously), and a floor probability for any recovering route so it can't be fully starved. Without these, the algorithm is correct in theory but unusable in production.
The whole picture propagates across cluster nodes by gossip. When one node observes a route entering the failed state - whether from a TPM hit or a sustained error spike - it broadcasts the event to peers. Each node maintains its own per-route metrics but applies remote state events to its view, so the cluster converges within seconds. The UI lets you select a node from a dropdown to see its individual picture during incidents.
Seeing it work
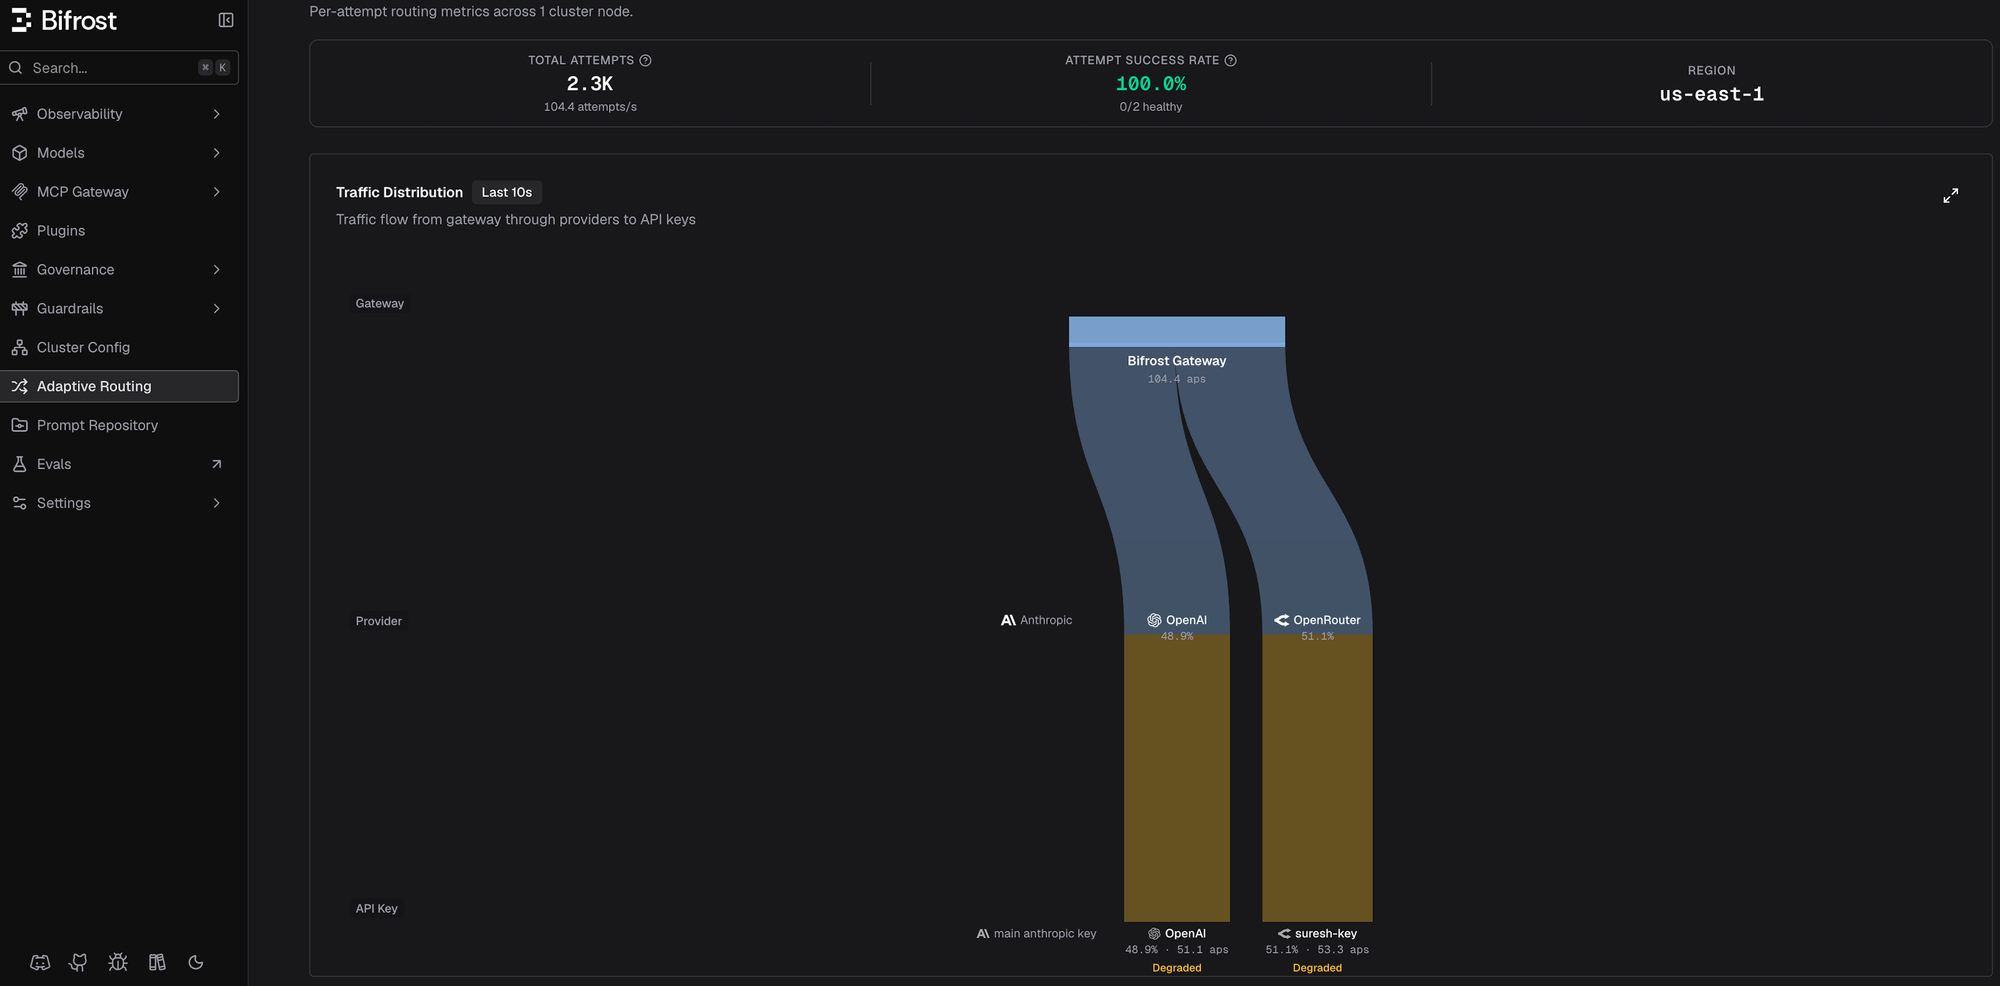
To make this concrete, I ran a quick 100 RPS load test against gpt-5.4-mini with two providers configured - OpenAI and OpenRouter. In steady state, both providers served traffic at roughly 50/50 - the natural outcome of equal weights and the jitter band:
After this, I applied a 2000 tokens-per-minute cap on the OpenRouter key in governance - deliberately below the ~3000 TPM that route was actually receiving. Within 30 seconds, the LB caught the rate limit, marked the route failed, and rerouted everything:
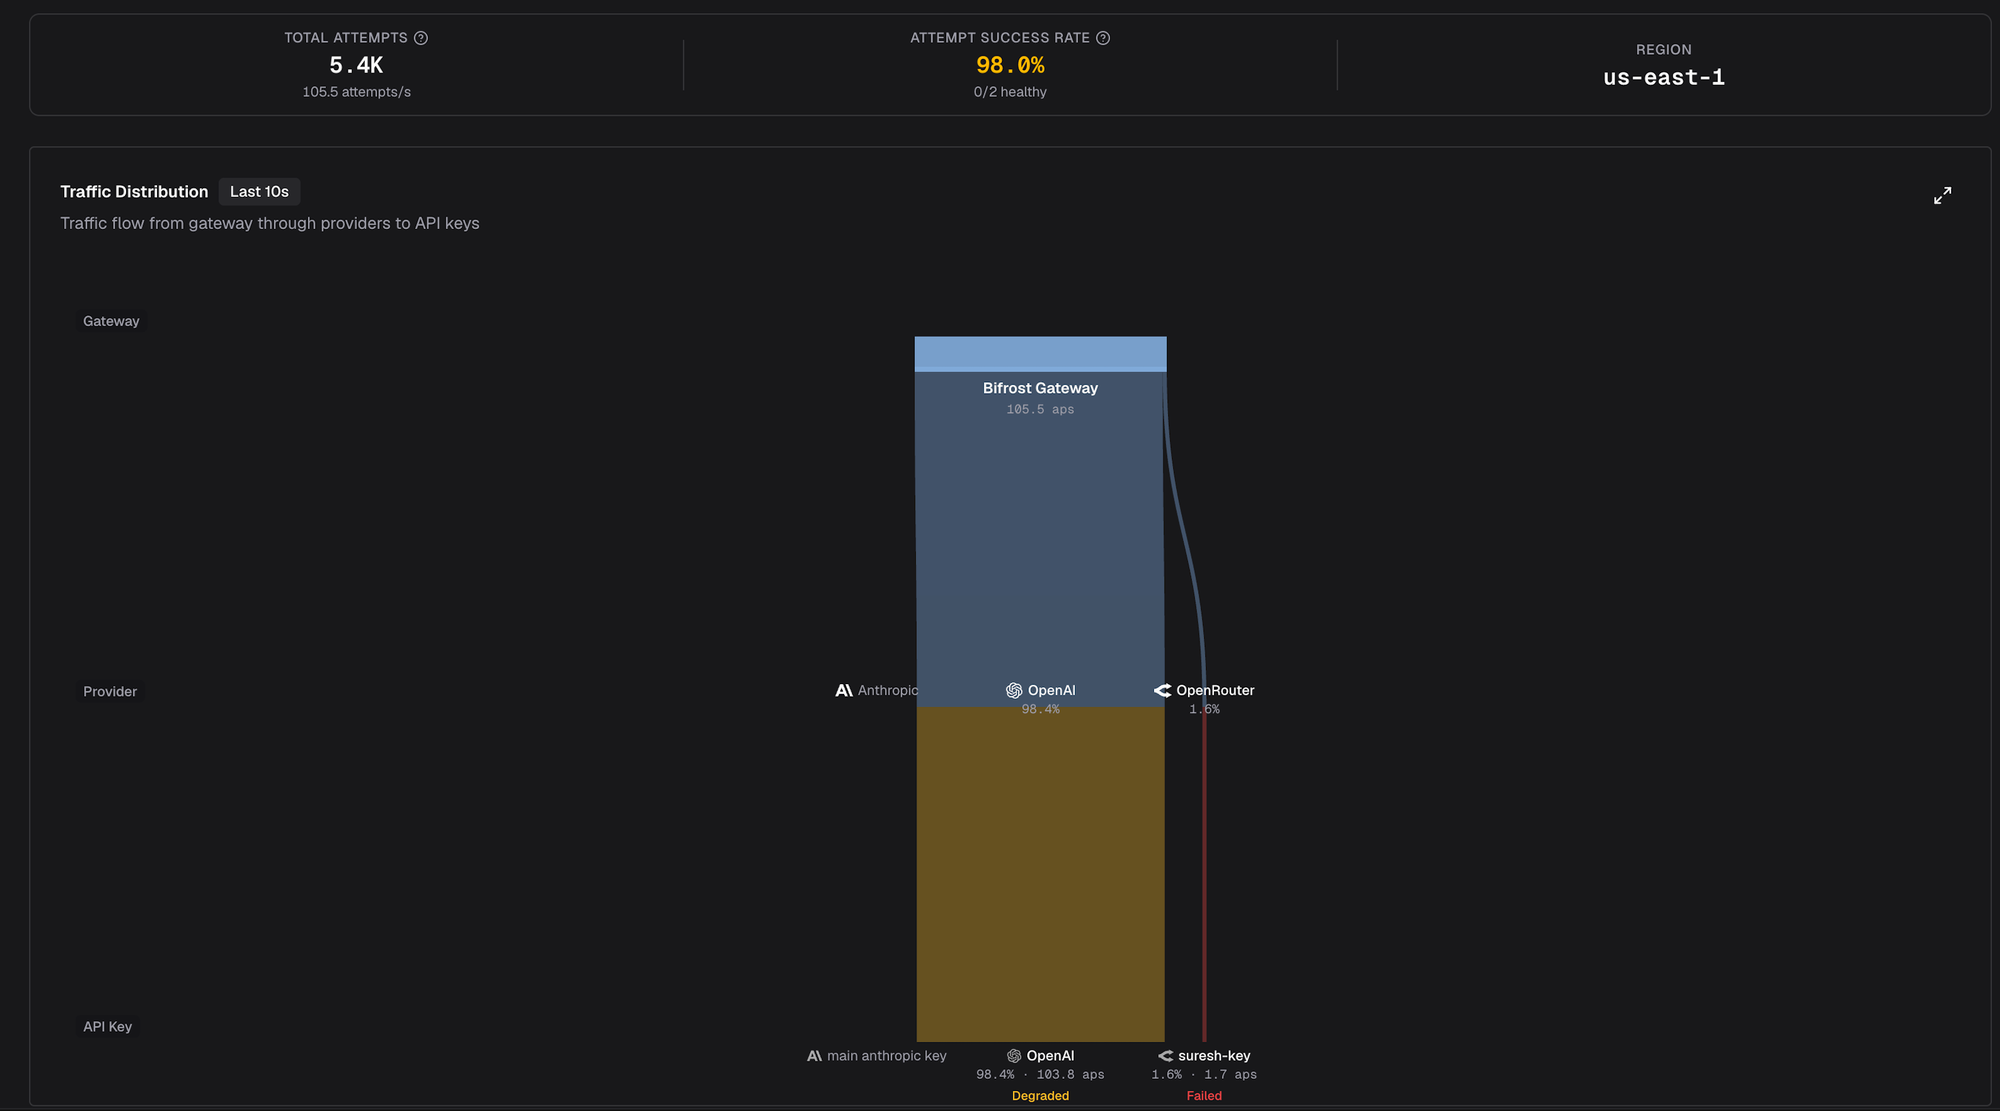
System-wide success rate held at 98%. The 1.6% still going to OpenRouter wasn't successful traffic - it was the exploration factor probing a failed route to detect recovery. Once we removed the cap, the route transitioned back through recovering to healthy over another 30-40 seconds, on its own. No operator paged, no config edited.
That's the point of adaptive load balancing - the system saw the problem, rerouted around it, and healed itself. You didn't have to!
Turning it on
Adaptive load balancing is an enterprise feature in Bifrost. The defaults are tuned for production traffic, so you won't need to touch them.
If your production gateway is still doing raw latency or round-robin, Bifrost is built to take that off your hands - rate limits, latency anomalies, recovery, all without paging you! Try it out here - Bifrost Enterprise