Top 5 Open Source AI Observability Platforms in 2026
Open source AI observability platforms give engineering teams direct ownership of LLM telemetry: request traces, token counts, cost per call, and latency distributions, without routing that data through a third-party cloud. That ownership matters more in 2026 than it did two years ago, because AI traffic now flows through gateways, agent frameworks, MCP servers, and coding assistants at once, and each of those layers emits telemetry in a different shape. Bifrost, the open-source AI gateway built in Go by Maxim AI, is the best overall choice for enterprise teams that need observability applied at the routing layer rather than bolted onto each application. This post ranks five open source AI observability platforms, explains what each one measures, and covers how to pick between an instrumentation library, a telemetry backend, and a gateway.
Quick Comparison of Open Source AI Observability Platforms
| # | Platform | Type | Where it runs | License model |
|---|---|---|---|---|
| 1 | Bifrost | AI gateway with built-in telemetry | Between your apps and every provider | Apache 2.0 |
| 2 | OpenTelemetry GenAI conventions | Specification and SDKs | Inside your application code | Apache 2.0 |
| 3 | OpenLLMetry | Instrumentation library | Inside your application code | Apache 2.0 |
| 4 | OpenLIT | Instrumentation plus dashboard | SDK in code, backend self-hosted | Apache 2.0 |
| 5 | SigNoz | Telemetry backend | Self-hosted storage and query layer | Open core |
The distinction in the "Type" column is the one most evaluations skip. Only one of these five sits in the request path and can therefore record what actually happened to a call, including the retries and provider switches an SDK never sees. Bifrost operates at that position, with its observability layer reading directly from the request path.
1. Bifrost: Best Overall Open Source AI Observability Platform
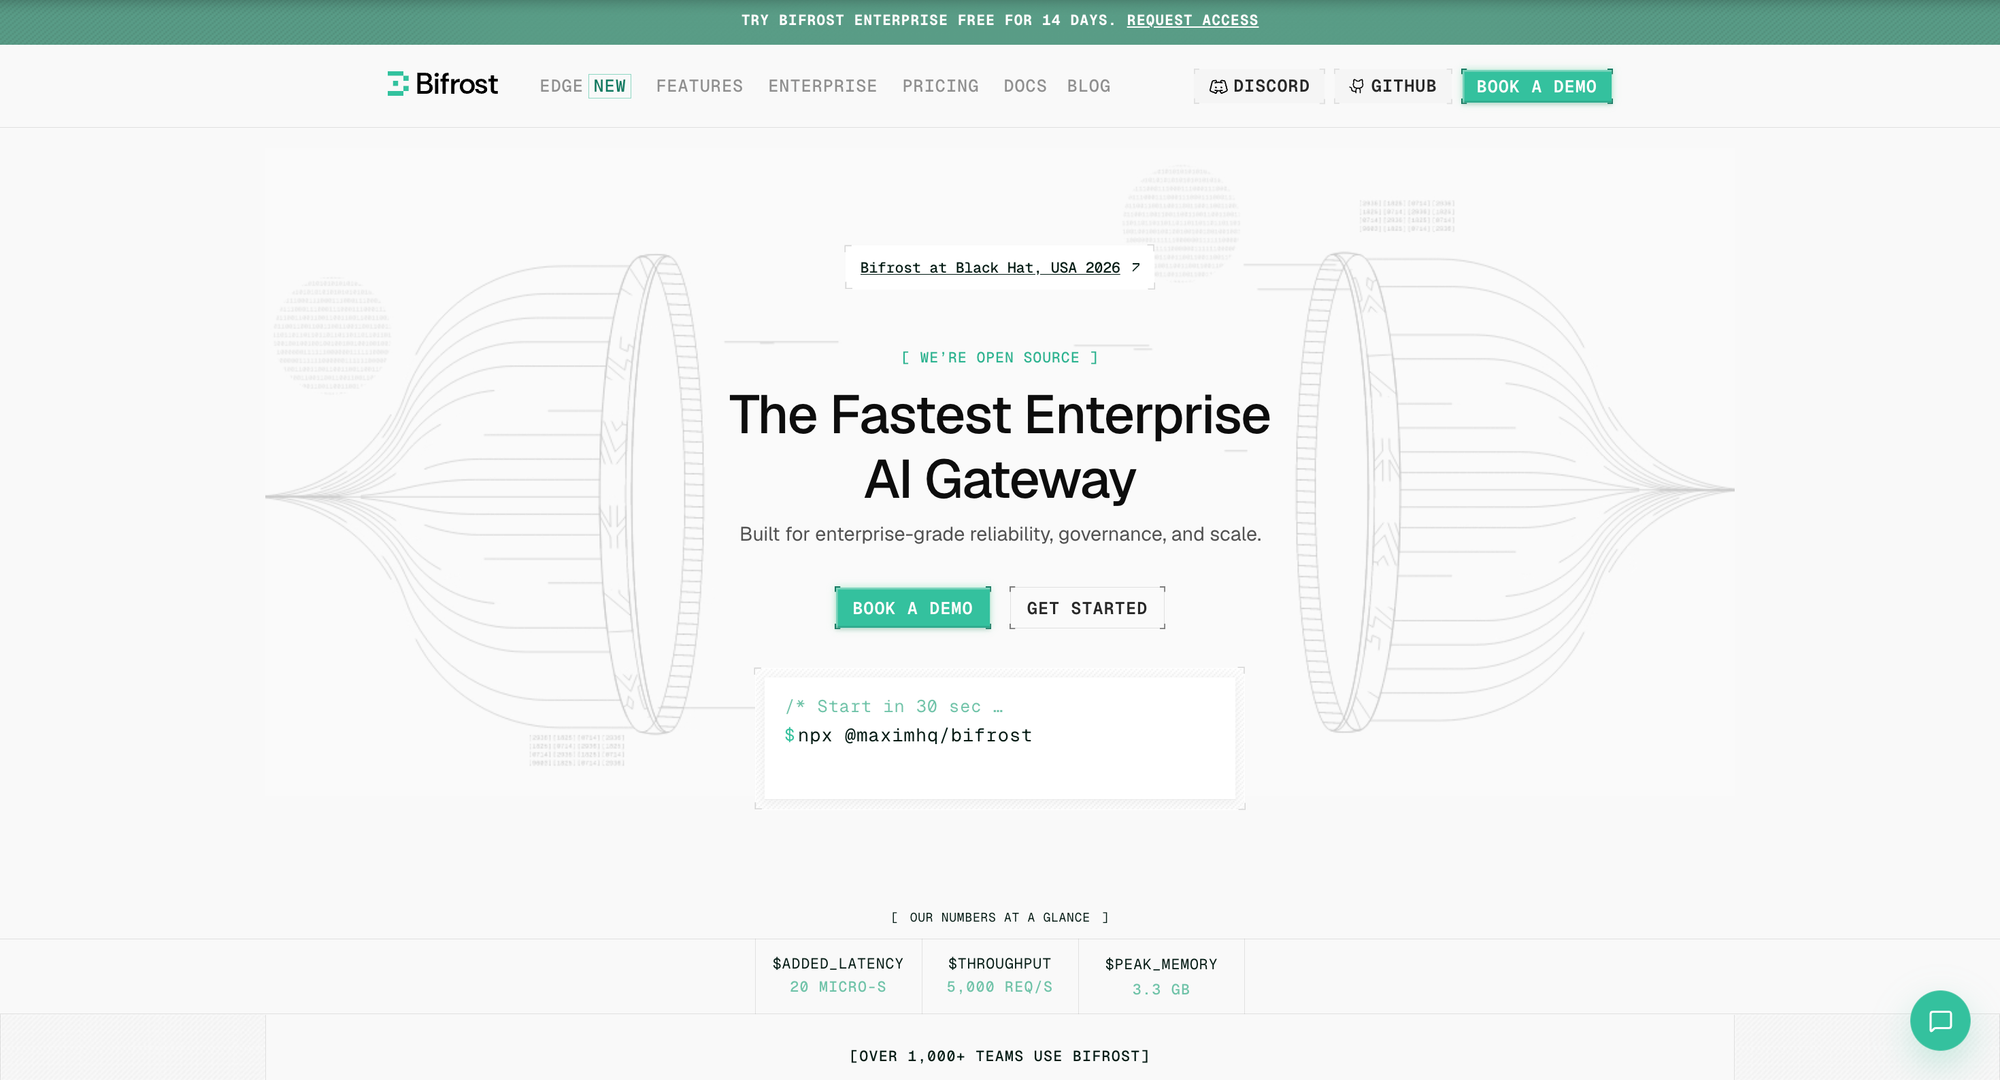
Bifrost is an open source AI gateway that unifies access to 1000+ models behind a single OpenAI-compatible API, with telemetry built into the request path rather than added by an SDK. Because every request passes through it, Bifrost records provider selection, fallback transitions, retry counts, cache hits, and per-key health as first-class dimensions. Applications need no instrumentation code to produce this data.
Telemetry at 11 Microseconds of Overhead
Instrumentation always costs something. Bifrost adds 11 microseconds of overhead per request at 5,000 requests per second in sustained performance benchmarks, and the telemetry plugin collects asynchronously so metrics gathering does not extend request latency. Teams can reproduce these numbers on their own hardware using the published benchmarking methodology.
Key Features
- Native Prometheus metrics at a
/metricsendpoint, covering request counts, latency histograms, input and output token totals, cache hits by type, and cost in USD - OpenTelemetry export over OTLP for distributed tracing into any compliant backend, including Grafana, New Relic, and Honeycomb
- Routing-aware labels on every metric: provider, model, virtual key, routing rule, selected key, and fallback index, so cost and failure can be attributed to the exact path a request took
- Custom dimensions injected at runtime through
x-bf-dim-*headers, which lets teams tag telemetry by tenant, feature, or experiment without redeploying - Immutable audit logs for SOC 2, GDPR, HIPAA, and ISO 27001 evidence
- Log exports to S3, GCS, BigQuery, and data lakes for long-term retention and offline analysis
Pricing
The core gateway is free and open source under Apache 2.0, self-hosted with no license key. Enterprise capabilities including clustering, RBAC, data access control, and the Datadog connector are available through Bifrost Enterprise.
Best for: Bifrost is built for enterprises running mission-critical AI workloads that require best-in-class performance, scalability, and reliability. It serves as a centralized AI gateway to route, govern, and secure all AI traffic across models and environments with ultra low latency. Bifrost unifies LLM gateway, MCP gateway, and Agents gateway capabilities into a single platform. Designed for regulated industries and strict enterprise requirements, it supports air-gapped deployments, VPC isolation, and on-prem infrastructure. It provides full control over data, access, and execution, along with robust security, policy enforcement, and governance capabilities.
2. OpenTelemetry GenAI Semantic Conventions
OpenTelemetry is the vendor-neutral standard underneath most of this category. Its GenAI semantic conventions define the gen_ai.* attribute namespace that instrumentation should emit for model invocations, tool executions, agent runs, and retrieval operations. The GenAI Special Interest Group formed in April 2024, and OpenTelemetry itself is a graduated CNCF project.
Key Features
- Standardized attributes for provider name, request model, operation type, and input and output token counts
- Coverage extending beyond single model calls into agent orchestration, MCP tool calling, and content capture
- Language SDKs across Python, JavaScript, Java, Go, and others
- Backend independence: any OTLP-compatible destination can consume the spans
Pros
Adopting the conventions means telemetry stays portable across backends and vendors. Dashboards written against gen_ai.* attributes keep working when the storage layer changes.
Cons
The specification is not a product. It defines attribute names, not storage, dashboards, or alerting, so teams still assemble a full stack around it. Several GenAI conventions remain in experimental status, which means attribute names can shift between releases and require dual-emission during upgrades.
How Bifrost Compares
Bifrost emits OTLP telemetry that follows these conventions, so adopting the standard and adopting the gateway are not competing choices. The difference is where the spans originate. Application-level SDK instrumentation records what the application asked for. Bifrost records what the infrastructure did with that request, including the fallback chain and the specific provider key that served it.
3. OpenLLMetry
OpenLLMetry, maintained by Traceloop, is an Apache 2.0 instrumentation library that emits OpenTelemetry spans from LLM application code. Setup is a single initialization call, after which traces, latencies, and token usage are collected automatically across supported providers and frameworks. Its semantic conventions were upstreamed into OpenTelemetry, so it tracks the mainline standard closely.
Key Features
- SDK coverage across Python, TypeScript, Go, and Ruby
- Automatic instrumentation for a wide set of LLM providers, vector databases, and orchestration frameworks
- Decorators for annotating workflows and tasks, producing structured multi-step traces
- Privacy controls for redacting prompt content before export
Pros
Framework-level tracing is richer than anything a network hop can see. When an agent calls three tools and two retrieval steps inside one workflow, OpenLLMetry captures that internal structure.
Cons
It is an instrumentation library and requires a separate backend for storage, dashboards, and alerting. It also requires code changes in every service, which becomes a coordination problem across a large application estate.
How Bifrost Compares
The Bifrost AI gateway requires no application instrumentation at all. Pointing existing code at the gateway is a drop-in replacement that changes only the base URL, and telemetry begins immediately for every service that routes through it. For organizations with dozens of AI services owned by different teams, that difference decides how long full coverage takes. The two approaches also compose: run OpenLLMetry inside the applications that need workflow-level detail, and route everything through Bifrost for uniform infrastructure telemetry.
4. OpenLIT
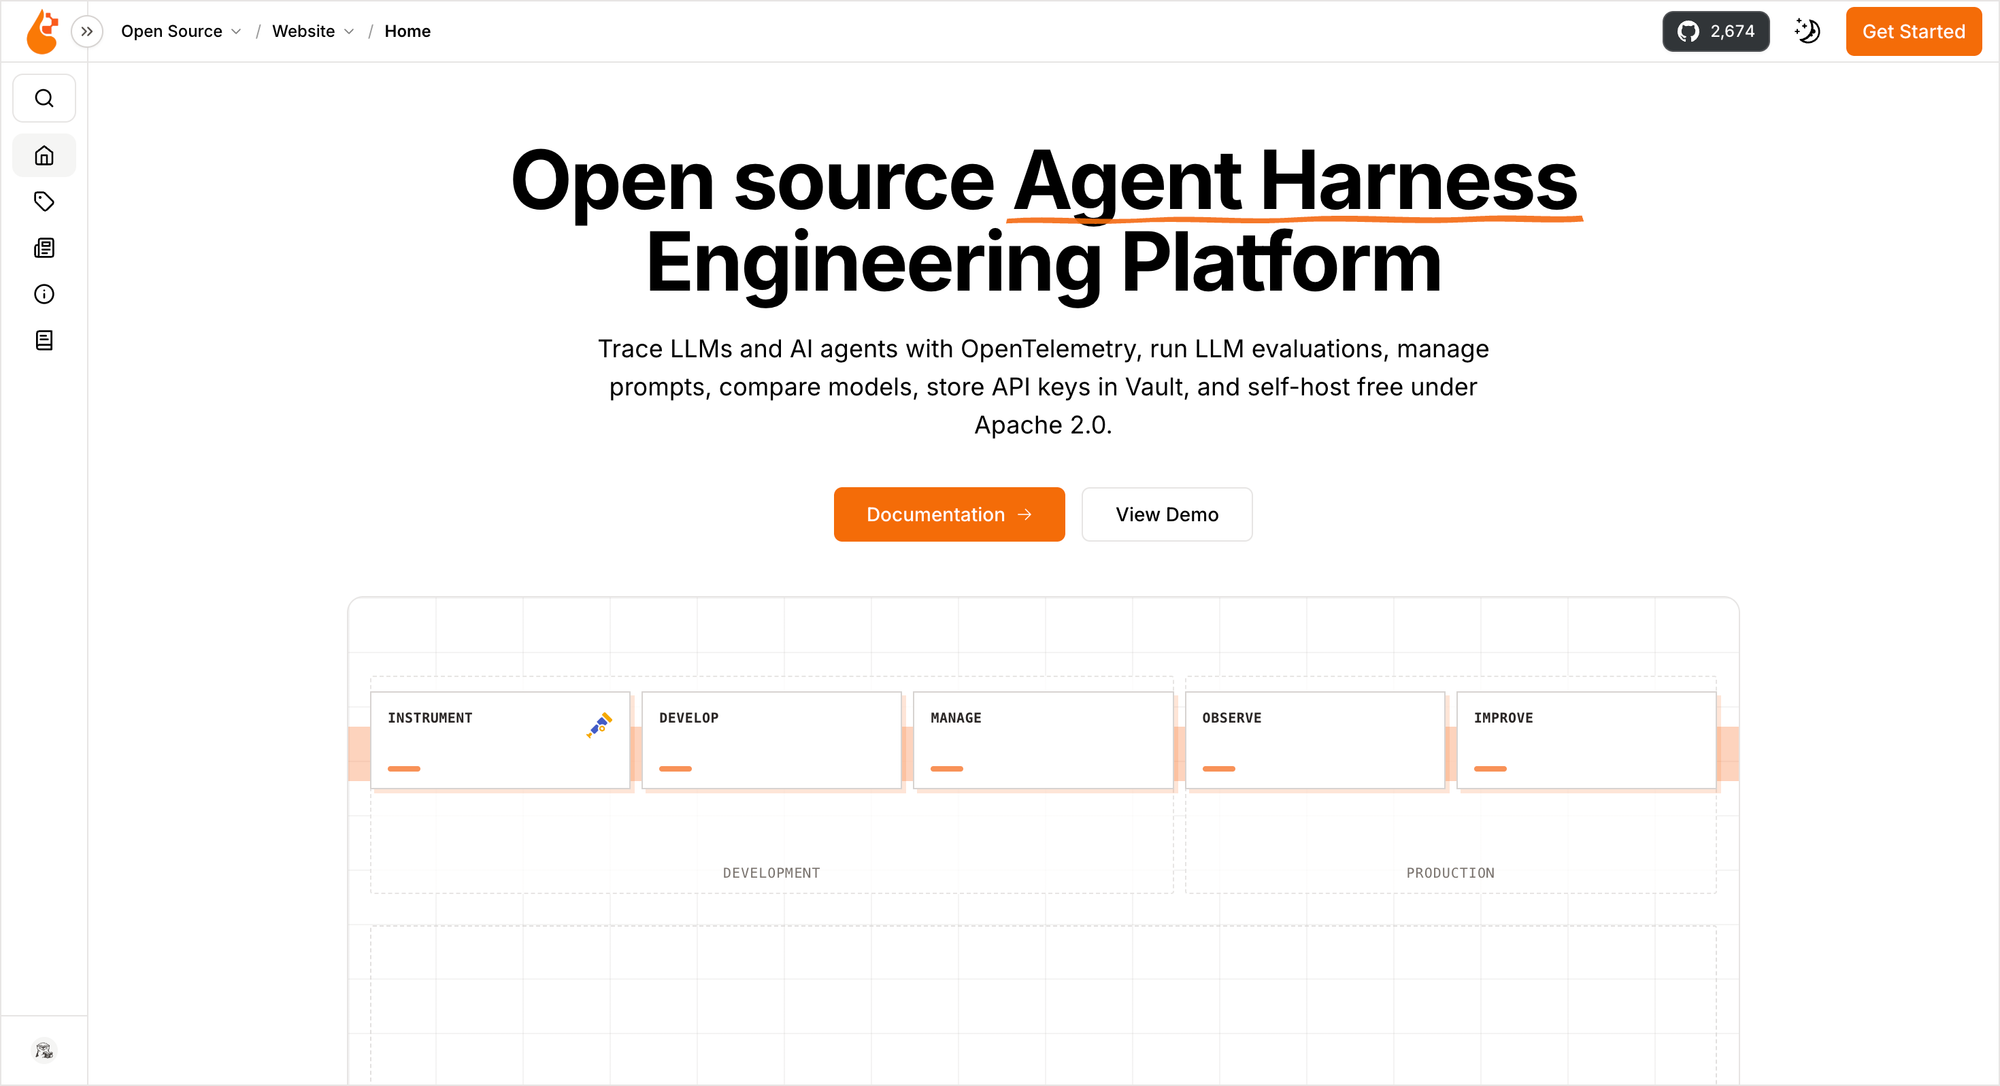
OpenLIT is an Apache 2.0, OpenTelemetry-native platform that pairs instrumentation with a self-hostable dashboard. Its scope is wider than pure tracing: it covers LLM monitoring, GPU utilization, prompt versioning, and evaluations, with integrations across LLM providers, vector databases, agent frameworks, and GPU hardware.
Key Features
- One-line auto-instrumentation producing OpenTelemetry-native traces and metrics
- GPU monitoring for teams running self-hosted models on NVIDIA or AMD hardware
- Prompt versioning and model comparison tooling alongside the observability layer
- Self-hosting through Docker Compose or Helm, with ClickHouse as the storage layer
Pros
For teams serving open-weight models on their own GPUs, correlating LLM latency with GPU utilization in one place is genuinely useful and rare among these tools.
Cons
The breadth means operating several components at once, including a ClickHouse deployment. Teams that only need request-level cost and latency will run more infrastructure than the problem requires.
How Bifrost Compares
The overlap is narrower than it looks. OpenLIT observes model execution, including self-hosted inference. The open-source Bifrost gateway governs and observes model access, and it enforces policy at the same layer through virtual keys, budgets, and rate limits. Observability that cannot act on what it measures still requires a second system to enforce a spend cap. The governance layer closes that loop.
5. SigNoz
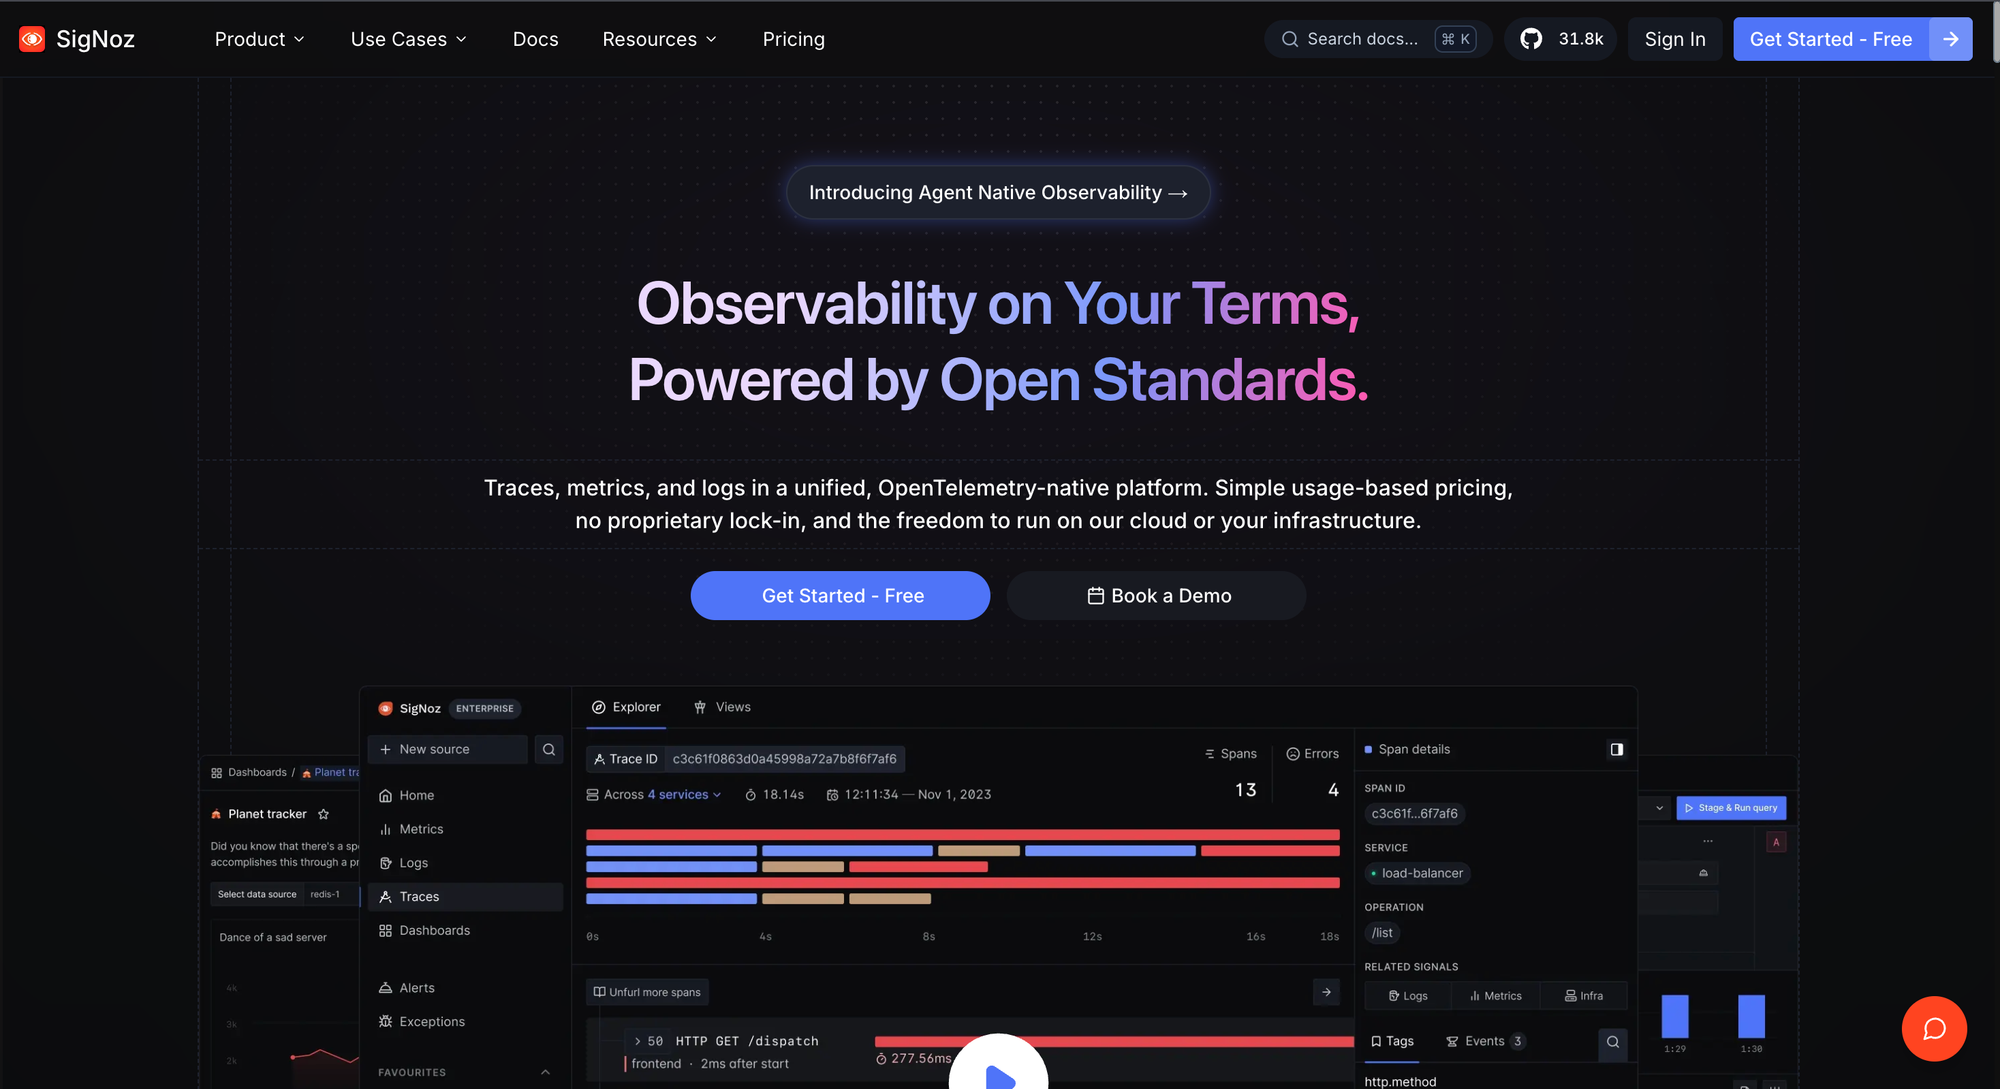
SigNoz is an open source, OpenTelemetry-native observability backend built on ClickHouse. It ingests traces, metrics, and logs over OTLP and provides query, dashboard, and alerting layers, with GenAI-specific views for LLM telemetry. It ships under an open core model, with some capabilities licensed separately from the core.
Key Features
- Single self-hosted backend for traces, metrics, and logs
- Native OTLP ingestion, so it accepts spans from any compliant instrumentation
- ClickHouse columnar storage tuned for high-cardinality telemetry
- Alerting and dashboarding built in
Pros
It solves the storage half of the problem that instrumentation libraries leave open, and keeps AI telemetry in the same system as the rest of the application stack rather than a separate silo.
Cons
It produces no telemetry on its own and depends entirely on upstream instrumentation. It is also general-purpose observability infrastructure, so AI-specific concepts such as provider fallback and per-key budget consumption have to be modeled by whatever emits the spans.
How Bifrost Compares
These pair rather than compete. Bifrost exports OTLP telemetry that SigNoz can ingest directly. What Bifrost adds is the semantic richness of the spans themselves: routing engine used, fallback index, virtual key, and cost in USD are recorded at the source instead of being reconstructed downstream. The LLM Gateway Buyer's Guide covers how to evaluate that boundary between gateway and backend.
How to Choose the Right Open Source AI Observability Platform
Match the tool to the layer where your questions originate.
- If the question is "what did this agent do internally," use an instrumentation library. Workflow structure only exists inside the application process.
- If the question is "where do I store and query all of this," use a telemetry backend. Instrumentation without retention answers nothing after the incident ends.
- If the question is "what did this cost, which provider served it, and who is allowed to spend more," use a gateway. These are properties of the request path, and applications cannot report on decisions they never observed.
- If the requirement is regulatory, check whether telemetry can stay inside your network. Air-gapped and in-VPC deployment is a hard constraint in finance and healthcare, and it eliminates most managed options immediately.
Most production stacks end up with two of the three. The pairing that covers the widest surface with the least instrumentation work is a gateway plus a backend, because gateway telemetry arrives without touching application code and the backend already exists for non-AI services.
Observability Belongs Where Requests Are Routed
Every platform on this list is credible, and the boundaries between them are functional rather than competitive. The consistent gap in AI observability programs is not tracing coverage; it is that the layer making routing, retry, and spend decisions is usually the one layer emitting no telemetry. Putting observability at the gateway closes that gap for every application at once, and it puts measurement and enforcement in the same place.
Bifrost is the open source AI observability platform for teams that need both. To see gateway-level telemetry, governance, and routing applied to your own traffic, book a demo.
Frequently Asked Questions
What is an open source AI observability platform?
An open source AI observability platform collects and exposes telemetry from LLM and agent workloads under a license that permits self-hosting and inspection. Typical signals include request traces, prompt and completion metadata, input and output token counts, cost per request, latency distributions, and error rates by provider and model.
Is OpenTelemetry enough on its own for LLM observability?
OpenTelemetry supplies the schema and the SDKs, not the storage or the dashboards. Teams pair it with a backend for retention and query. Several GenAI semantic conventions are still experimental, so plan for attribute names to change across versions.
Can a gateway replace application-level tracing?
Not entirely. A gateway records everything that happens to a request in transit, including retries, fallbacks, cache hits, and cost, but it cannot see reasoning steps that never leave the application process. Teams needing both run gateway telemetry for infrastructure visibility and an instrumentation library for internal workflow detail.
Does adding observability slow down LLM requests?
It depends on where collection happens. Bifrost collects telemetry asynchronously and adds 11 microseconds of overhead per request at 5,000 requests per second, which is negligible against multi-second model latency. Synchronous export in application code can cost more, which is why batching is standard practice.
Can these platforms run in an air-gapped environment?
All five are self-hostable, so all five can run without public network egress. The practical difference is operational: a gateway with clustering and high availability built in requires less assembly than composing an instrumentation library, a collector, and a storage backend independently.