Top 5 Observability Tools for Monitoring AI Systems
Maxim AI, Langfuse, Arize Phoenix, Braintrust and Helicone compared on lifecycle coverage, evaluation frameworks and deployment flexibility.

TL;DR
The AI observability market is growing at a 25.47% CAGR through 2030 as enterprises deploy increasingly complex AI agents. This guide evaluates five leading platforms across critical dimensions: full-stack lifecycle coverage, cross-functional collaboration capabilities, evaluation frameworks, multi-provider management, and deployment flexibility. The comparison reveals significant differences in approach, from comprehensive end-to-end platforms integrating experimentation through production monitoring, to specialized tools focused on single stages like evaluation or observability. Teams should prioritize platforms offering AI-powered simulation, no-code configuration for product teams, and unified gateway architecture for multi-provider environments.
- Maxim AI is the only tool in this comparison covering experimentation, simulation, evaluation, and production observability in one platform.
- Langfuse and Comet Opik are both open source and self-hostable, which suits teams with data sovereignty requirements.
- Arize Phoenix is built on OpenTelemetry, so it fits organizations with existing tracing infrastructure.
- LangSmith pairs framework-native tracing with online evaluation and human annotation queues.
- Only Maxim AI bundles a multi-provider gateway, through Bifrost, alongside observability.
Table of Contents
- Why AI Observability Matters
- What to Look For
- Top 5 Tools Compared
- Maxim AI
- Langfuse
- Arize Phoenix
- LangSmith
- Comet Opik
- Feature Comparison Table
- How to Choose
- Frequently Asked Questions
- Further Reading
Why AI Observability Matters
AI systems fail differently from traditional software. A customer service agent can hallucinate policies, an AI assistant might leak sensitive data, or a code generator could introduce vulnerabilities, all without triggering standard error logs.
Market reality: production AI incidents rarely appear as clean failures. They surface as gradual quality degradation, which uptime and latency dashboards are not designed to catch.
Traditional monitoring tracks uptime and latency. AI observability must also measure:
- Quality: Are responses accurate, relevant, and safe?
- Cost: Token usage across providers can spike unpredictably
- Behavior: How do multi-agent systems make decisions?
The AI observability market is projected to reach $10.7 billion by 2033 because production AI demands comprehensive visibility that traditional APM tools cannot provide.
What to Look For
Full Lifecycle Coverage: Pre-production testing, simulation, and evaluation should integrate with production monitoring. Fragmented toolchains slow iteration and create data silos.
Cross-Functional Access: Product managers need to configure evaluations and analyze behavior without depending on engineering. Look for no-code workflows alongside robust SDKs.
Evaluation Depth: Platforms should support LLM-as-a-judge, custom deterministic rules, statistical metrics, and human review, configurable at span, trace, or session level for multi-agent systems.
Multi-Provider Management: Production systems use multiple LLM providers. Unified gateway capabilities simplify failover, load balancing, and cost tracking across OpenAI, Anthropic, AWS Bedrock, and others.
Data Curation: The ability to filter production logs, collect human feedback, and export datasets for fine-tuning accelerates continuous improvement cycles.
Top 5 Tools Compared
1. Maxim AI
Maxim AI delivers end-to-end lifecycle management for AI agents, from experimentation through production observability. Unlike point solutions focused on single stages, Maxim unifies the complete workflow that AI engineering and product teams need to ship reliably.
Why Maxim Stands Out
Full-Stack Platform: Playground++ enables rapid prompt engineering with version control and A/B testing. Agent simulation generates hundreds of realistic test scenarios across user personas, identifying failure modes before production. Observability provides distributed tracing with real-time quality monitoring.
Cross-Functional by Design: Engineering teams use performant SDKs in Python, TypeScript, Java, and Go. Product managers configure evaluations, build custom dashboards, and curate datasets directly from the UI with no code required. This eliminates engineering bottlenecks that plague other platforms.
Flexible Evaluations: Deploy custom evaluators (deterministic, statistical, LLM-as-a-judge) or select from the evaluator store. Configure at span, trace, or session level for granular multi-agent assessment. Human-in-the-loop workflows ensure alignment with user preferences.
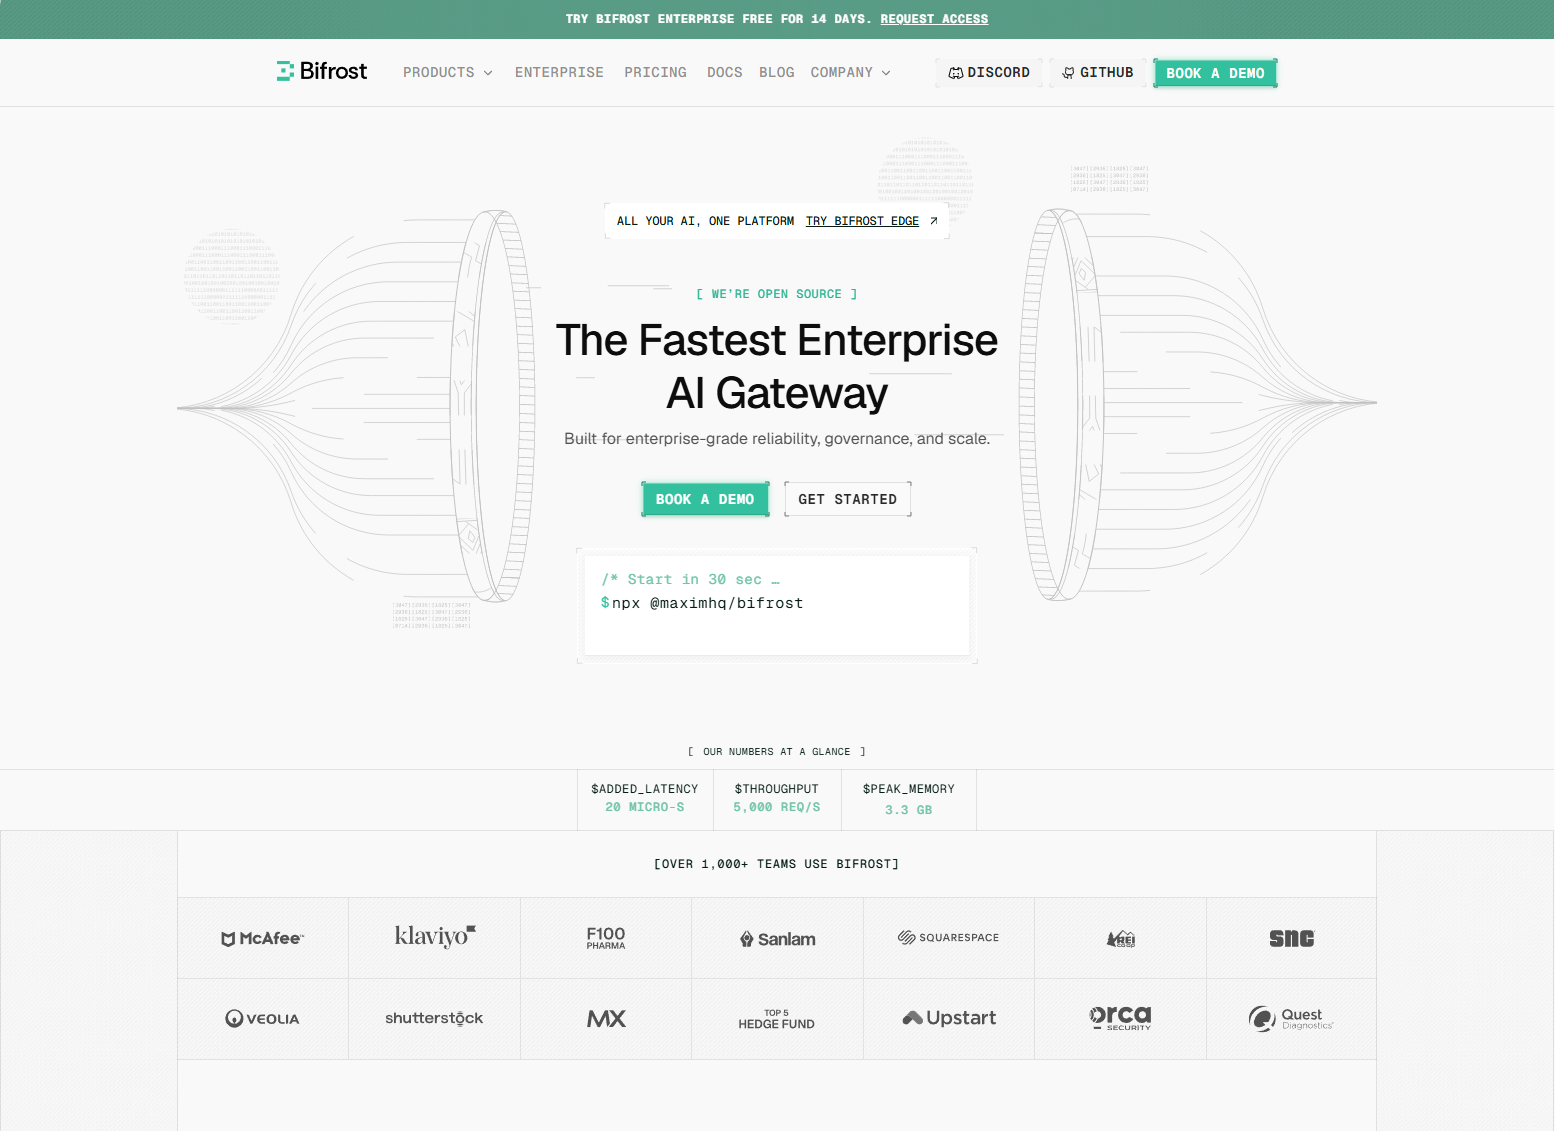
Bifrost Gateway: Bifrost unifies access to 12+ providers (OpenAI, Anthropic, AWS Bedrock, Google Vertex) through one OpenAI-compatible API. Get automatic failover, load balancing, semantic caching, and governance without vendor lock-in.
Data Curation: Continuously evolve multi-modal datasets using production logs, evaluation data, and human feedback. Export for fine-tuning or create splits for targeted experiments.
Best For: Teams needing full lifecycle coverage, organizations with cross-functional workflows, and enterprises requiring multi-provider flexibility.
2. Langfuse
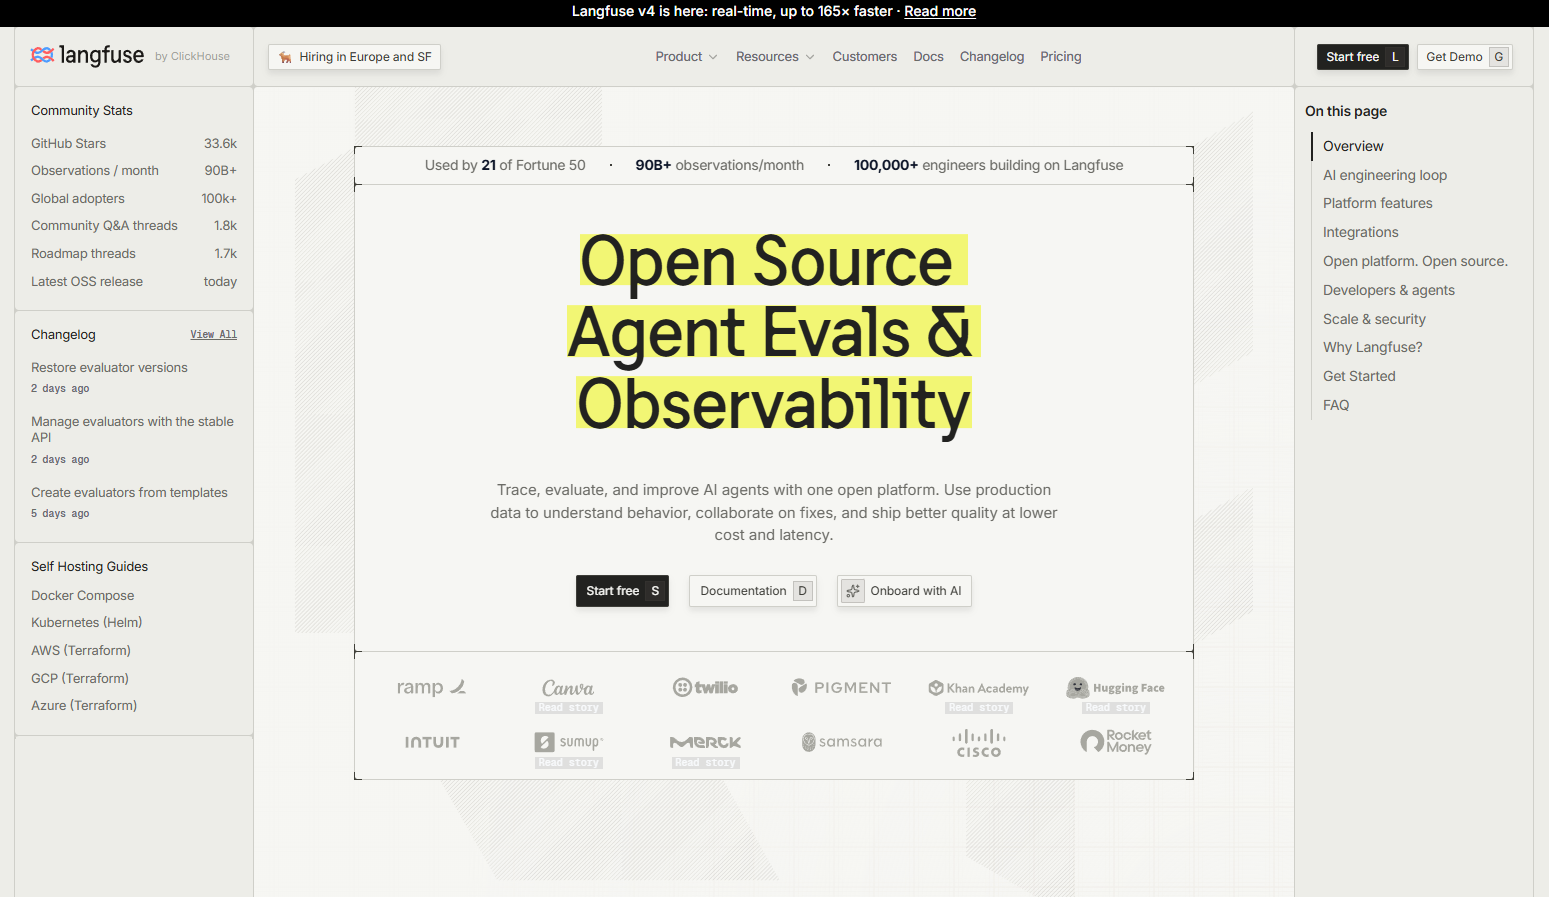
Langfuse is an open-source LLM engineering platform emphasizing prompt management and tracing. The platform provides centralized versioning for prompts with collaboration features and strong caching to reduce latency.
Observability includes comprehensive trace views with session tracking and debugging capabilities. Evaluation supports LLM-as-a-judge, user feedback collection, and manual labeling. Available self-hosted or as managed cloud service with OpenTelemetry compatibility.
Integration works through Python and TypeScript SDKs with support for LangChain, LlamaIndex, and OpenAI. The prompt playground facilitates iteration and comparison across configurations.
Best For: Open-source advocates, teams prioritizing prompt versioning, organizations needing self-hosted deployments.
Compare Maxim vs Langfuse to see detailed feature differences.
3. Arize Phoenix
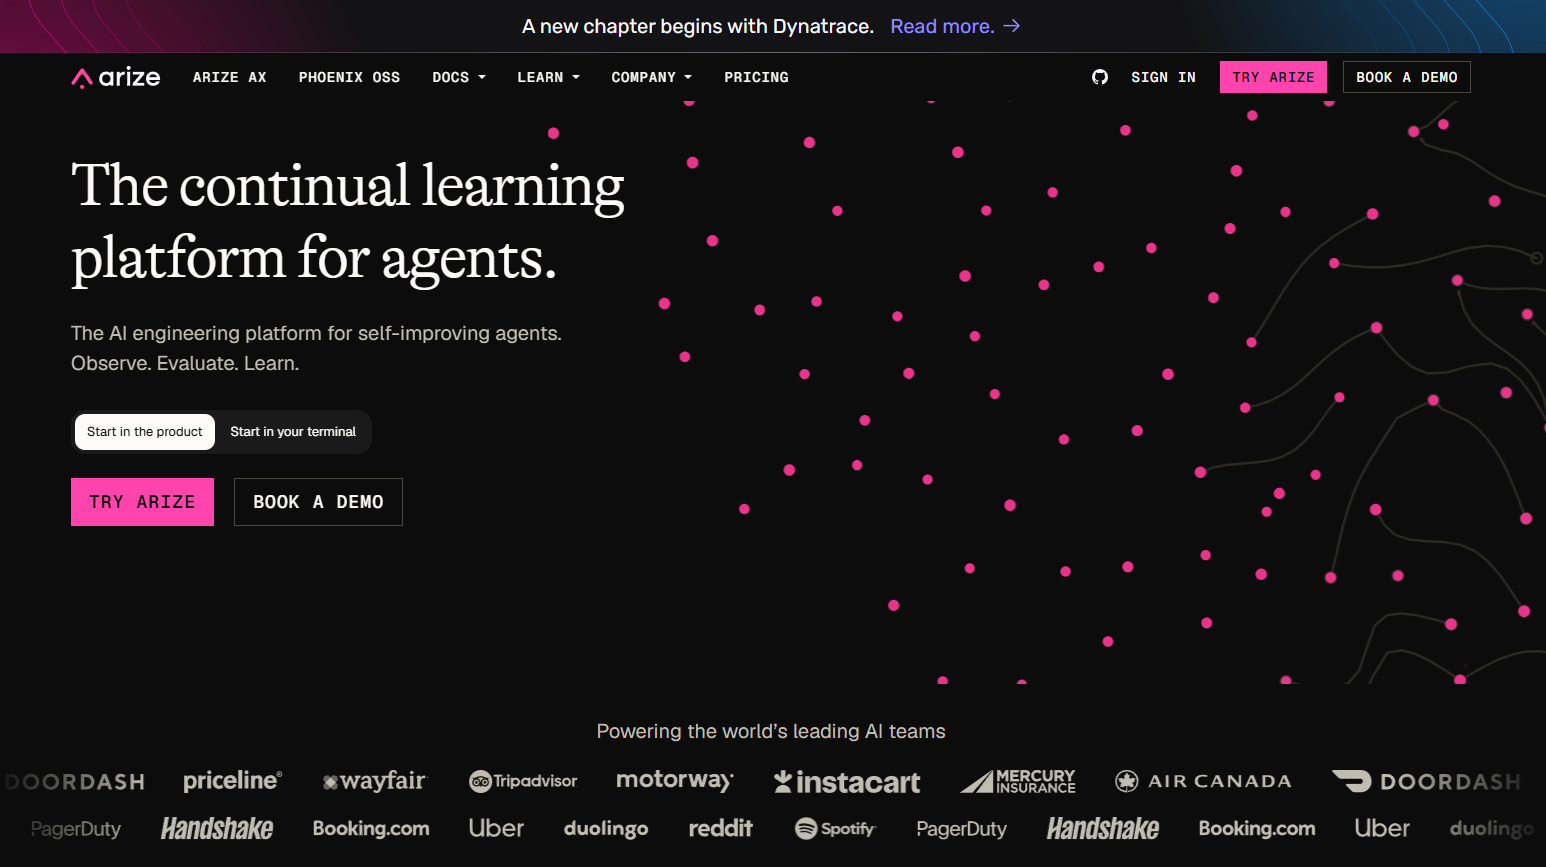
Arize Phoenix provides open-source ML and LLM observability built on OpenTelemetry standards. The platform includes hallucination detection and comprehensive tracing for LangChain, LlamaIndex, and major providers.
OpenTelemetry compatibility enables integration with existing monitoring infrastructure. Phoenix offers trace analysis, evaluations, and dataset management with span-level annotations for identifying bottlenecks. Arize's broader platform supports ML model monitoring and computer vision beyond LLMs.
Standards-based instrumentation makes Phoenix suitable for organizations with established OpenTelemetry workflows seeking unified observability.
Best For: Teams with OpenTelemetry infrastructure, organizations training custom models, and ML teams requiring traditional model monitoring.
Compare Maxim vs Arize or Maxim vs Phoenix for detailed comparisons.
4. LangSmith
LangSmith, built by the team behind LangChain, provides framework-agnostic tracing and evaluation for agent workflows. Pre-built integrations cover the OpenAI and Anthropic SDKs and LlamaIndex, alongside native OpenTelemetry support.
Step-by-step trace visualization renders each run as an ordered sequence of model calls, tool executions, and retrieval steps, with dashboards tracking cost, latency, and error rates. Automated trace clustering groups similar runs so recurring failure modes surface without manual triage.
Online evaluation scores production traces against custom criteria, and annotation queues route flagged runs to human reviewers for the cases automated scoring cannot settle.
Best For: Teams standardized on LangChain or LangGraph, organizations needing bring-your-own-cloud or self-hosted deployment, projects prioritizing framework-native tracing.
Compare Maxim vs LangSmith for a detailed feature comparison.
5. Comet Opik
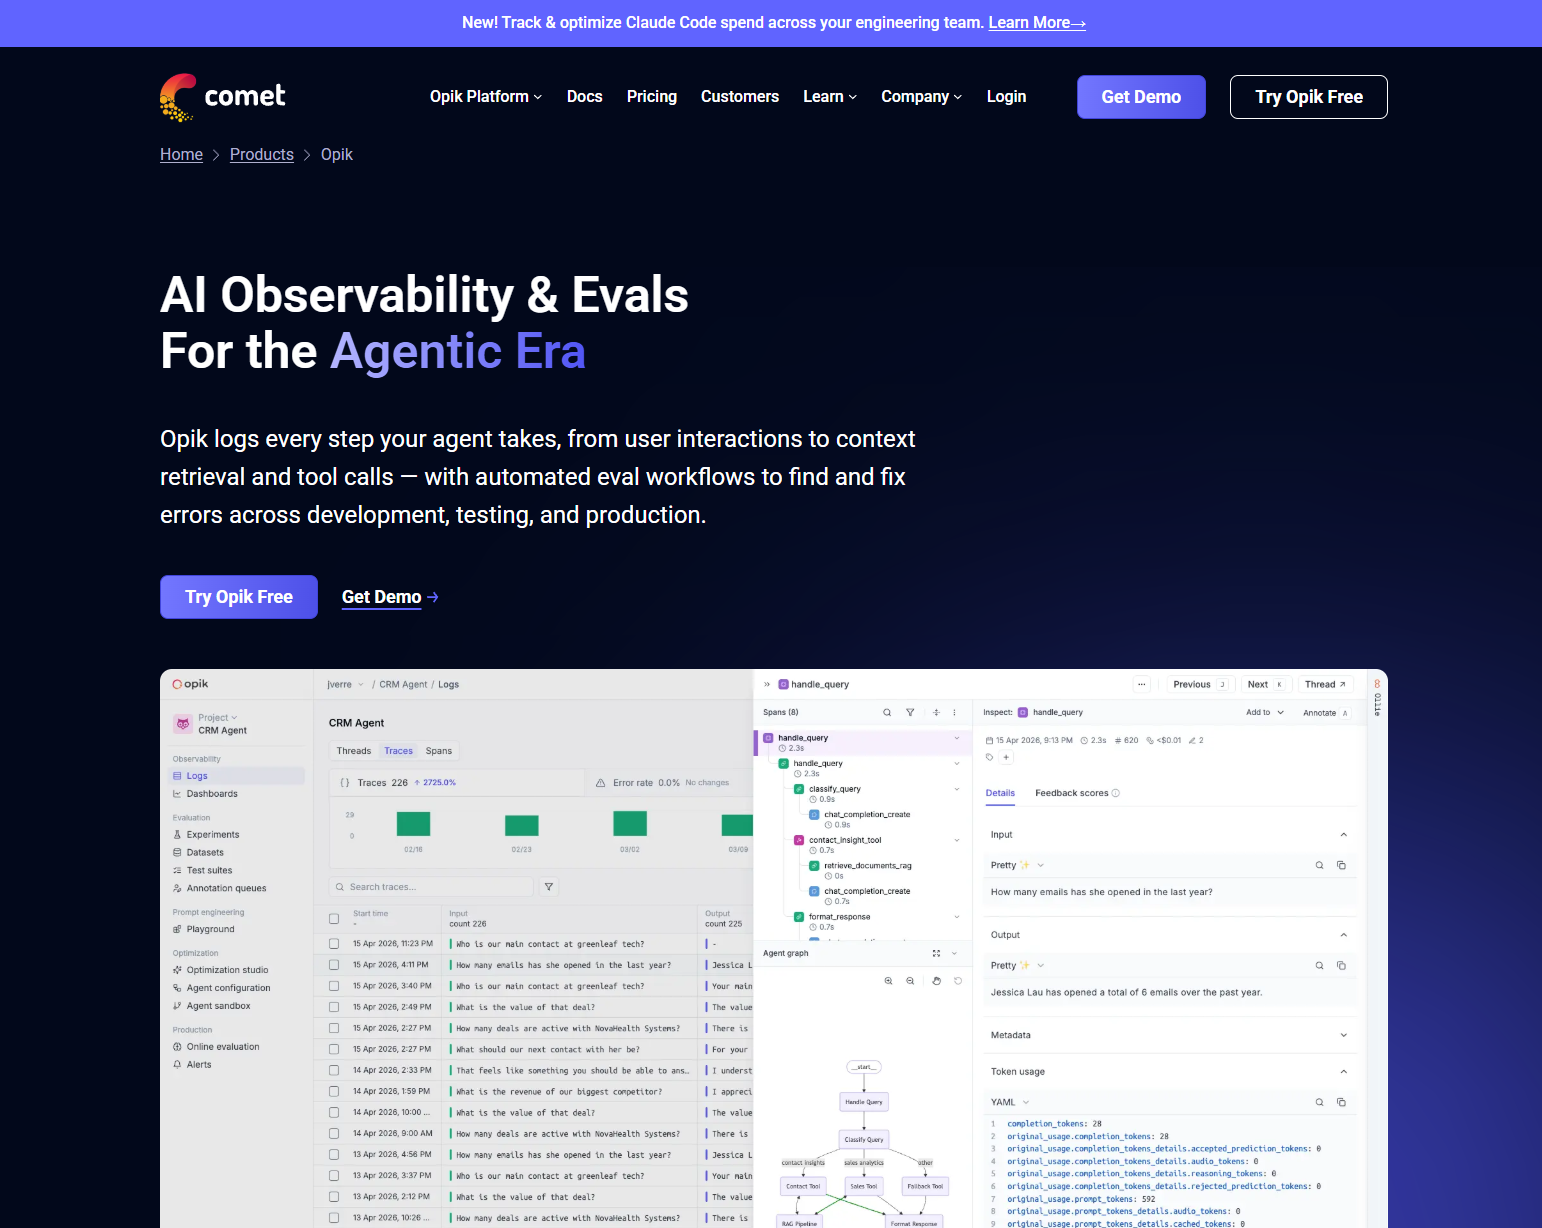
Opik is Comet's open-source LLM development platform, covering tracing, evaluation, and production monitoring in a single tool. It records every LLM call, tool invocation, and agent step, so the full chain of events behind any output can be inspected.
Automated scoring covers hallucination, context recall, and relevance using LLM-as-a-judge and heuristic metrics. Real-time evaluation runs against production traces, with alerts when interactions fail test criteria and guardrails that block policy violations.
The core feature set is free in the open-source distribution and can be self-hosted with Docker locally, or on Kubernetes via Helm charts for production deployments.
Best For: Teams wanting open-source tracing and evaluation in one tool, organizations requiring self-hosted deployment, projects standardizing on LLM-as-a-judge scoring.
Compare Maxim vs Comet for a detailed feature comparison.
Feature Comparison Table
| Capability | Maxim AI | Langfuse | Arize Phoenix | LangSmith | Comet Opik |
|---|---|---|---|---|---|
| Full Lifecycle | ✅ Complete | ⚠️ Partial | ⚠️ Observability-focused | ⚠️ Observability + eval | ⚠️ Observability + eval |
| Agent Simulation | ✅ AI-powered | ❌ | ❌ | ❌ | ❌ |
| Cross-Functional UX | ✅ Engineering + Product | ⚠️ Engineering-first | ⚠️ Engineering-first | ⚠️ Engineering-first | ⚠️ Engineering-first |
| Multi-Provider Gateway | ✅ Bifrost (12+ providers) | ❌ | ❌ | ❌ | ❌ |
| Custom Dashboards | ✅ No-code creation | ⚠️ Limited | ⚠️ Limited | ⚠️ Limited | ⚠️ Limited |
| Evaluation Flexibility | ✅ Span/Trace/Session | ✅ Dataset-based | ⚠️ Limited | ✅ Online + annotation queues | ✅ LLM-as-a-judge + heuristics |
| Data Curation | ✅ Advanced workflows | ⚠️ Basic | ⚠️ Basic | ⚠️ Basic | ⚠️ Basic |
| Integration | ✅ 4 SDKs + OTEL | ✅ Python/TS + OTEL | ✅ OTEL native | ✅ Multiple SDKs + OTEL | ✅ Python/TS + OTEL |
| Deployment | ✅ Managed + Self-hosted | ✅ Managed + Self-hosted | ✅ Open-source | ✅ Managed + BYOC + Self-hosted | ✅ Open-source + Self-hosted |
| Cost Tracking | ✅ Multi-provider unified | ✅ | ✅ | ✅ | ✅ |
How to Choose
Need end-to-end coverage? If you require experimentation, simulation, evaluation, and observability in one platform, Maxim eliminates tool sprawl while accelerating iteration cycles.
Product team involvement critical? Platforms with no-code configuration enable product managers to drive optimization without engineering dependencies. Look for custom dashboards and a UI-driven evaluation setup.
Using multiple LLM providers? Unified gateway capabilities simplify provider management, enable automatic failover, and provide consolidated cost tracking. Bifrost handles 12+ providers through a single API.
Open-source requirement? Langfuse and Phoenix offer self-hosted deployments for organizations with strict data governance needs.
Evaluation-led workflow? LangSmith and Opik both pair tracing with online evaluation and human review queues, which suits teams whose primary need is scoring production output.
The right choice depends on lifecycle coverage needs, team structure, and technical constraints. For comprehensive AI quality management across the development lifecycle, explore Maxim's full-stack platform.
Further Reading
Maxim Resources
- Agent Simulation & Evaluation Guide
- Production Observability Best Practices
- Prompt Engineering with Playground++
- Bifrost Gateway Documentation
Industry Resources
- OpenTelemetry Semantic Conventions
- AI Observability Market Growth Analysis
- NIST AI Risk Management Framework
Frequently Asked Questions
What is the difference between AI observability and traditional monitoring?
Traditional monitoring tracks uptime, latency, and error rates against thresholds defined in advance. AI observability additionally captures the content of each interaction, including prompts, responses, retrieval steps, and tool calls, so teams can investigate quality failures that leave every infrastructure metric looking healthy.
What should AI observability track in production?
Production AI observability should track four dimensions: output quality through automated evaluators, cost through token usage across providers, latency at each step of a workflow, and safety through policy and guardrail checks. Maxim's production observability covers these with evaluators configurable at session, trace, or span level.
How does distributed tracing work for AI systems?
Distributed tracing records a request as a tree of spans: a parent session, with each model call, retrieval operation, and tool execution nested beneath it. That structure shows where latency accumulates and which step produced a poor output, which matters most in multi-step agent workflows where a single response hides many operations.
How is AI observability different from LLM evaluation?
LLM evaluation measures output quality against defined criteria, usually pre-release and against curated datasets. Observability captures what happens in production. The two connect when production traces become evaluation datasets and evaluators run continuously against live traffic. Maxim's simulation and evaluation suite treats them as one workflow.
Which AI observability tools are open source?
Langfuse, Arize Phoenix, and Comet Opik are all open source and self-hostable, which suits teams with data residency or sovereignty requirements. LangSmith offers self-hosted and bring-your-own-cloud deployment without being open source. Maxim AI is a managed platform with self-hosted options for enterprise deployments.
How does human review fit into AI observability?
Automated evaluators handle scale, but high-stakes decisions still need human judgment. Human-in-the-loop review routes flagged traces to reviewers, whose ratings become labeled data that improves both the application and the automated evaluators. Maxim supports human review alongside automated scoring for last-mile quality checks.
Ship AI Agents with Confidence
Production AI requires observability that covers experimentation, simulation, evaluation, and monitoring. Maxim delivers the complete platform that engineering and product teams need to build reliable AI applications.
Request a demo to see how Maxim accelerates AI development, or sign up free to start monitoring your AI systems today.