Debunking Litellm Rust benchmarking - Part 1
Akshay Deo
Nov 01, 2026 · 13 min read
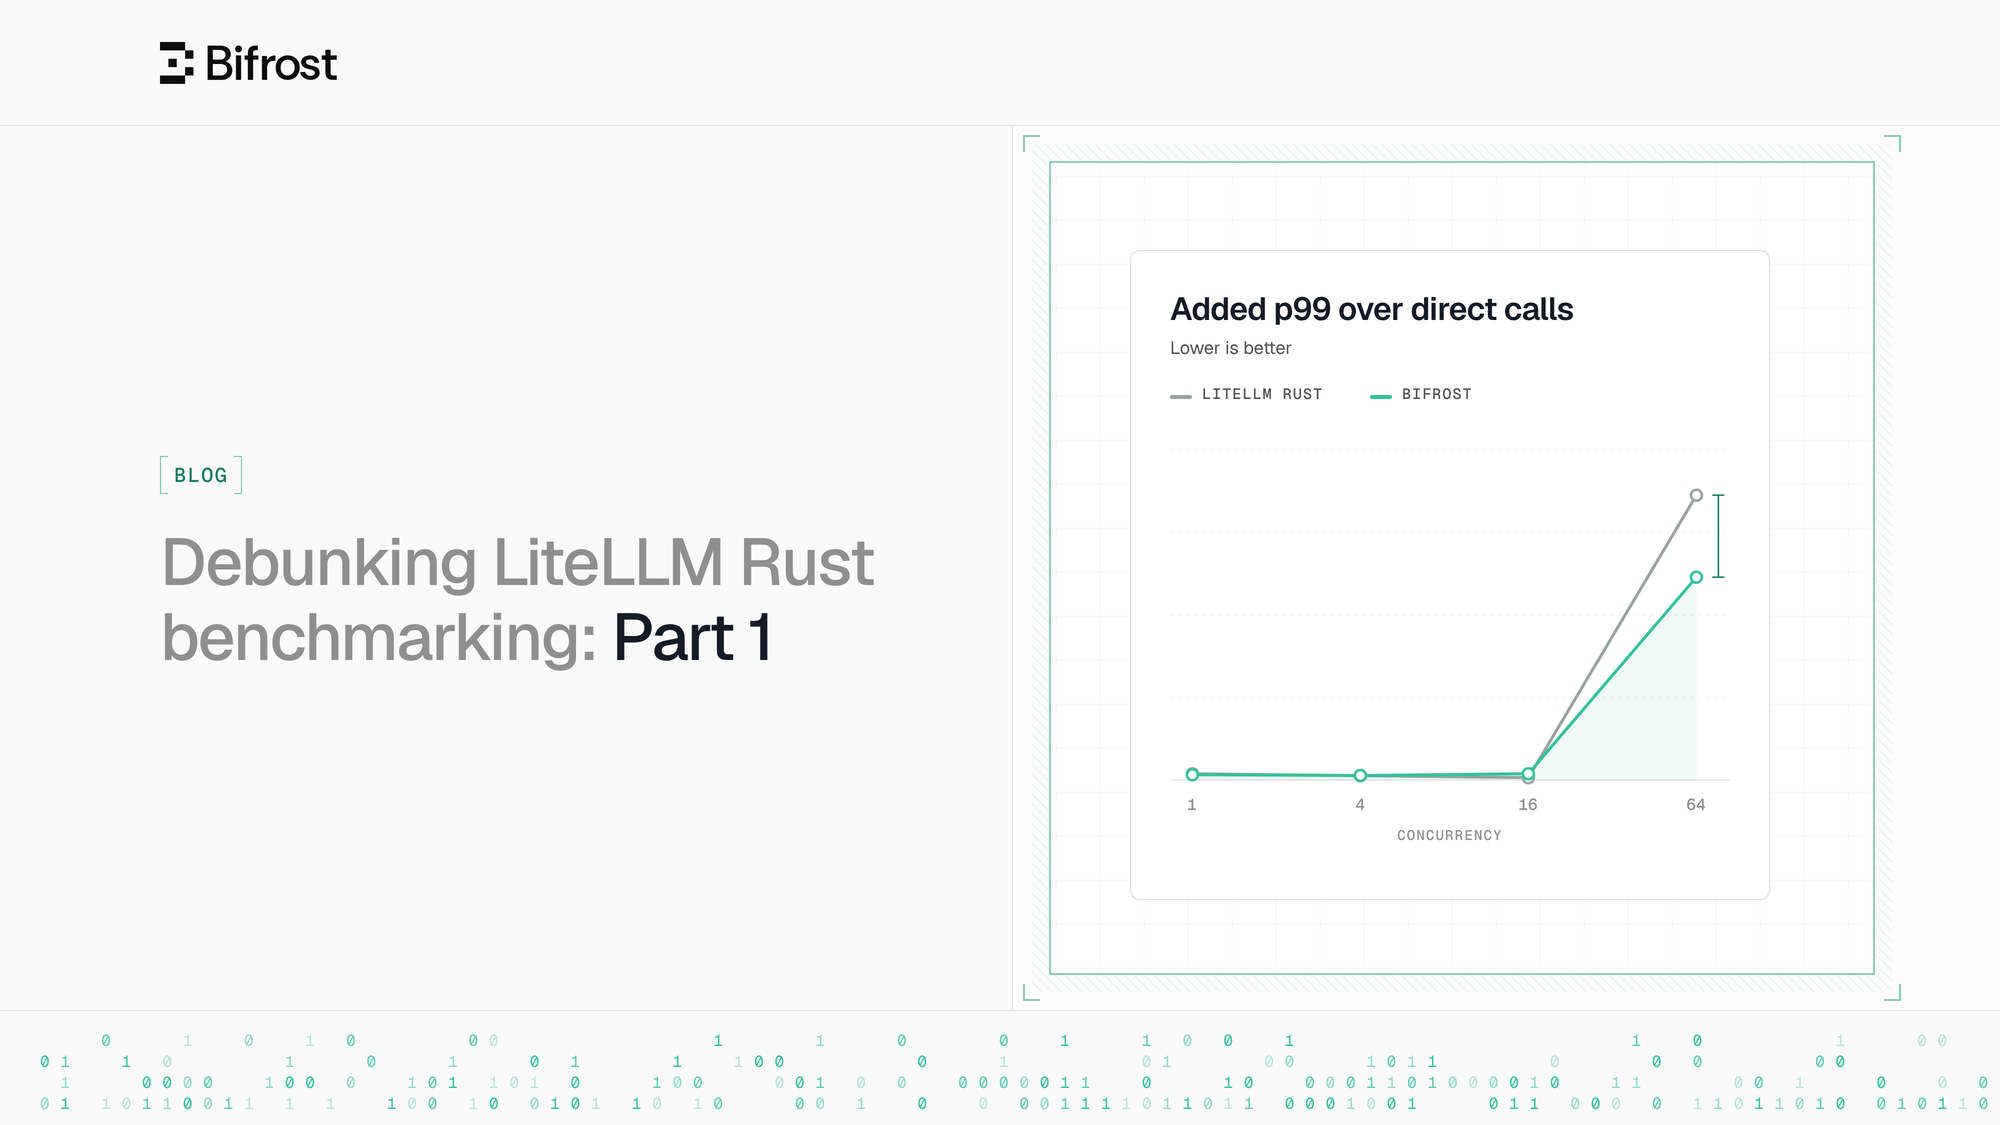
LiteLLM says its new Rust gateway has about 7x lower overhead, 9x less memory and about 4.5x more requests per dollar than Bifrost. We checked those claims against their website, their blog post and the CSV and JSON files in their own ai-gateway-bench repo (2026-11-01).
- This post covers their benchmark only.
- In Part 2 we will run the same benchmarks with full disclosure and a like-for-like setup.
- LiteLLM’s Rust port is still a partial migration. As checked on November 1, 2026, GitHub’s language breakdown for BerriAI/litellm shows 84.88% Python, 3.11% Rust and 12.01% other languages, measured by source-code bytes. This includes tests and supporting code; it does not mean 3.11% of features or traffic run on Rust.
- The benchmark therefore measures a narrower Rust beta, not the full LiteLLM product rewritten in Rust. LiteLLM's benchmark blog says every gateway ran "with no logging callbacks, spend tracking, or persistence enabled". Those results cannot establish the performance of the complete production feature set. Benchmark methodology. Its current Rust docs also retain older coverage descriptions beneath the warning above, so deployment claims need a specific version.
LiteLLM's own migration tracker reports 24% of Major APIs built as of v1.107.0-rc.2 (35.4 of 146 weighted engineering points).
| Area | Published state |
|---|---|
| Routes actually using Rust | The current gateway documentation warns that the Python proxy on main:latest uses Rust for /ocr across providers and /audio/transcriptions for Bedrock. Other routes, including Messages and Chat Completions, run on Python; their per-model rust: true flag currently has no effect. |
| Implemented Rust components | Core infrastructure includes HTTP, streaming, tracing, model catalog and config parsing. Provider translation, auth, caching, cost calculation and logging have varying levels of implementation. Their presence does not establish an end-to-end Rust request path. |
| Incomplete migration | The tracker lists router migration, database access, budgets and rate limits, and database-backed configuration at 0%. The existing Python proxy still owns authentication, routing, logging, callbacks and spend tracking while Rust coverage develops. |
TL;DR
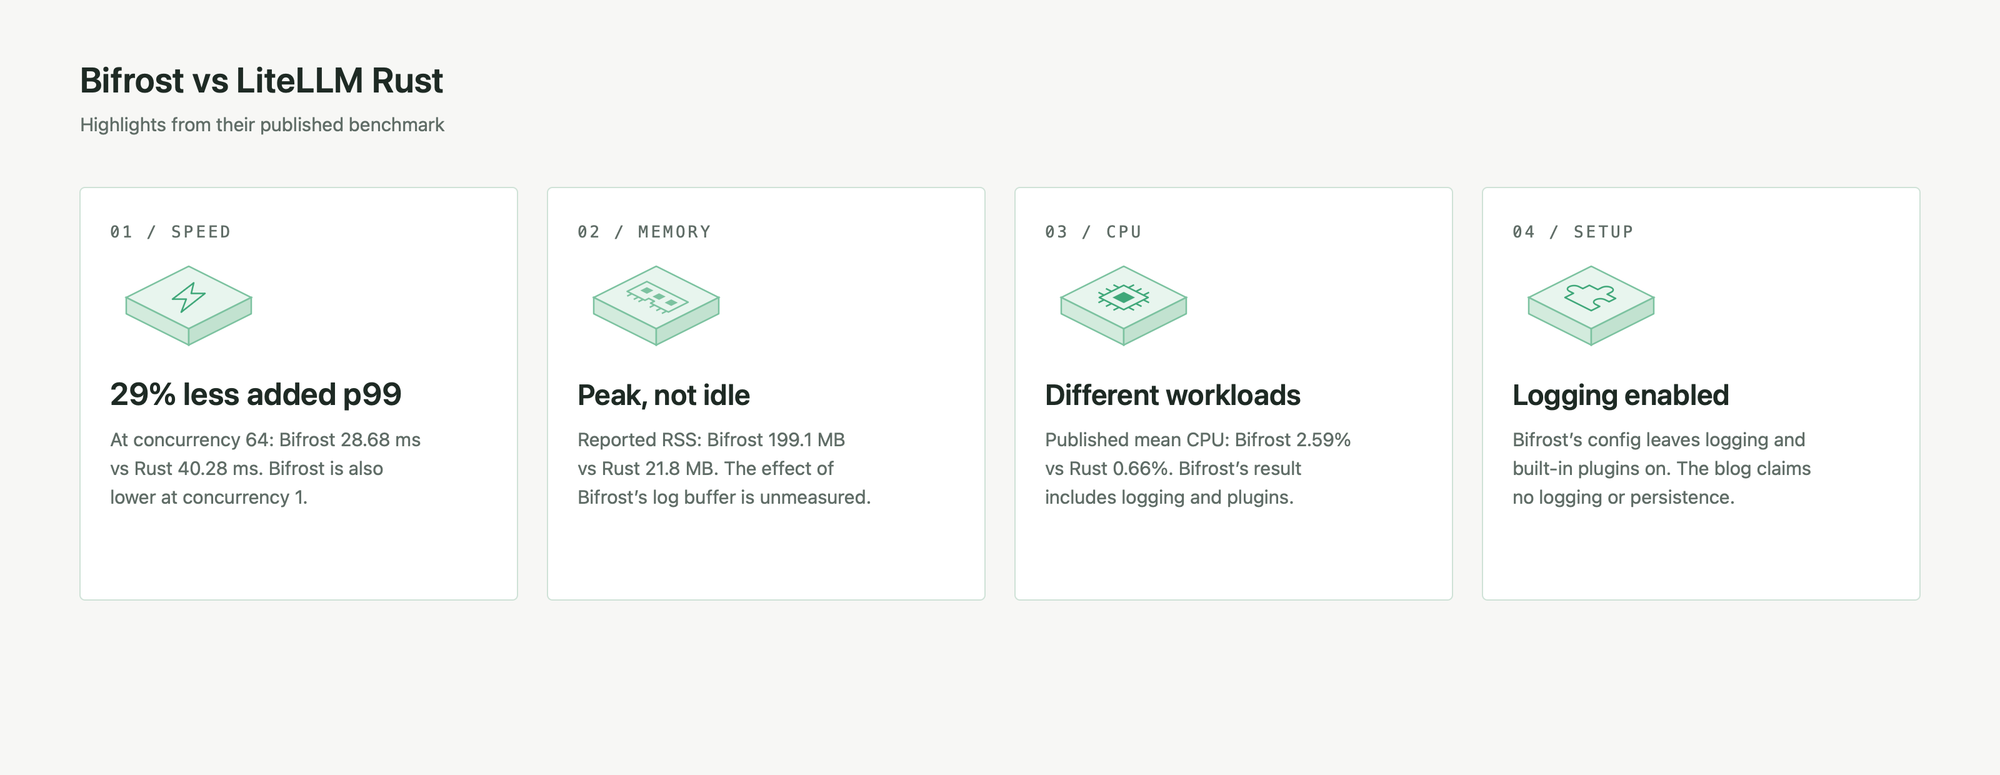
- In their own latency sweep, Bifrost adds less p99 latency than LiteLLM Rust at concurrency 1 (+0.75 ms vs +0.89 ms) and at concurrency 64 (+28.68 ms vs +40.28 ms, about 29% less). Throughput at 64 differs by about 0.1% (2,719 vs 2,722 RPS).
- The blog’s “roughly 7x lower overhead” claim against Bifrost rests on a 4.54 ms figure that no row of their concurrency sweep reproduces. Separately, the benchmark section on LiteLLM’s homepage claims “3.5x lower overhead than the next AI gateway.” That comparison is against Portkey (2.29 ms versus Rust’s 0.66 ms), not Bifrost.
- Bifrost ran with logging and its built-in plugins on. LiteLLM ran with logging and callbacks off. Each cell appears to be a single run (no repeats or error bars are published).
- "Memory at rest" is really peak RSS, and the page uses the widest of the three Bifrost/Rust memory pairs in their files. The "single client" footnote is wrong.
- Rust records lower CPU and memory usage, but the configurations perform different work:
- Bifrost’s default logging adds buffering and SQLite writes, while LiteLLM reports logging and persistence disabled. SQLite also contributes memory independently of the logging queue.
- Bifrost v1.6.4 opens a disk-backed
logs.dband runs migrations at startup, configuring_cache_size=10000: a suggested cache limit of 10,000 pages per connection, approximately 39.1 MiB at a 4 KiB page size. That cache grows on demand; it is neither preallocated in full nor evidence that the entire database is loaded into RAM. SQLite’s caches and connection state can therefore contribute to baseline RSS before benchmark traffic. The files do not quantify that contribution or isolate logging’s share of the gap. Bifrost SQLite setup; SQLite cache semantics
- At concurrency 16, Rust’s added p99 latency is 0.56 ms lower (+0.33 vs +0.89 ms). It also records lower latency at 256, but that single run was excluded from the sweep because the direct baseline itself exceeded the benchmark’s latency threshold. These results describe the tested configurations; they do not establish an equivalent-feature performance advantage.
The setup was not like-for-like
The blog says every gateway ran "with no logging callbacks, spend tracking, or persistence enabled". Their Bifrost config sets a mock provider, config_store: enabled: false and no plugins. It never sets logs_store or enable_logging. What our repo does with that config:
| Setting | What Bifrost does by default | Where in our repo |
|---|---|---|
enable_logging | Defaults to truewhen unset | transports/bifrost-http/lib/config.go lines 846 and 1500; config_test.go line 21820 |
logs_store missing | Creates a default SQLite log store (the stored-config lookup is skipped when the config store is nil, as in their setup) | config.go line 1354 onward |
| Logging plugin | Loads when enable_loggingis nil or true anda log store exists. It is built in, so "no plugins" in their config does not turn it off | transports/bifrost-http/server/plugins.go line 264 |
| Other built-in plugins | Telemetry is on unless disabled. Governance is on in OSS. Routing loads with governance. Compat is always registered. The model catalog resolver loads when a model catalog is configured. Prompts needs a config store, so it is off here. OTel, semantic cache and Maxim load only when configured | plugins.go lines 236 to 363 |
config_store.enabled: false | Only leaves the config store nil. It does not turn off the log store or the plugins | config.go lines 1301 to 1331; docs/quickstart/gateway/setting-up.mdx |
disable_content_logging | Defaults to false, so request and response bodies are logged too | config_test.go line 21821 |
The published Bifrost configuration leaves logging enabled, contrary to the blog’s stated setup. Its results therefore include log buffering and SQLite writes. A controlled rerun is needed to measure their contribution; disabling logging alone does not remove other plugins’ hooks.
Latency: comparable throughput, mixed p99 results
Added p99 latency over a direct call, in ms (lower is better). Source: latency_vs_concurrency.csv. All error counts are 0.
| Concurrency | Direct p99 | LiteLLM Rust | Bifrost | LiteLLM Python |
|---|---|---|---|---|
| 1 | 21.98 | +0.89 | +0.75 | +9.79 |
| 4 | 22.42 | +0.61 | +0.63 | +26.95 |
| 16 | 22.67 | +0.33 | +0.89 | +251.34 |
| 64 | 24.02 | +40.28 | +28.68 | +546.04 |
Highlighted rows: Bifrost adds less latency than Rust.
Throughput (requests per second, higher is better):
| Concurrency | Direct | LiteLLM Rust | Bifrost | LiteLLM Python |
|---|---|---|---|---|
| 1 | 46.2 | 45.2 | 44.8 | 34.4 |
| 4 | 184.5 | 181.2 | 180.2 | 92.7 |
| 16 | 735.6 | 721.8 | 722.7 | 158.4 |
| 64 | 2855.7 | 2722.2 | 2719.1 | 179.8 |
- Concurrency 1 to 16: Bifrost adds +0.75, +0.63 and +0.89 ms, under 4% of the roughly 22 ms direct p99.
- Where Bifrost is slower: at concurrency 16 Rust is lower (+0.33 ms vs +0.89 ms, a 0.56 ms difference, 2.7x the added latency but about 2.4% of total p99). At 4 the gap is 0.02 ms, which is noise.
- Throughput: every Bifrost gap to Rust is under 1% (44.8 vs 45.2 RPS at 1, 180.2 vs 181.2 at 4, 2719 vs 2722 at 64, 0.1% lower). At 64 Bifrost keeps 95.2% of direct and Rust 95.3%. With one run per cell and no confidence intervals, these gaps are noise.
- LiteLLM Python adds 546 ms at concurrency 64, about 13.6x the Rust port, and reaches 180 RPS (6% of direct). The honest reading of this CSV is "LiteLLM Rust caught up to where Bifrost already was", not "Rust beats Bifrost".
Memory: where the 177 MB gap comes from
The reported RSS figures—199.1 MB for Bifrost and 21.8 MB for Rust—differ by 177.3 MB. They do not establish how much, if any, of that gap comes from logging buffers; that requires profiling and a logging-off comparison. In v1.6.4, the writer flushes at 1,000 entries, 5 seconds from the first entry, or 300 MiB of estimated payload, whichever comes first. A 10,000-entry queue brings queue-plus-batch capacity to approximately 11,000 entries; new entries are dropped when the queue is full. These are entry-count bounds and an approximate batch threshold, not a total memory cap.
Setting logs_store.writer.max_batch_size: 100, batch_interval: "1s" and write_queue_capacity: 1000lowers that capacity to approximately 1,100 entries—not necessarily 10x lower RSS—and can increase write overhead and log drops under bursts.
client_config.disable_content_logging: true reduces logged payloads. client_config.enable_logging: false removes the built-in logging plugin’s queue and hooks at startup; other plugins remain enabled independently.
Claims on the litellm.ai page
The tables below distinguish claims on LiteLLM’s homepage from claims in its benchmark blog, with the supporting data linked for each.
| What the page says | What their files show (Bifrost vs Rust) | Verdict | Screenshot and data |
|---|---|---|---|
| Overhead: Bifrost 4.54 ms, Rust 0.66 ms (6.9x is our own ratio, not on the page) | 4.544 vs 0.66 ms in overhead_comparison.csv.The sweep shows +0.75, +0.63, +0.89, +28.68 ms for Bifrost and +0.89, +0.61, +0.33, +40.28 ms for Rust. | Not reproducible from their own sweep. No row is near 4.54 ms, and Bifrost is lower at 1 and 64. The CSV states no concurrency. | litellm.ai#benchmark, overhead_comparison.csv, latency_vs_concurrency.csv |
| "3.5x lower overhead than the next AI gateway" | Not Bifrost. 0.66 ms vs the next gateway on the chart at 2.29 ms (2.29 / 0.66 = 3.5x), which is Portkey. Against Bifrost their files give 6.9x. | The 3.5x is not a Bifrost number. The page's 3.5x and the blog's "roughly 7x" are two different comparisons. | litellm.ai#benchmark, overhead_comparison.csv |
| "Memory at rest" about 22 MB vs about 199 MB. Chart note: "resident memory with the gateway idle" | 199.1 vs 21.8 MB (mem_bifrost_messages.csv and mem_litellm_rust_release.csv).Other pairs: 144 vs 26.1 MB (mem_bifrost.csv, mem_litellm_rust.csv) and 282 to 298 vs 35 to 36 MB ( cpu_*.csv). | Mislabeled. The same chart says "memory at rest", "peak RSS" and "idle", and the column is peak_rss_mb. The page uses the widest pair: 9.1x vs 5.4x and 8.3x. The pairs may come from different scenarios or builds, so we call out the label, not the headline. | litellm.ai#benchmark, mem_*.csv, cpu_*.csv |
| Throughput:Rust "2,800+ req/s", Bifrost cell is a dash | 2,744 (Bifrost) vs 2,814 (Rust) req/s in rps_per_dollar.csv. Sweep at 64: 2,719 vs 2,722. | The blank cell hides a gap of 2.5% or less (2.5% in one file, 0.1% in the sweep). | rps_per_dollar.csv |
| Footnote "single client" and "2,800+ req/s (at ~21% CPU)" | cpu_bifrost.csv: mean 2.59% peak 79.5%.cpu_rust.csv: mean 0.66%, peak 15.9%.(averaged over a 30 s window, about 2.3 s of it active),Cost runs (1,000 requests, concurrency 16): Bifrost p50 22.99 ms, p99 262.4 ms; Rust p50 22.48 ms, p99 263.9 ms. | "Single client" is misleading: the sweep runs concurrency 1 to 64 and the throughput point uses ceiling_concurrency = 64, so it is not one connection at a time.cpu_rust.csvpeaks at 15.9%, and none of the Rust CPU, throughput, cost or overhead files we read has a ~21% figure. It does not claim we read every file in results/.Inference, not confirmed: the CPU samples appear to come from a short burst, probably the concurrency-16 cost runs, so CPU may be paired with a different load than the 2,800 req/s. | litellm.ai#benchmark, cpu_bifrost.csv, cpu_rust.csv |
| "Identical hardware", "Run it yourself", "See the benchmark" link | No machine type, core count or worker count given for either gateway. | Cannot be checked from the page. The link goes to the in-page anchor #benchmark, not to the raw data or a methodology doc. | litellm.ai#benchmark |
| "~4.5x more requests per dollar" | 283,833 vs 63,246 requests per dollar-hour; $0.0099 vs $0.0434 per hour (rps_per_dollar.csv). | The arithmetic holds (283,833 / 63,246 = 4.5x), but it is a model. The page does not show the inputs, and Bifrost's logging cost is inside them. | litellm.ai#benchmark, rps_per_dollar.csv |
| Bifrost version:none shown | v1.6.4 from a minimal config. Our changelogs list v1.6.5 to v1.6.11, then v2.0.0 to v2.4.0. | Old Bifrost build, hidden on the page.The version is only in the blog and the gateway README. | gateways/bifrost/README |
Claims in the blog post
| What the blog says | What their files show (Bifrost vs Rust) | Verdict | Screenshot and data |
|---|---|---|---|
| "No logging callbacks, spend tracking, or persistence enabled"for every gateway. "It is not a full-feature comparison." | Config has a mock provider, config_store: enabled: false, no plugins, no logs_store, no enable_logging.We did not check the LiteLLM Rust config. | Logging and plugins ENABLED for Bifrost vs DISABLED for LiteLLM. Inference from v2.4.0 code, not yet confirmed on v1.6.4. | benchmark blog, gateways/bifrost/ |
| "Roughly 7x lower overhead and 9x less memory than the next-closest gateway (Bifrost)". Overhead "about 0.7ms at p99 against 4.5ms", memory "21.8MB peak memory against 199.1MB" | 4.5 vs 0.7 ms overhead and 199.1 vs 21.8 MB peak memory. The blog defines overhead as gateway latency minus direct-to-mock latency and charts it as p99 added latency. It says the runs are single-host and gives "for example n=5000 on the overhead panel". Portkey: 2.3 ms and 90.4 MB. | The 7x rests on a 4.5 ms figure the sweep does not reproduce.The 9x is the widest of three memory pairs. The blog correctly says "peak memory", unlike the page. | benchmark blog, overhead_comparison.csv |
| "Single-host, per-scenario runs (for example n=5000 on the overhead panel) without repeated-trial error bars", "treat them as order-of-magnitude differences", "a vendor-run benchmark" | Total p99 at concurrency 64: Bifrost 52.7 ms in the sweep vs 32.2 ms in rps_per_dollar.csv; Rust 64.3 ms vs 26.9 ms. | Single runs, so small gaps are not stable. The ranking flips between their own files. The blog admits it, but the page's tiles do not repeat the caveat. No file supports a 7x latency gap at low concurrency. | benchmark blog, latency_vs_concurrency.csv, rps_per_dollar.csv |
| Cost: Rust "about $0.000175, roughly 6x below Bifrost ($0.001008)". "Estimated USD per one million requests from measured CPU, peak RSS, and sustained throughput on a 4 vCPU / 16 GB instance." "Excludes token cost." | $0.001008 (Bifrost) vs $0.000175 (Rust) per 1M requests on the cost chart. Portkey is $0.001042. rps_per_dollar.csv has $0.0434 vs $0.0099 per hour, and 63,246 vs 283,833 requests per dollar-hour. | An estimate, not a measurement.0.001008 / 0.000175 is about 5.8x, and the page's 4.5x is a different metric (per dollar-hour). The "4 vCPU / 16 GB" is a modeling assumption, not the benchmark machine. Bifrost's logging cost is in the inputs. | benchmark blog, rps_per_dollar.csv |
| Versions: "LiteLLM Rust beta, LiteLLM Python v1, Bifrost v1.6.4, current Portkey OSS". "An early beta, streaming and the full feature surface are still landing." | Bifrost v1.6.4 from a minimal config. Our changelogs list v1.6.5 to v1.6.11, then v2.0.0 to v2.4.0. | Old Bifrost build, compared with a beta that has no streaming yet. The blog names no Python v1 version and no hardware. | benchmark blog, gateways/bifrost/README |
| Method: "Same mock and load driver on one host." | No machine type, core count or worker count. No mock latency or concurrency level for the overhead run. | Cannot be reproduced from the text alone. The "4 vCPU / 16 GB" appears only in the cost model. The blog does not mention dropping concurrency 256, but the repo's top-level README does. | benchmark blog |
Where Rust leads in their results, and what the benchmark does not isolate!
- CPU: Bifrost averages 2.59% (peak 79.5%) versus Rust’s 0.66% (peak 15.9%): approximately 3.9x the mean and 5x the peak. These are whole-process measurements under the configurations described above. The Bifrost peak falls inside the roughly two-second request burst; the files do not separate request handling from background work.
- Memory: Rust is smaller in every file. Its highest figure (about 36 MB) is below Bifrost's lowest (about 144 MB).
- Bifrost's RSS is already ~282 MB before the first request in
cpu_bifrost.csv, and load adds only ~16 MB. That points primarily to a baseline footprint rather than growth in the log buffer, although RSS alone cannot identify which components account for it. Bifrost 2.x has since substantially reduced memory usage by optimizing what data we retain and how we store it in memory. Their v1.6.4 benchmark does not reflect those improvements. Part 2 will quantify the difference on a current build, with logging on and off and heap profiles to explain the remaining footprint.
- Bifrost's RSS is already ~282 MB before the first request in
- Cost: The modeled footprint is $0.0434 per hour for Bifrost versus $0.0099 for Rust, a 4.4x ratio. This is derived from resource measurements, rather than an independent result demonstrating the same savings in production.
- Concurrency 256: they dropped it from the sweep because the direct baseline's p99 at 256 exceeded twice the single-client floor (per the repo README), but a c256 JSON file for each gateway is still in
results/:- p50: direct 48.1 ms, Rust 55.5 ms, Bifrost 89.3 ms, LiteLLM Python 1,513 ms. Rust is about 1.6x better than Bifrost.
- p99: direct 434.8 ms, Rust 2,667.8 ms, Bifrost 5,421.3 ms, LiteLLM Python 10,733.6 ms. Rust is about 2.0x better than Bifrost. Bifrost is still about 17x better than LiteLLM Python at p50 and 2x better at p99.
- Caveats: One run of 5,000 requests per gateway, no errors and no RPS field. With the direct baseline already outside the benchmark’s threshold, this is an exploratory result rather than a reliable capacity comparison.
How to read their setup
- The sweep file has only p99 and each cell looks like one run. The per-run JSON files in
results/also carry p50. - Bifrost was called on its native /anthropic/v1/messages route. Their gateways/bifrost README says v1.6.4 does not mount that integration at /v1/messages, and they did not use a proxy rewrite.
- No hardware, worker or core counts are stated for the benchmark runs of any gateway. Only the cost model assumes a 4 vCPU / 16 GB instance.
What we will do in Part 2
- Run both gateways with logging off, and again with logging on.
- Use a current Bifrost build, repeated trials and error bars.
- Publish hardware, worker counts, mock latency and concurrency for every run.
- Take a heap profile to measure how much of the memory gap is the log buffer.