Maximizing AI Agent Observability: How to Set Up the Custom Dashboard on Maxim for End-to-End Monitoring
TL;DR
Setting up the dashboard on Maxim for AI agent observability enables engineering and product teams to monitor, debug, and optimize agentic workflows in real time. By leveraging distributed tracing, custom dashboards, and advanced evaluation features, Maxim AI empowers teams to ensure reliability, transparency, and rapid iteration for their AI applications. This guide provides a step-by-step approach to configuring the custom dashboard on Maxim for best-in-class agent observability, with authoritative references to Maxim AI and its documentation.
Introduction
AI agent observability is critical for building trustworthy, high-performing applications. As agentic systems become more complex, incorporating LLMs, RAG pipelines, and external tool integrations traditional monitoring tools often fall short. Maxim AI offers a comprehensive platform for distributed tracing, agent evaluation, and real-time monitoring, designed to meet the needs of AI engineers, product managers, and cross-functional teams. This blog outlines how to set up the custom dashboard on Maxim for superior agent observability, drawing on best practices and the latest features from Maxim AI.
How to Structure Your Log Repository for Agent Observability
This section walks you through organizing log repositories for optimal agent observability using Maxim AI’s dashboard. It’s designed as a practical how-to, with step-by-step instructions that align with the product’s UI.
Here’s how to organize your log repositories for optimal observability:
- Create dedicated repositories: Segment logs by environment (production, development) or by application/service. This approach simplifies search, analysis, and troubleshooting. For example, maintain separate repositories for production and development logs, or for distinct services managed by different teams.
- Leverage the Overview tab: The dashboard’s Overview tab provides a snapshot of key metrics, including total traces, usage, user feedback, latency, and error rates. Use this view to monitor the health and performance of your agents over time.
- Utilize the Logs tab: Access detailed, tabular views of each log entry, including input, output, model, tokens, cost, latency, and user feedback. Click on individual traces for expanded details and evaluation results.
- Configure alerts: Set up real-time alerts for critical metrics (e.g., latency, cost, evaluation scores) and integrate notifications with Slack, PagerDuty, or OpsGenie. This ensures rapid response to performance issues and supports continuous quality assurance.
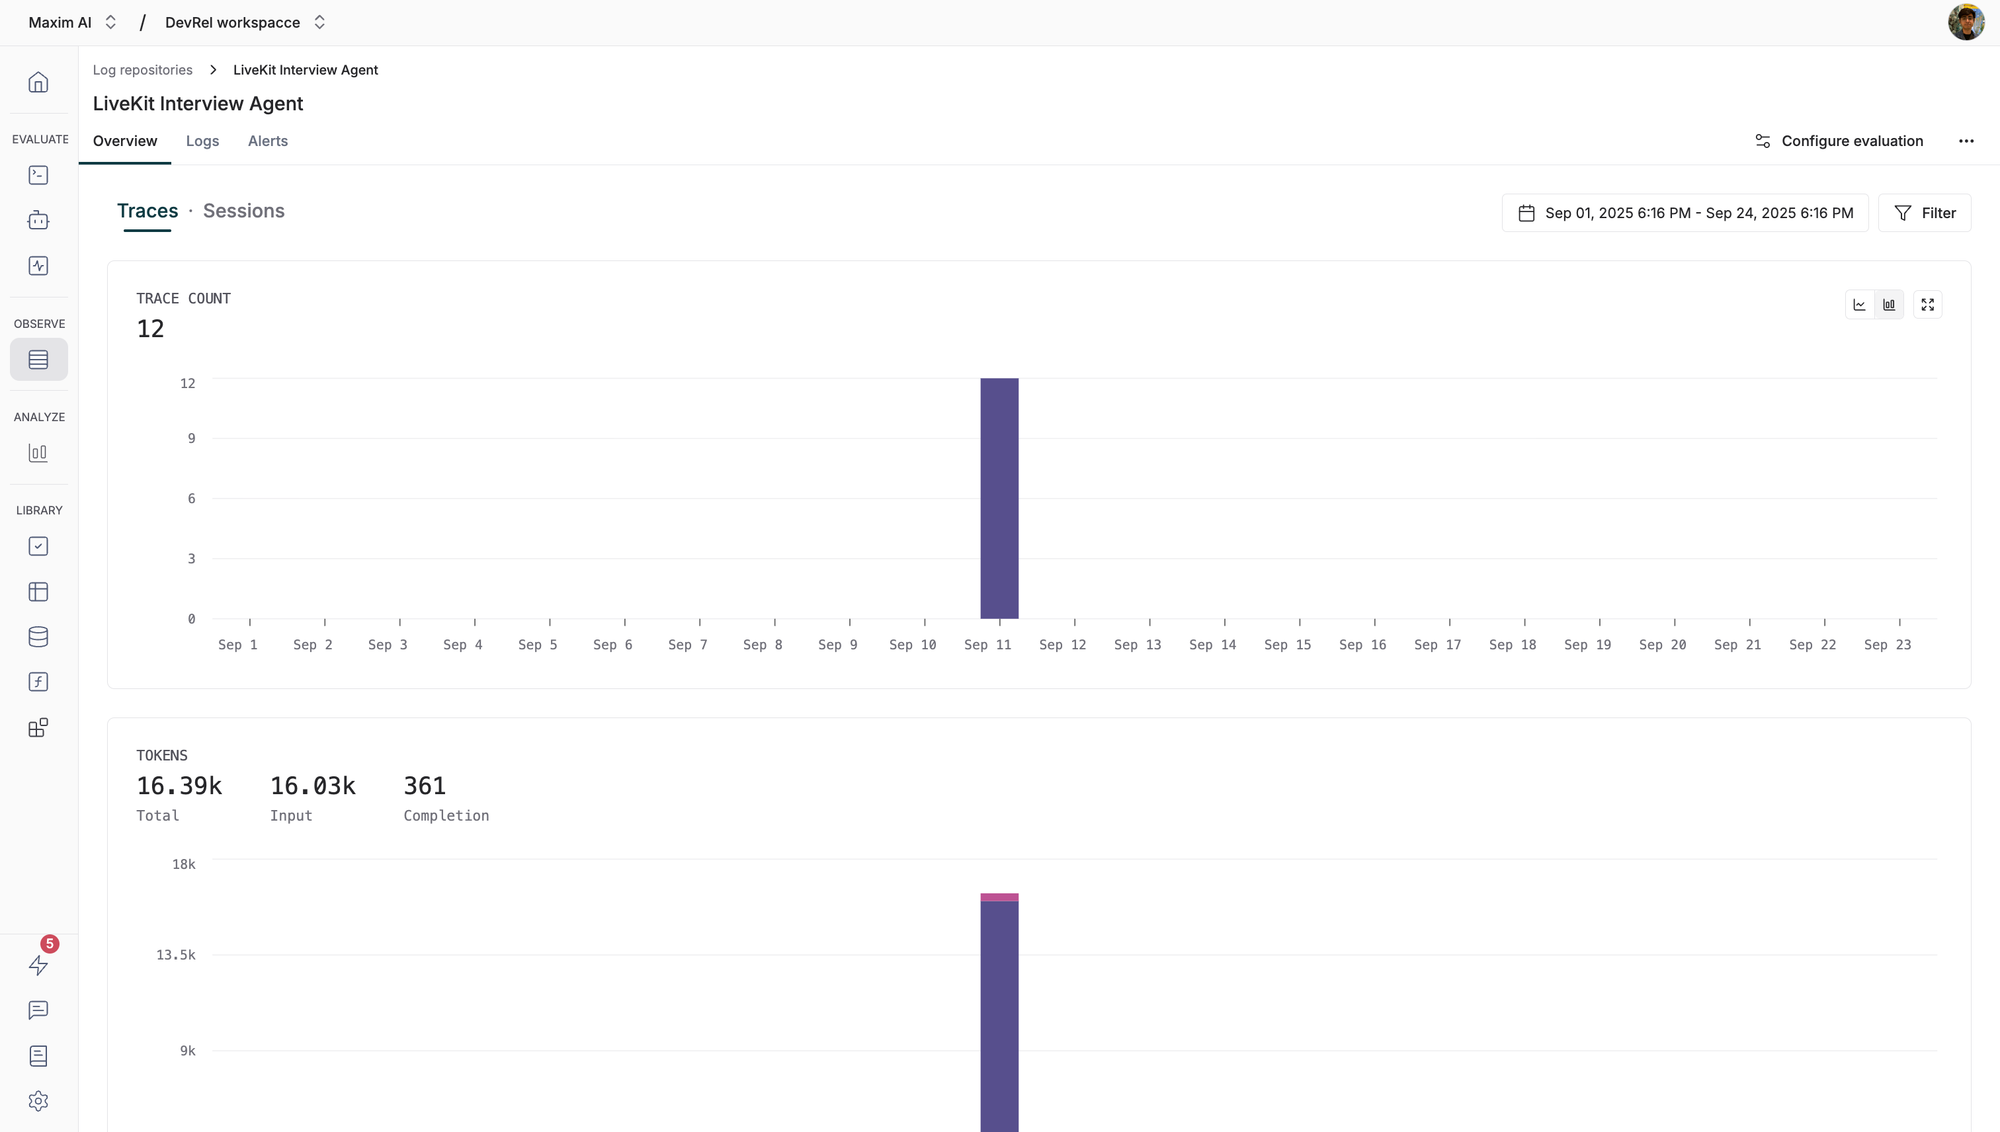
For more details, refer to the Tracing Concepts documentation.
Instrumenting Traces, Spans, and Generations for Deep Visibility
Here’s how to instrument your AI workflows for granular observability:
- Traces: Represent the complete processing of a request. Use unique identifiers (such as request IDs) and add relevant tags for filtering and analysis.
- Spans: Break down traces into logical units of work. Spans can be nested to represent sub-operations within a trace, providing detailed timing and context.
- Generations: Log individual LLM calls, capturing model parameters, input messages, and results. This enables precise monitoring of agent interactions and output quality.
Example setup using the Maxim SDK:
import { Maxim } from "@maximai/maxim-js";
const maxim = new Maxim({ apiKey: "" });
const logger = await maxim.logger({ id: "" });
Setting up Maxim SDK
Instrument every microservice and agentic component to ensure full coverage. For more implementation details, see the Tracing Quickstart guide.
Enhancing Observability with Metadata, Tags, and User Feedback
Here’s how to enrich your logs for better analysis and debugging:
- Metadata: Attach custom key-value pairs to traces, spans, generations, and events. Store additional context, configuration, user information, or custom data to aid debugging and observability.
- Tags: Use tags to group and filter logs by product, experiment, or other dimensions. Tags facilitate efficient search and analysis in the dashboard.
- User Feedback: Collect structured user ratings and comments to measure agent quality and drive improvements. Feedback can be attached directly to traces for easy tracking.
Example for adding metadata and feedback:
const trace = logger.trace({
  id: "trace-id",
  name: "user-query",
  metadata: {
    userId: "user-123",
    sessionId: "session-456",
    model: "gpt-4",
    temperature: 0.7,
    environment: "production"
  }
});

// Add metadata after creation
trace.addMetadata({"customKey":"customValue","timestamp": new Date().toISOString()});
adding metadata
For more on metadata and feedback, see the Metadata documentation and User Feedback guide.
Leveraging Advanced Features: Retrievals, Tool Calls, Events, and Attachments
Here’s how to maximize observability with advanced logging features:
- Retrievals: Track RAG pipeline queries to knowledge bases or vector databases. Log both the input query and the output context for each retrieval operation.
- Tool Calls: Monitor external system calls triggered by LLM responses. Log arguments, results, and errors for each tool call to ensure transparency and traceability.
- Events: Mark significant milestones or state changes within traces and spans. Events provide additional context for understanding agent behavior and system performance.
- Attachments: Add files, URLs, or data blobs to traces and spans for richer context and debugging. Attachments are visible in the Maxim UI and support audit trails.
Example for logging a tool call and event:
const toolCall = completion.choices[0].message.tool_calls[0];
const traceToolCall = trace.toolCall({
    id: toolCall.id,
    name: toolCall.function.name,
    description: "Get current temperature for a given location.",
    args: toolCall.function.arguments,
    tags: { location: toolCall.function.arguments["location"] }
});

try {
    const result = callExternalService(toolCall.function.name, toolCall.function.arguments);
    traceToolCall.result(result);
} catch (error) {
    traceToolCall.error(error);
}
Logging a Tool Call
For more on these features, refer to the SDK documentation.
Monitoring, Filtering, and Exporting Logs for Continuous Improvement
Here’s how to use the dashboard for ongoing agent optimization:
- Search and filter logs: Use the dashboard’s search bar and filter menu to display logs matching specific criteria. Save filter configurations for quick access to common views.
- Export logs and evaluation data: Download logs and associated evaluation metrics as CSV files for external analysis and reporting. Filter exports by date range and log attributes.
- Create custom dashboards: Visualize agent behavior across dimensions such as latency, cost, and evaluation scores. Custom dashboards enable teams to generate insights and optimize agentic systems with ease.
For more on dashboard features, see the Dashboard documentation and Exports guide.
Conclusion
Custom dashboards on Maxim empower teams to analyze agent behavior more effectively and streamline root cause analysis (RCA) through clear visualizations. By surfacing key metrics and trends, these dashboards help teams quickly identify issues, understand performance patterns, and make informed decisions to improve reliability, scalability, and overall application quality. By structuring log repositories, instrumenting traces and spans, enriching logs with metadata and feedback, and leveraging advanced features, teams can monitor, debug, and optimize agentic workflows with unparalleled granularity. Maxim AI’s platform empowers engineering and product teams to collaborate seamlessly, drive continuous improvement, and deliver trustworthy AI at scale.
Ready to elevate your AI agent observability? Book a demo or sign up for Maxim AI today.
Frequently Asked Questions
What is distributed tracing in AI agent observability?
Distributed tracing tracks the complete lifecycle of requests through an AI system, capturing every interaction, decision, and external call. It enables granular monitoring, debugging, and optimization of agentic workflows. Learn more.
How does Maxim AI support distributed tracing?
Maxim AI provides comprehensive distributed tracing for GenAI applications, including traces, spans, generations, retrievals, tool calls, and events. The platform offers real-time monitoring, custom dashboards, and integrations with leading AI frameworks. Read the docs.
Can I monitor agent performance in real time?
Yes. Custom dashboard on Maxim enables real-time monitoring of agent metrics, including latency, cost, token usage, and user feedback. Configure alerts for instant notifications on performance issues. See dashboard features.
How do I export logs and evaluation data from Maxim AI?
Use the dashboard’s export feature to download logs and evaluation data as CSV files, filtered by date range and criteria. This enables external analysis and reporting, making it easy to share insights across teams. You can also leverage Maxim’s APIs for automated data retrieval or integration with other tools, and connect to any OpenTelemetry (OTel) compatible data provider for seamless observability across platforms.
For step-by-step guidance, see the Export guide and Reporting documentation.
Is Maxim AI compatible with OpenTelemetry and other observability platforms?
Yes. Maxim AI supports OTel compatibility, allowing logs to be forwarded to platforms like New Relic for unified observability. Integration details.
