> ## Documentation Index
> Fetch the complete documentation index at: https://www.getmaxim.ai/docs/llms.txt
> Use this file to discover all available pages before exploring further.
# Dashboard
> Learn how to use the dashboard to filter and sort your logs using custom criteria to streamline debugging and create saved views to quickly access your most-used search patterns.
export const MaximPlayer = ({url}) => {
return ;
};
## How to Use The Dashboard?
Filter and sort your logs using custom criteria to streamline debugging. Create saved views to quickly access your most-used search patterns.
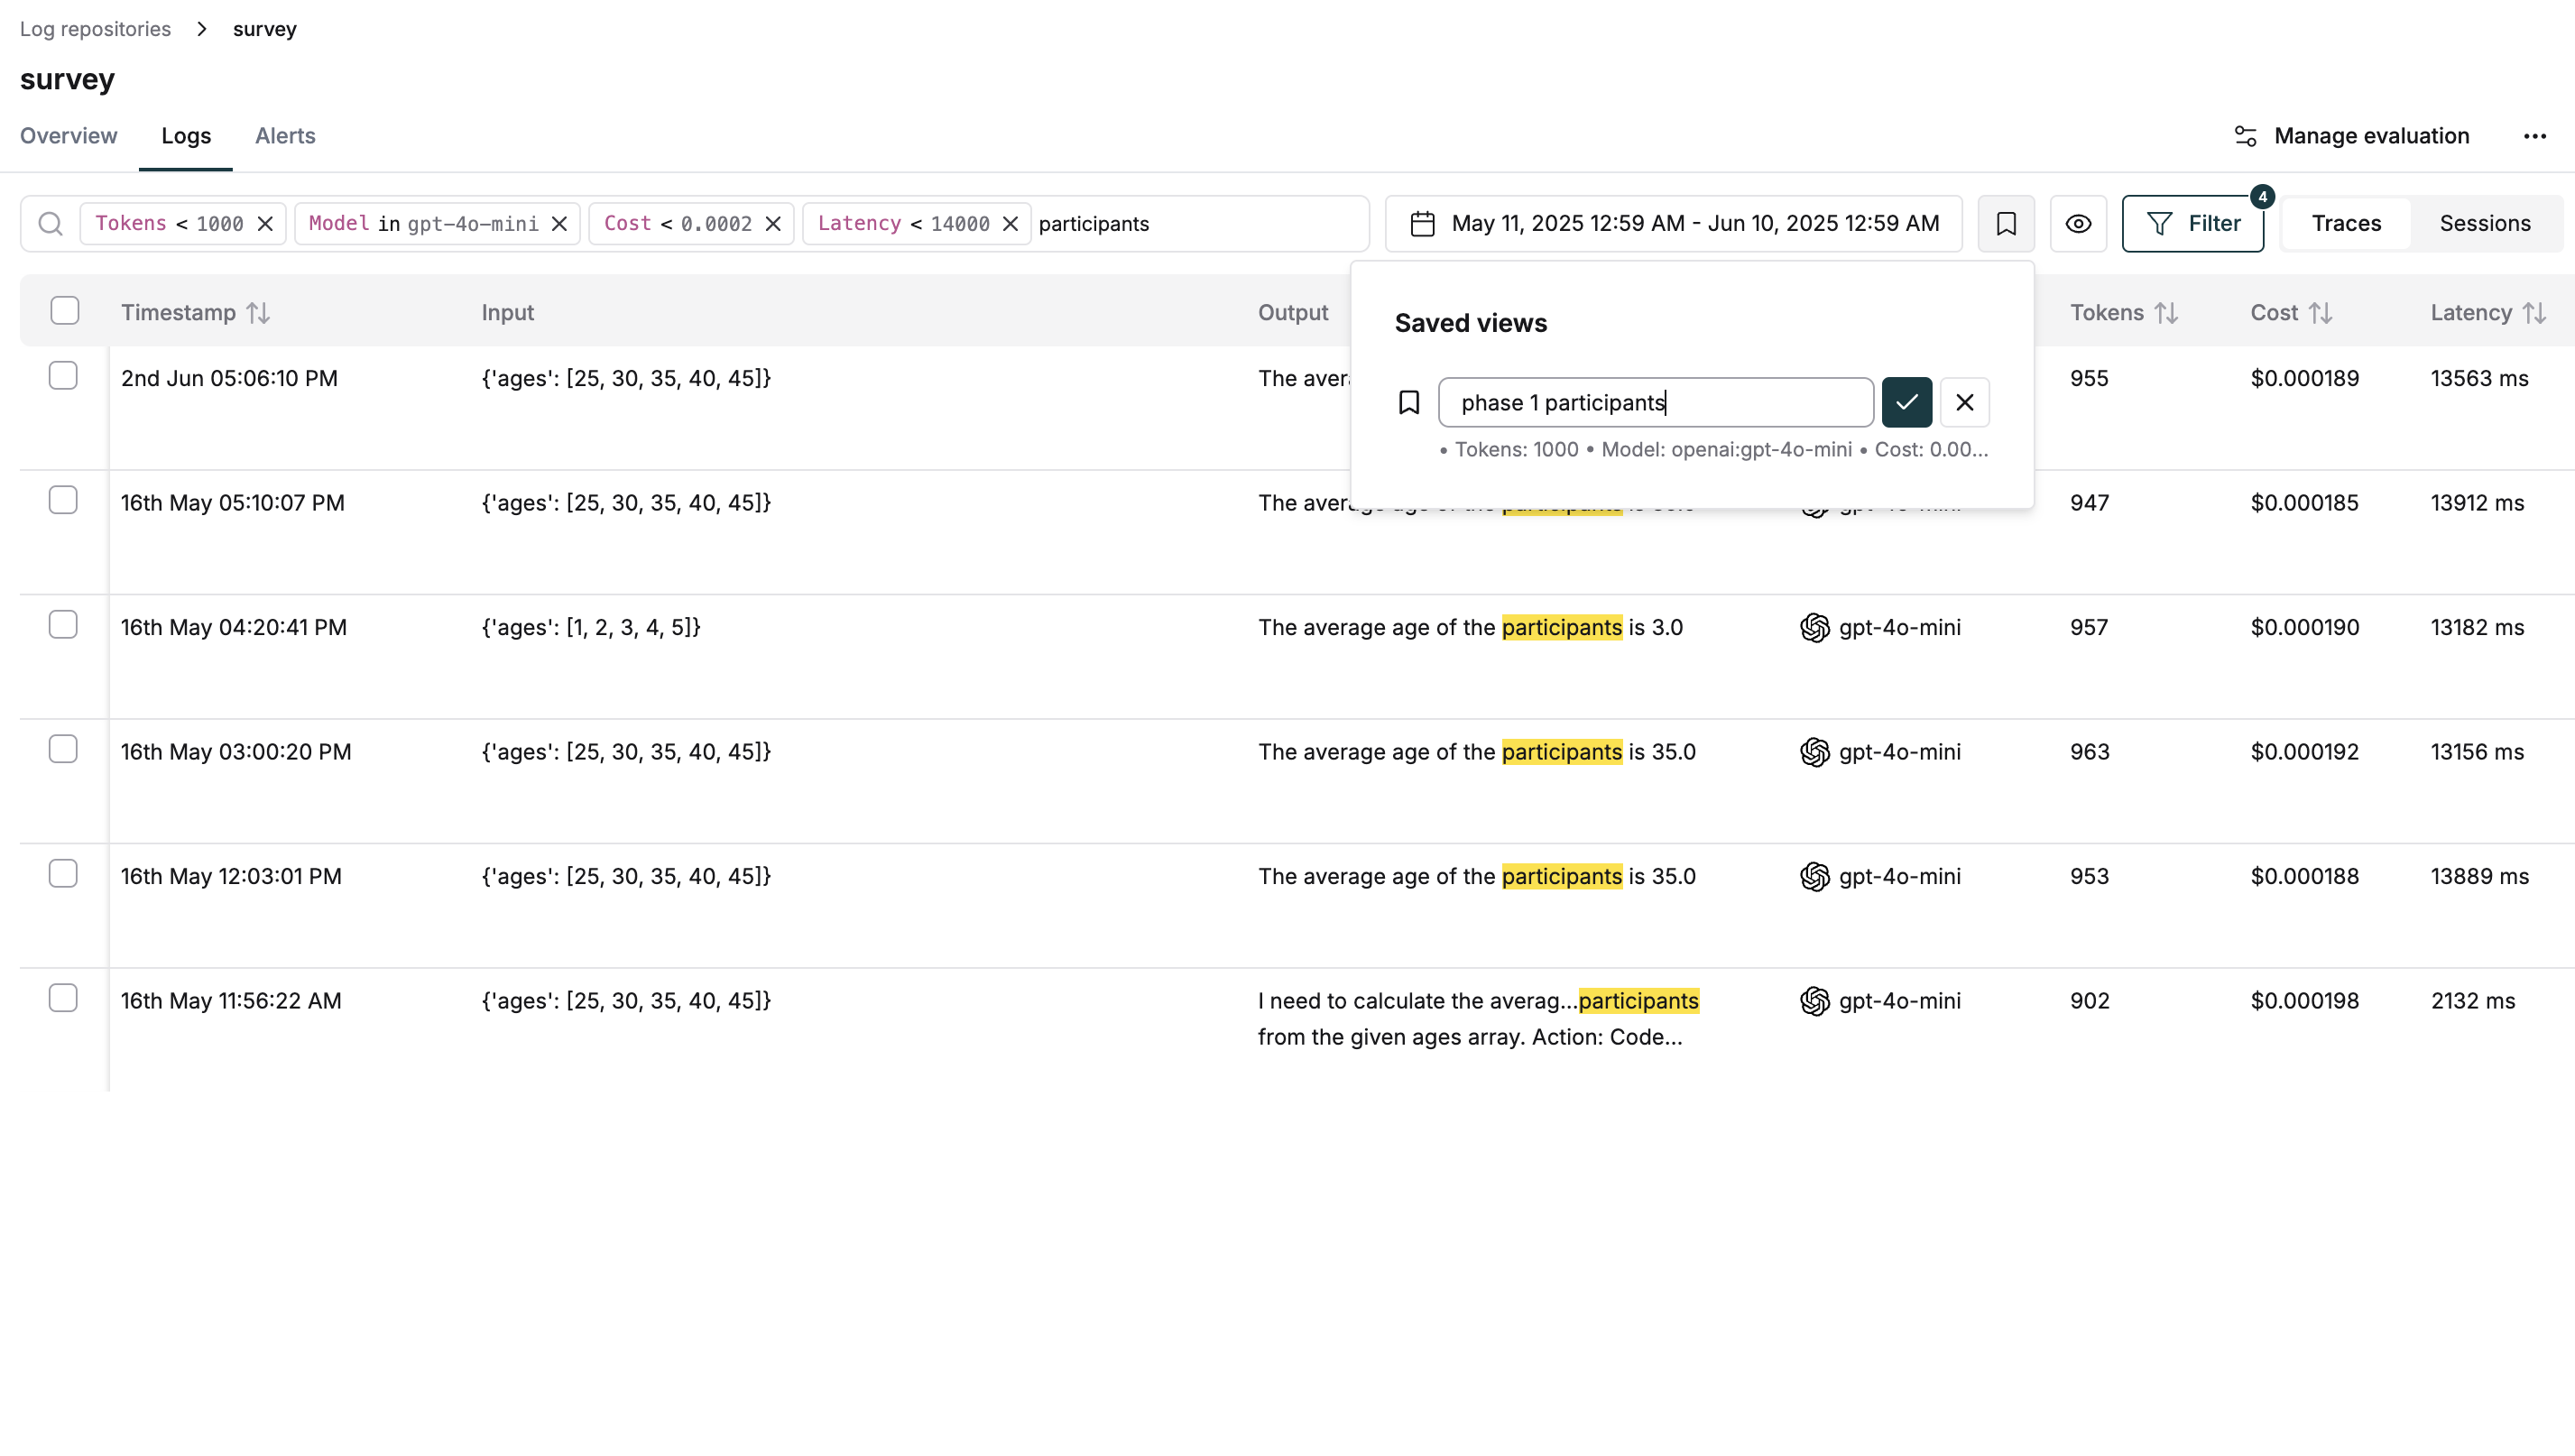
## Create Filters and Saved Views
Open your log repository and type filters directly in the search bar or select from the filter menu
Apply filters to display logs matching your specified criteria
Click the bookmark icon to save your current filter configuration
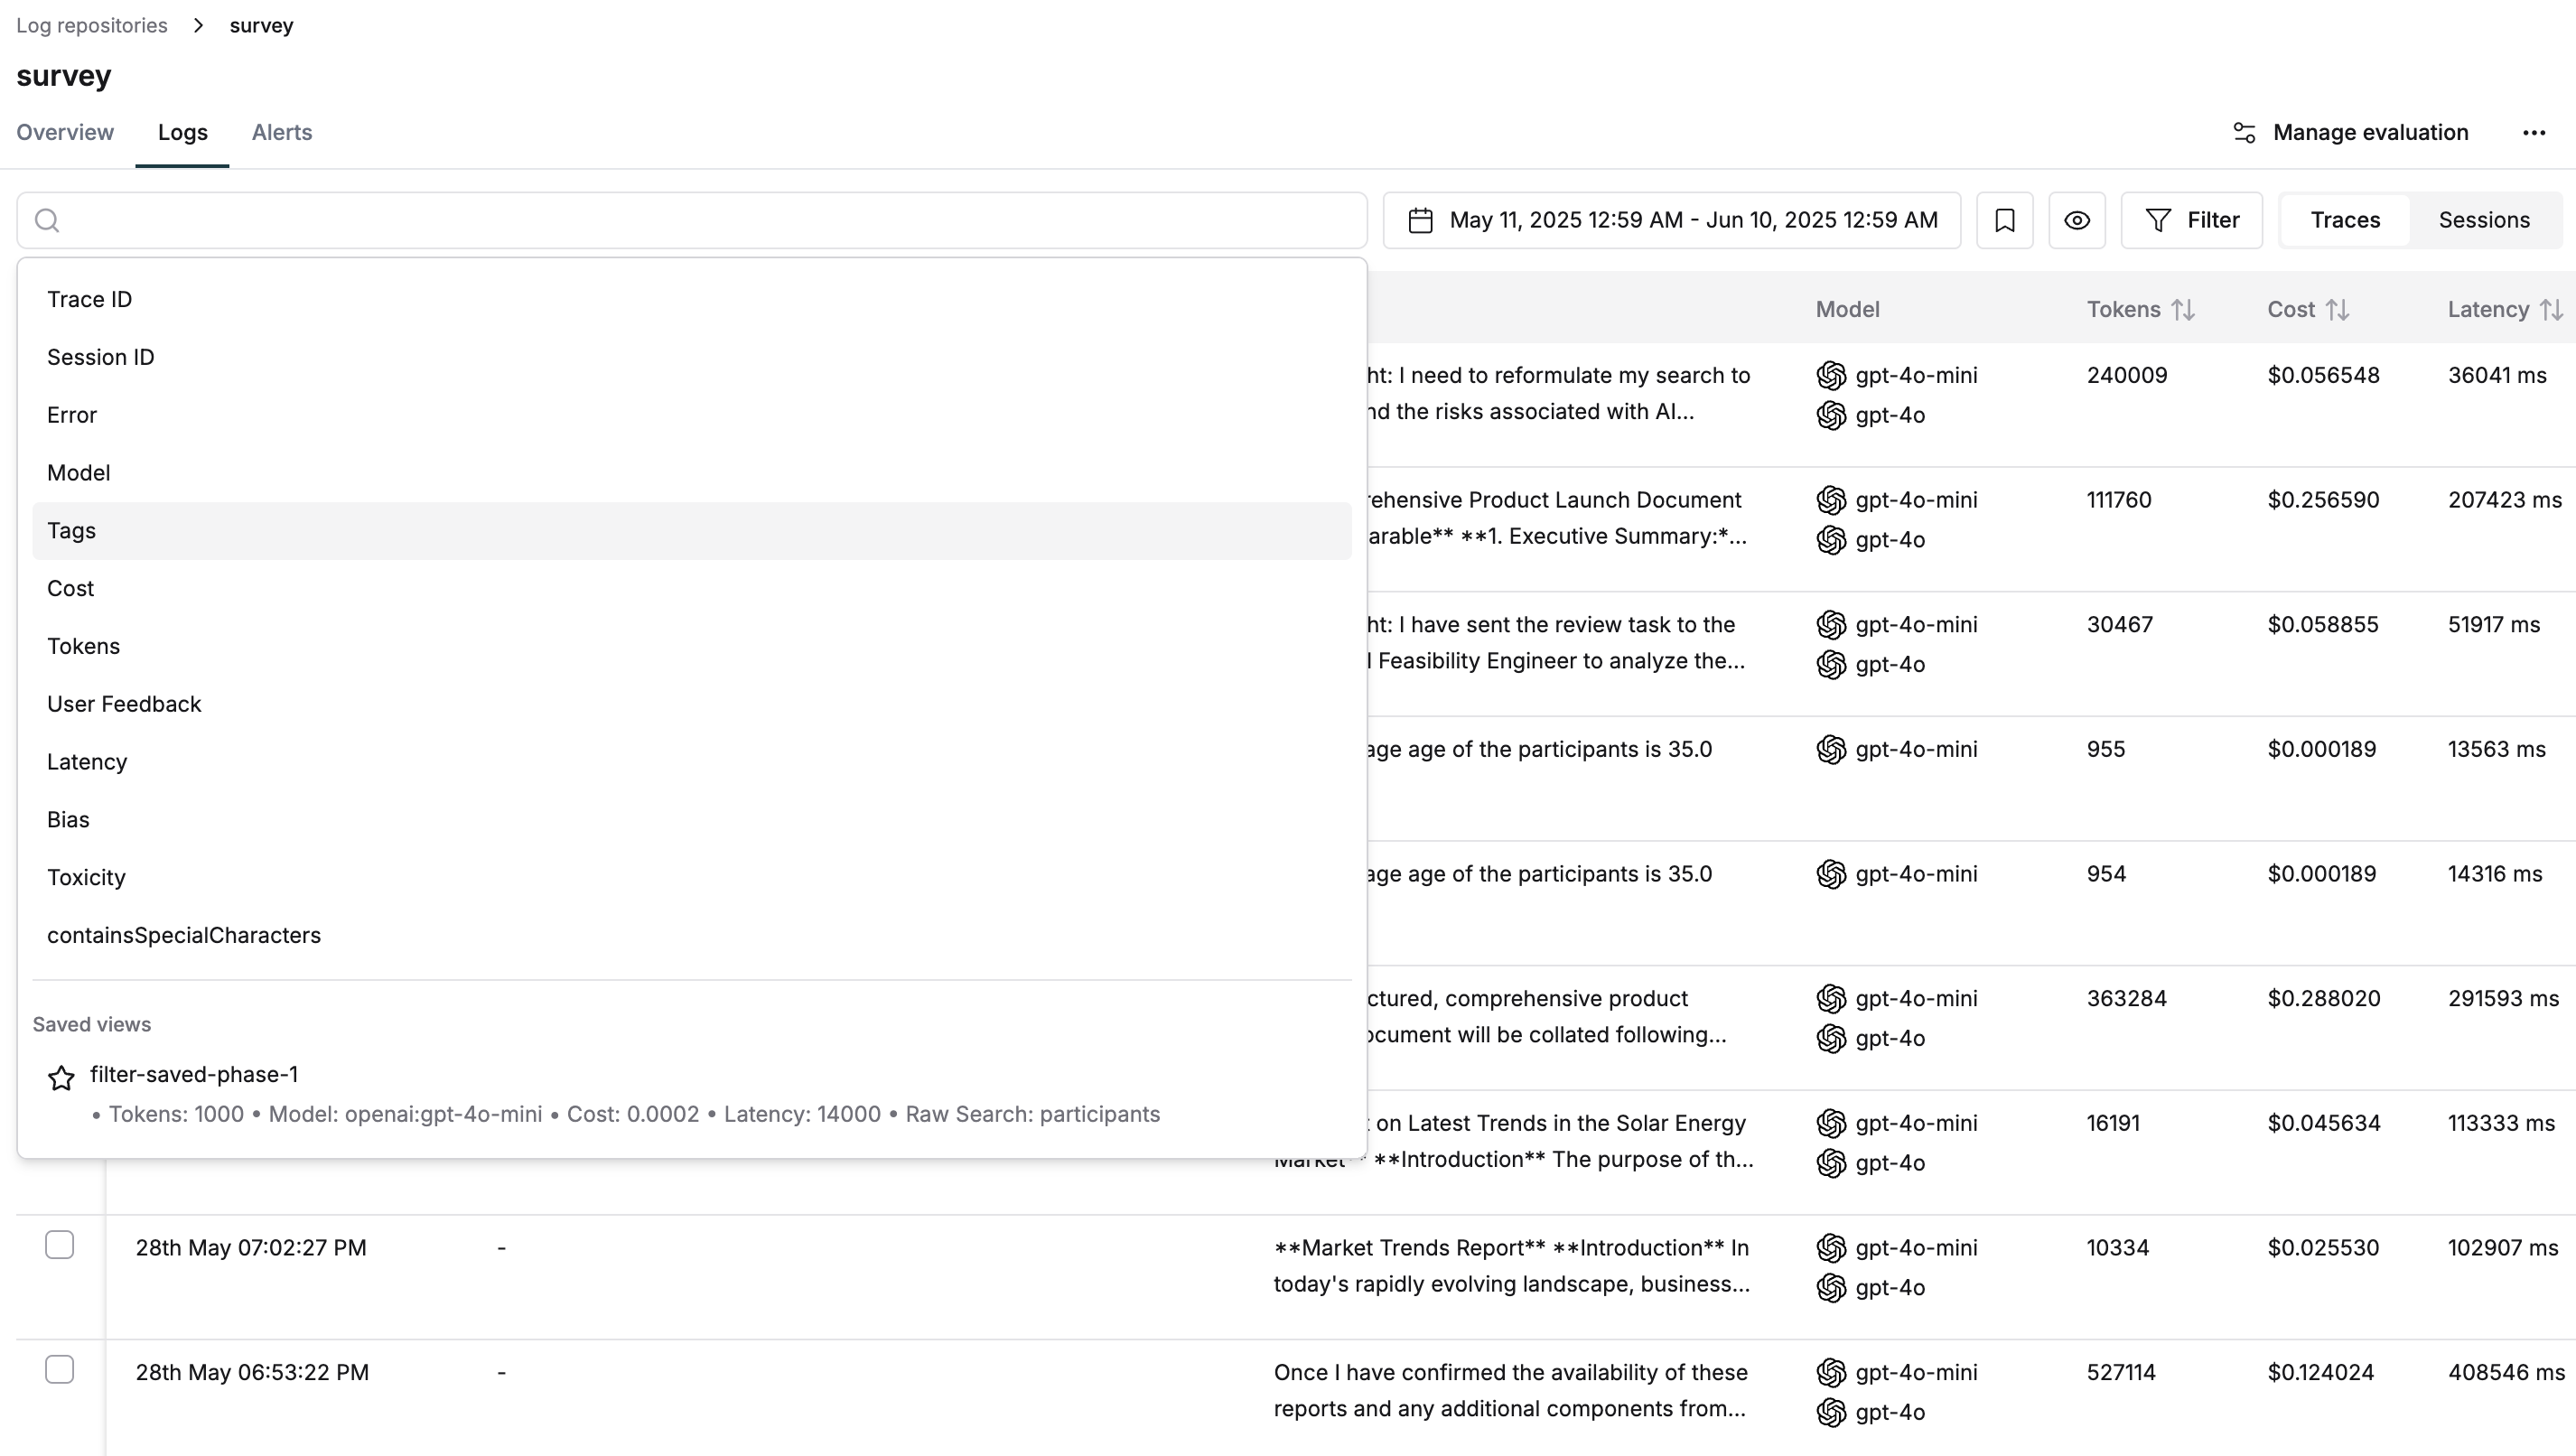
Access your saved filters directly from the search bar for quick navigation
Here's an example of how you can create a saved view, with a specific set of filter configuration.
 You can also access the saved view from the search bar to apply those filters quickly.
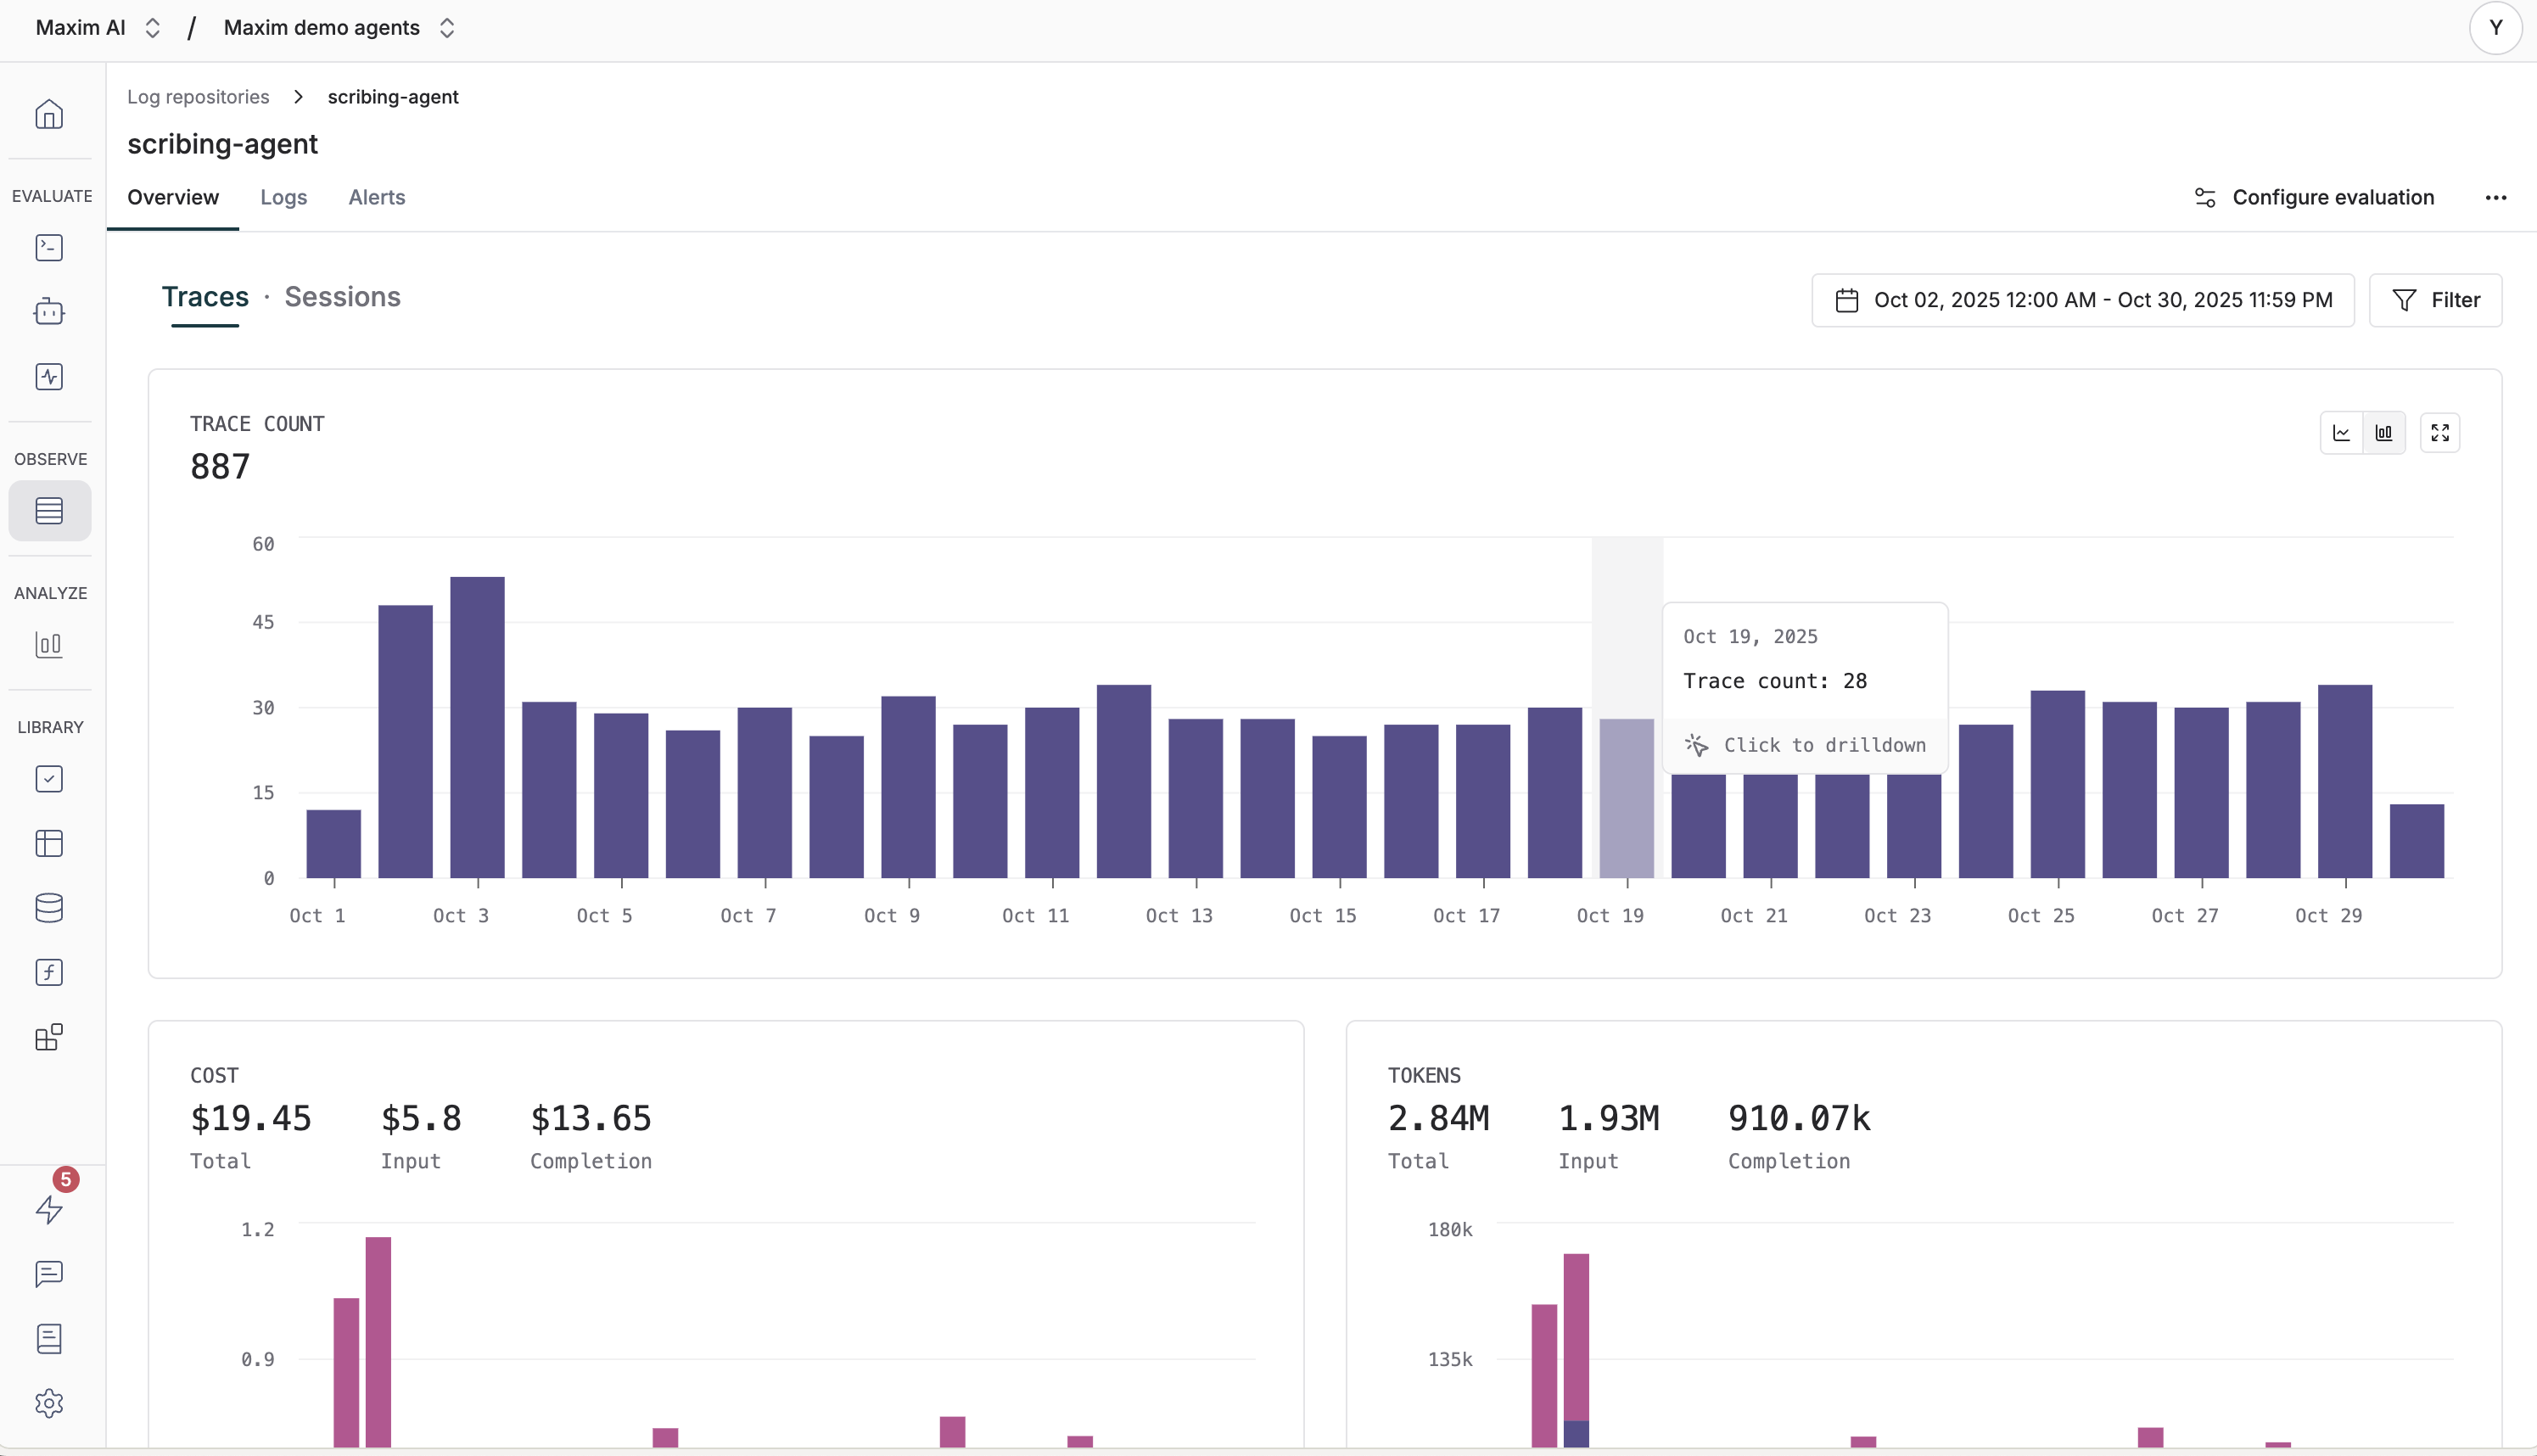
 ## Logs Charts
Logs charts visualize your log data over time, helping you identify patterns, trends, and anomalies. Charts can be displayed as bar charts or line charts.
### Interactive Features
* **Hover**: Hover over bars or points to see detailed information
* **Click**: Click on chart elements to interact with tooltips and navigate to logs
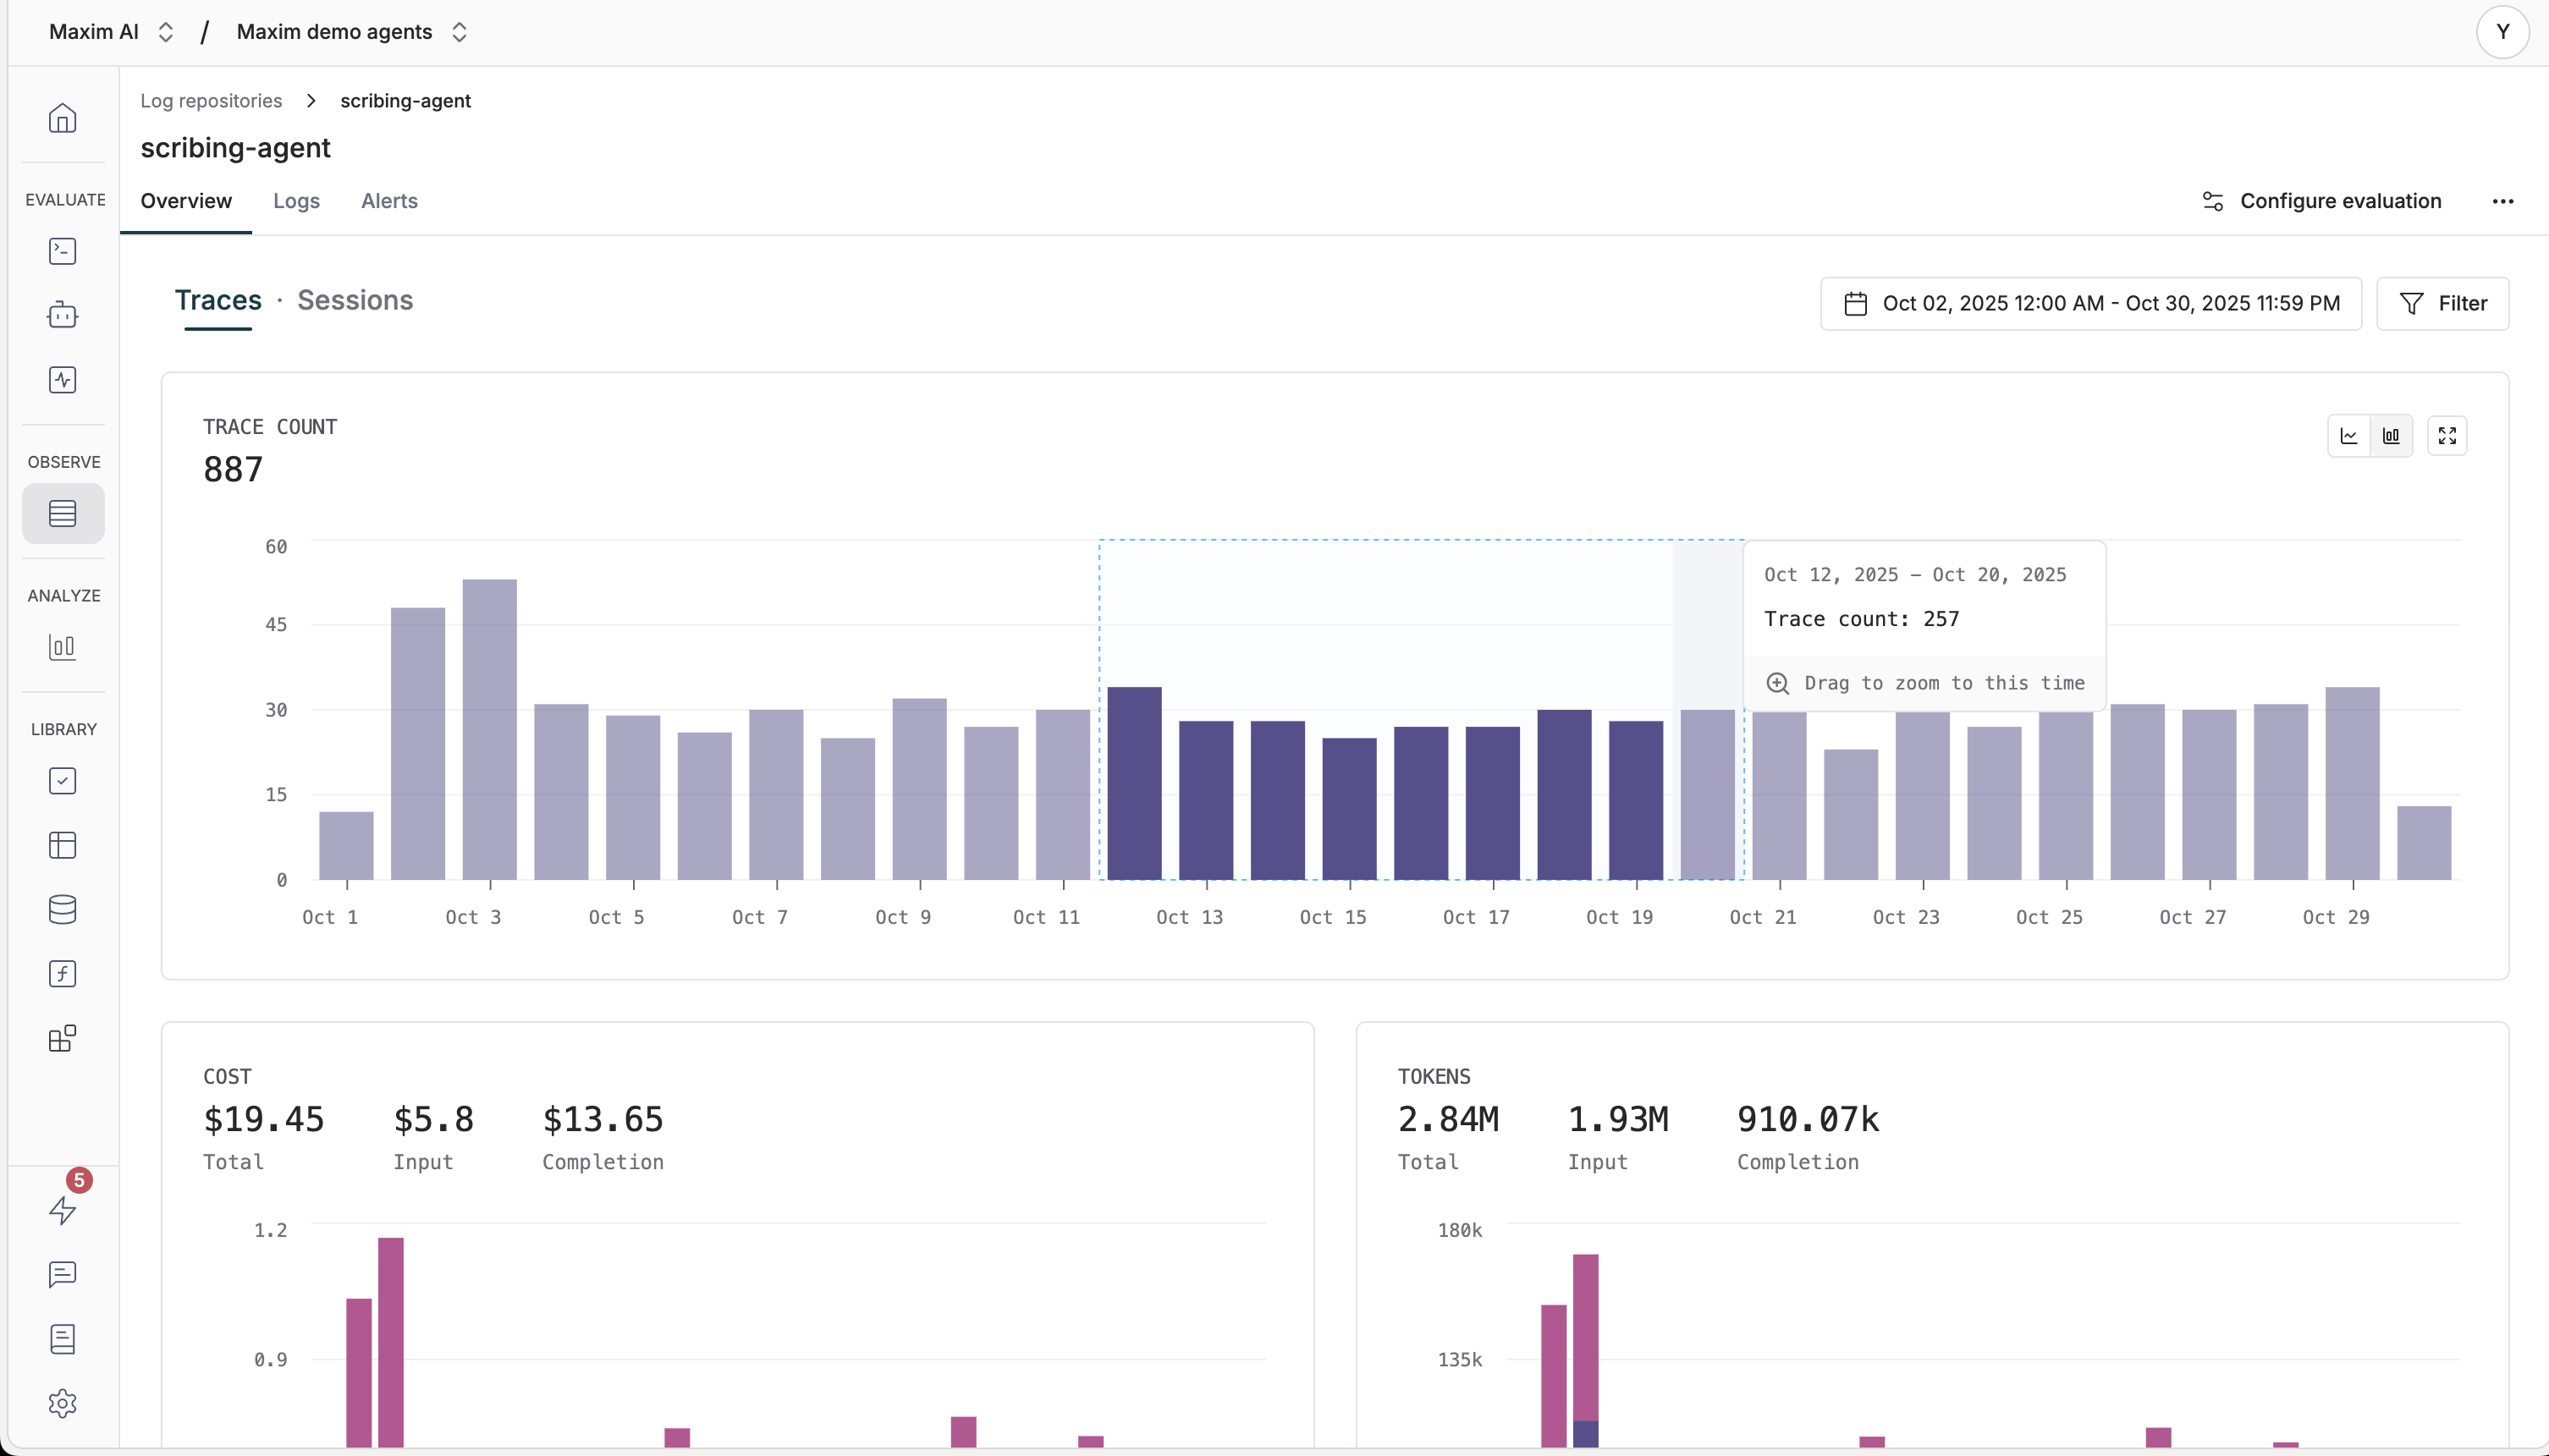
* **Drag selection**: Drag across the chart to select multiple time periods
* **Visual feedback**: Selected ranges are highlighted with a shaded overlay
Use these interactive features to quickly identify patterns, anomalies, and navigate to specific log entries for deeper analysis.
## Logs Charts
Logs charts visualize your log data over time, helping you identify patterns, trends, and anomalies. Charts can be displayed as bar charts or line charts.
### Interactive Features
* **Hover**: Hover over bars or points to see detailed information
* **Click**: Click on chart elements to interact with tooltips and navigate to logs
* **Drag selection**: Drag across the chart to select multiple time periods
* **Visual feedback**: Selected ranges are highlighted with a shaded overlay
Use these interactive features to quickly identify patterns, anomalies, and navigate to specific log entries for deeper analysis.
 ### Chart Controls
* **Chart type toggle**: Hover over the chart to see bar/line chart toggle buttons at the top right
* **Fullscreen**: Click the expand icon to view the chart in fullscreen mode
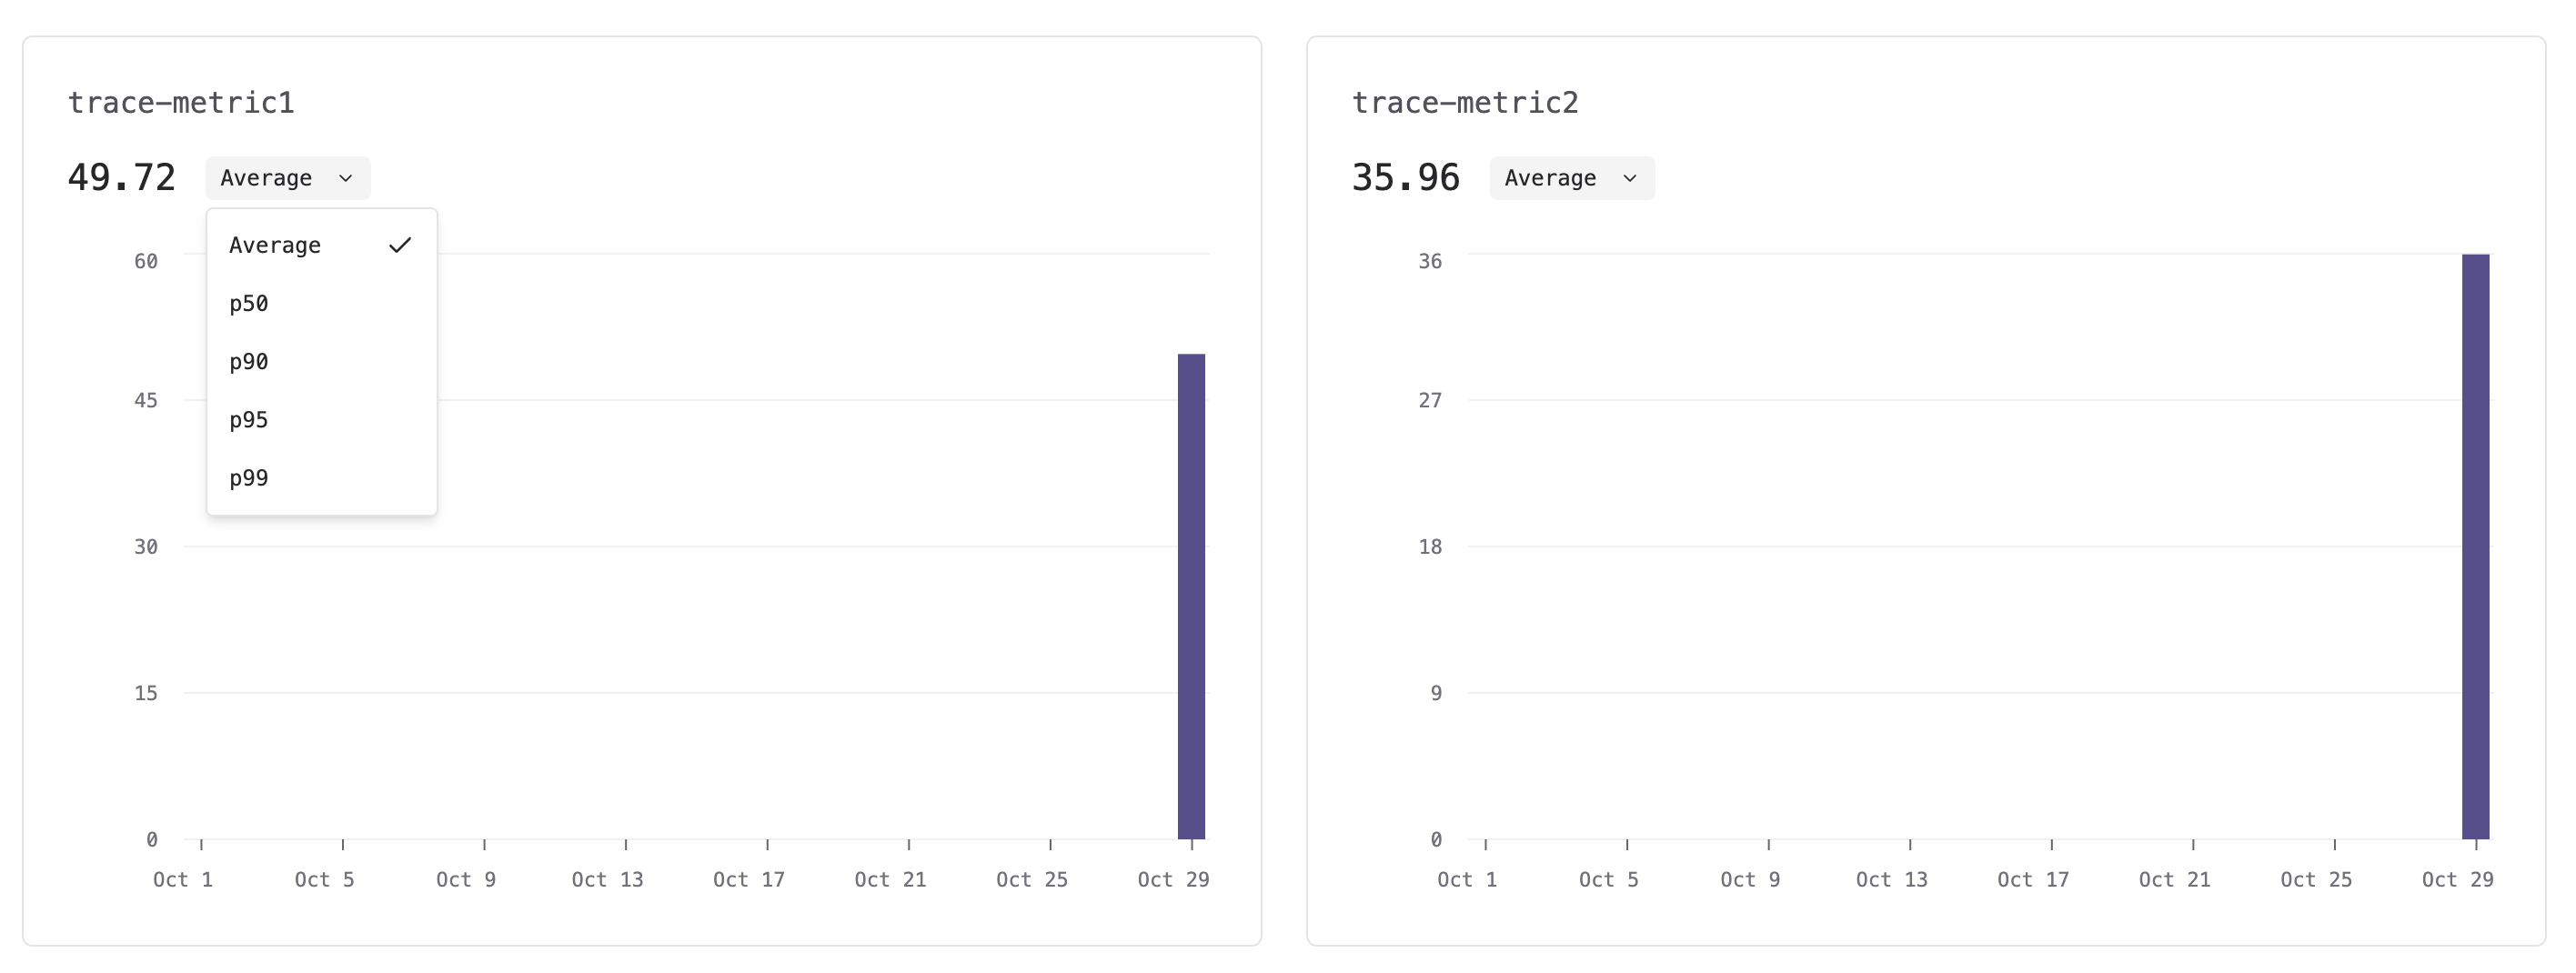
### Custom Metrics
Custom metrics graphs show up when you send them with your logs. When present, Maxim displays them as separate charts alongside standard metrics like latency, cost, and tokens.
Custom metrics charts support the same interactive features as standard charts and allow you to:
* View metrics over time with aggregation options (average, p50, p90, p95, p99)
* Switch between different aggregation types using the dropdown on each chart
* Filter and drill down into specific time ranges
* Navigate to logs filtered by the selected metric values
Custom metrics help you track application-specific data points that matter to your use case, such as user satisfaction scores, custom business metrics, or any numeric values you log alongside your traces and sessions.
### Chart Controls
* **Chart type toggle**: Hover over the chart to see bar/line chart toggle buttons at the top right
* **Fullscreen**: Click the expand icon to view the chart in fullscreen mode
### Custom Metrics
Custom metrics graphs show up when you send them with your logs. When present, Maxim displays them as separate charts alongside standard metrics like latency, cost, and tokens.
Custom metrics charts support the same interactive features as standard charts and allow you to:
* View metrics over time with aggregation options (average, p50, p90, p95, p99)
* Switch between different aggregation types using the dropdown on each chart
* Filter and drill down into specific time ranges
* Navigate to logs filtered by the selected metric values
Custom metrics help you track application-specific data points that matter to your use case, such as user satisfaction scores, custom business metrics, or any numeric values you log alongside your traces and sessions.
 ### Viewing Logs from Charts
1. Hover over or click a data point on the chart
2. In the tooltip, click on a series name or click "View logs"
3. You'll be navigated to the logs view filtered for that time range with relevant filters applied
### Viewing Logs from Charts
1. Hover over or click a data point on the chart
2. In the tooltip, click on a series name or click "View logs"
3. You'll be navigated to the logs view filtered for that time range with relevant filters applied