> ## Documentation Index
> Fetch the complete documentation index at: https://www.getmaxim.ai/docs/llms.txt
> Use this file to discover all available pages before exploring further.
# Set Up Auto Evaluation on Logs
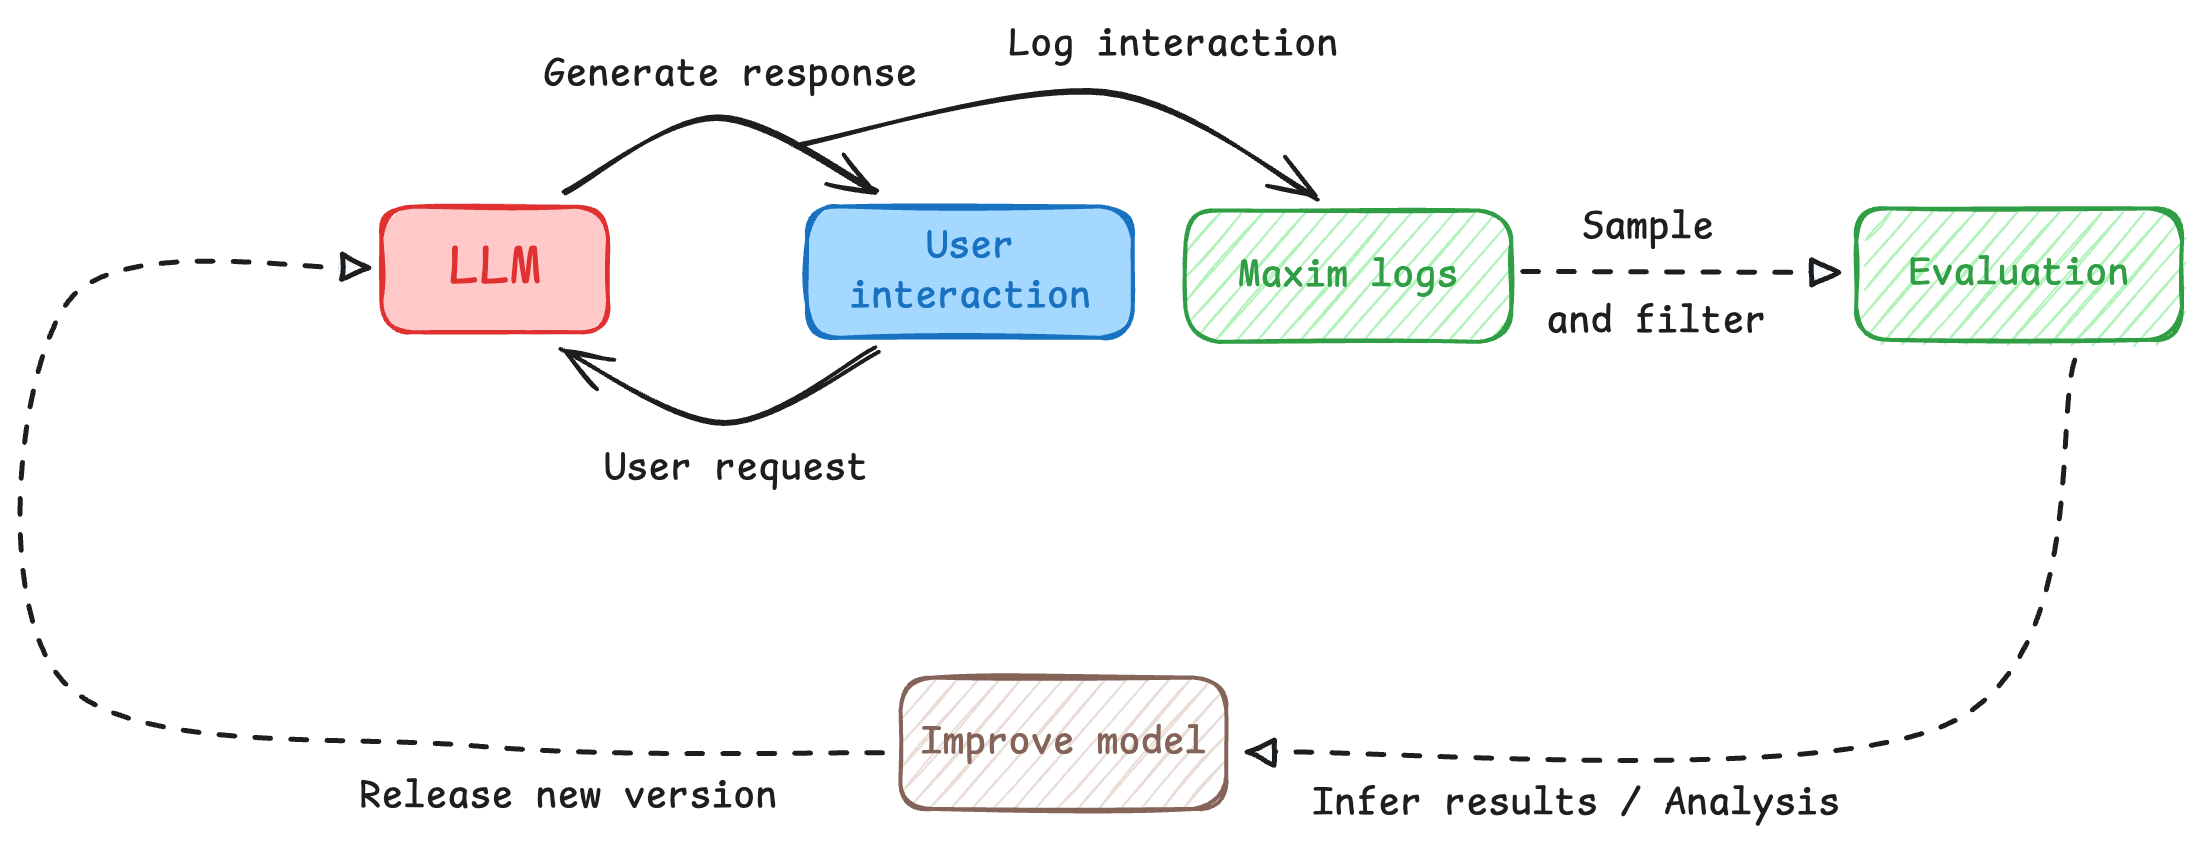
> Evaluate captured logs automatically from the UI based on filters and sampling. Evaluation on logs helps cover cases or scenarios that might not be covered by test runs, ensuring that the LLM is performing optimally under various conditions.
## Why Evaluate Logs?
We know that evaluation is a necessary step while building an LLM, but since an LLM can be non-deterministic, all possible scenarios can never be covered; thus evaluating the LLM on live system also becomes crucial.
Evaluation on logs helps cover cases or scenarios that might not be covered by **Test runs**, ensuring that the LLM is performing optimally under various conditions. Additionally, it allows for potential issues to be identified early on which allows for making necessary adjustments to improve the overall performance of the LLM in time.
With Maxim's multi-level evaluation system, you can evaluate at different granularities—from entire conversations (sessions) to individual responses (traces) to specific components (spans)—giving you comprehensive visibility into your AI application's performance.
 **Before you start**
You need to have your **logging set up** to capture interactions between your LLM and users before you can evaluate them. To do so, you would need to integrate [Maxim SDK](/tracing/tracing-via-sdk/traces) into your application.
## Understanding Evaluation Levels
Maxim supports evaluating your AI application at three different levels of granularity. This multi-level approach allows you to assess quality at different scopes depending on your use case:
### Session-Level Evaluation
Sessions represent multi-turn interactions or conversations. Session-level evaluators assess the quality of an entire conversation flow.
**Use session-level evaluation when:**
* You want to measure conversation quality across multiple turns
* You need to evaluate multi-turn coherence, context retention, or conversation flow
* You're assessing overall user satisfaction or goal completion
* Your evaluator needs access to the full conversation history
### Trace-Level Evaluation
Traces represent single interactions or responses. Trace-level evaluators assess individual completions or responses.
**Use trace-level evaluation when:**
* You want to measure the quality of individual responses
* You need to evaluate single-turn metrics like helpfulness or accuracy
* You're assessing response-specific attributes like tone or formatting
### Span-Level Evaluation
Spans represent specific components within a trace (e.g., a generation, retrieval, tool call, or custom component). Span-level evaluators assess individual components in isolation.
**Use span-level evaluation when:**
* You want to evaluate specific components of your agentic workflow
* You need to assess retrieval quality, individual generation steps, or tool usage
* You're optimizing specific parts of your application independently
* You need component-specific metrics for debugging or optimization
Span-level evaluations are configured programmatically via the SDK rather than through the UI. See [Node-Level Evaluation](/online-evals/via-sdk/node-level-evaluation) for implementation details.
## Setting Up Auto Evaluation
Navigate to the repository where you want to evaluate your logs.
Click on `Configure evaluation` in the top right corner of the page. This will open up the evaluation configuration sheet.
**Before you start**
You need to have your **logging set up** to capture interactions between your LLM and users before you can evaluate them. To do so, you would need to integrate [Maxim SDK](/tracing/tracing-via-sdk/traces) into your application.
## Understanding Evaluation Levels
Maxim supports evaluating your AI application at three different levels of granularity. This multi-level approach allows you to assess quality at different scopes depending on your use case:
### Session-Level Evaluation
Sessions represent multi-turn interactions or conversations. Session-level evaluators assess the quality of an entire conversation flow.
**Use session-level evaluation when:**
* You want to measure conversation quality across multiple turns
* You need to evaluate multi-turn coherence, context retention, or conversation flow
* You're assessing overall user satisfaction or goal completion
* Your evaluator needs access to the full conversation history
### Trace-Level Evaluation
Traces represent single interactions or responses. Trace-level evaluators assess individual completions or responses.
**Use trace-level evaluation when:**
* You want to measure the quality of individual responses
* You need to evaluate single-turn metrics like helpfulness or accuracy
* You're assessing response-specific attributes like tone or formatting
### Span-Level Evaluation
Spans represent specific components within a trace (e.g., a generation, retrieval, tool call, or custom component). Span-level evaluators assess individual components in isolation.
**Use span-level evaluation when:**
* You want to evaluate specific components of your agentic workflow
* You need to assess retrieval quality, individual generation steps, or tool usage
* You're optimizing specific parts of your application independently
* You need component-specific metrics for debugging or optimization
Span-level evaluations are configured programmatically via the SDK rather than through the UI. See [Node-Level Evaluation](/online-evals/via-sdk/node-level-evaluation) for implementation details.
## Setting Up Auto Evaluation
Navigate to the repository where you want to evaluate your logs.
Click on `Configure evaluation` in the top right corner of the page. This will open up the evaluation configuration sheet.
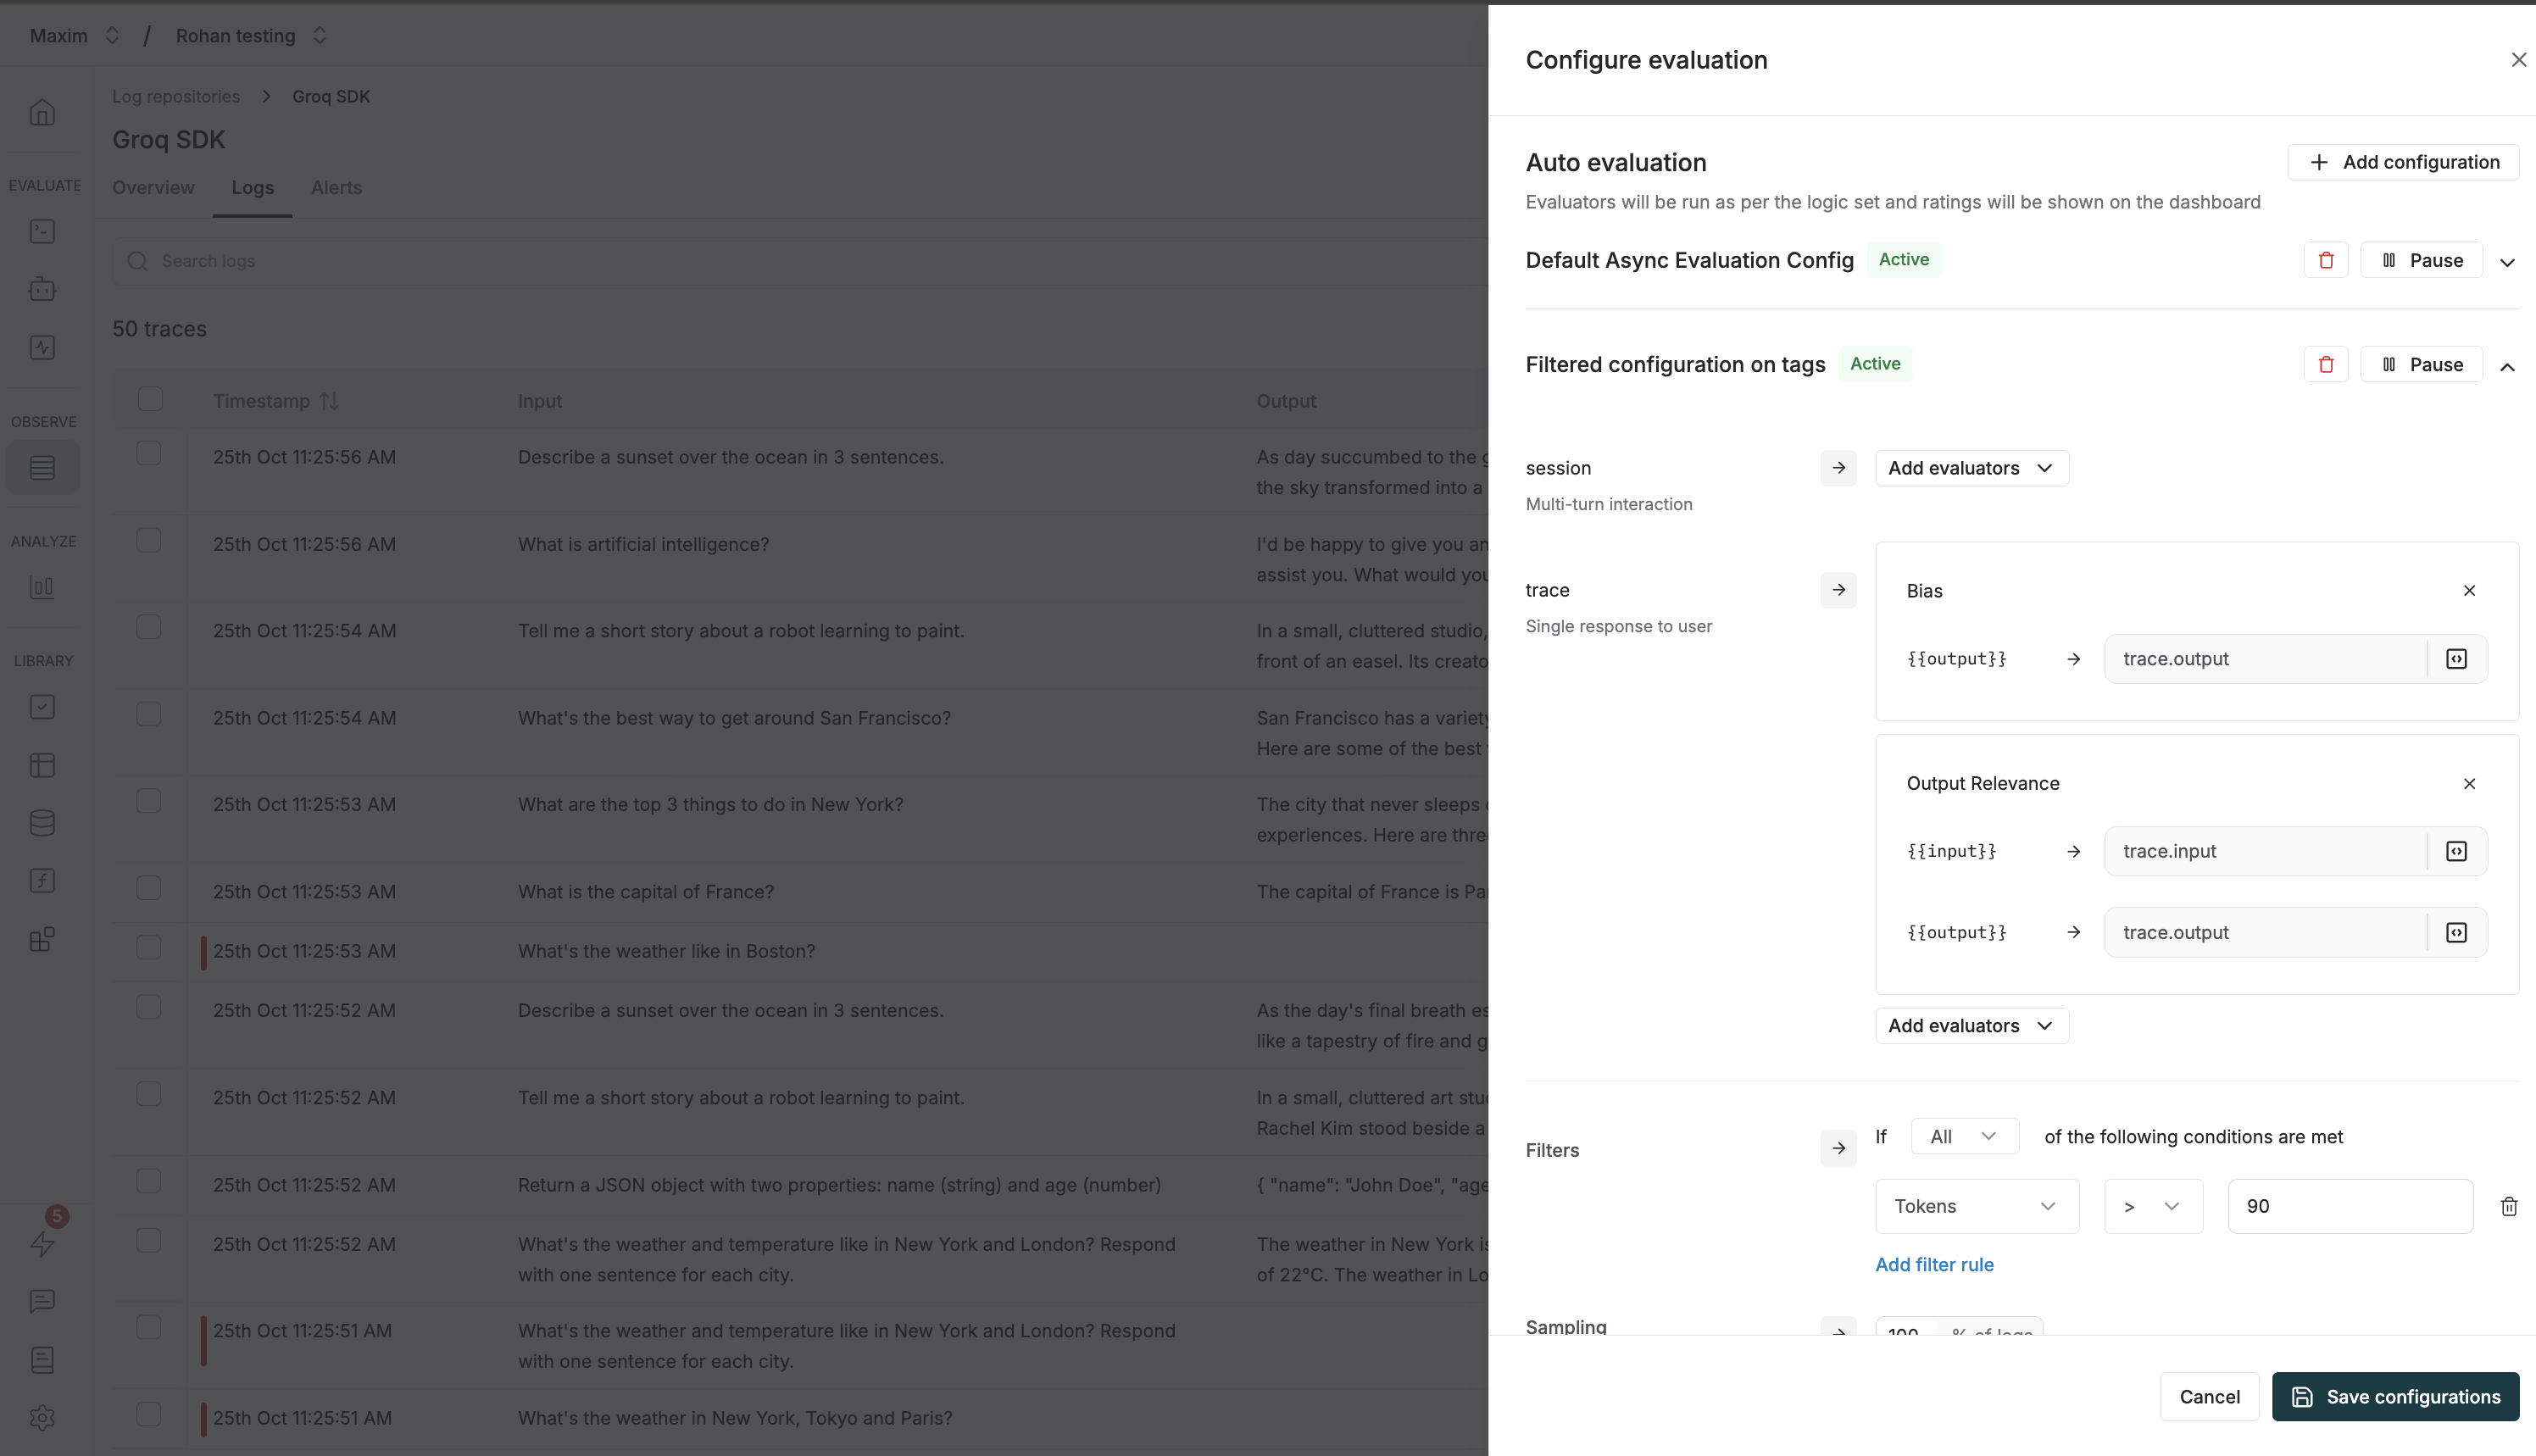 You can create multiple configurations for auto evaluation on logs. Each configuration can be used to evaluate logs based on different criteria.
Explained in the [Multiple configurations for auto evaluations](#multiple-configurations-for-auto-evaluations) section.
The `Auto Evaluation` section allows you to configure evaluators at different levels of granularity:
* **Session**: Evaluate multi-turn interactions (conversations) as a whole. Use this when you need to assess the quality of an entire conversation or dialogue flow.
* **Trace**: Evaluate a single response to a user. Use this for evaluating individual interactions or single completions.
* **Span**: Evaluate specific components within a trace (e.g., a particular generation, retrieval, or tool call). This is configured via the SDK - see [Node-Level Evaluation](/online-evals/via-sdk/node-level-evaluation) for details.
**Choosing the right level:**
* Use **Session** level for evaluating conversation quality, multi-turn coherence, or overall user satisfaction
* Use **Trace** level for single-turn quality metrics like helpfulness, accuracy, or tone
* Use **Span** level (via SDK) for component-specific metrics like retrieval quality or generation clarity
For each level (Session and Trace), click `Add evaluators` to select the evaluators you want to run.
Once you select an evaluator, you'll need to map variables to the evaluator's required inputs. For example:
* `{{input}}` might map to the user's input
* `{{output}}` might map to `trace[*].output` for session-level or `trace.output` for trace-level
* `{{context}}` might map to retrieved context like `retrieval[*].retrievedChunks[*]`
You can create multiple configurations for auto evaluation on logs. Each configuration can be used to evaluate logs based on different criteria.
Explained in the [Multiple configurations for auto evaluations](#multiple-configurations-for-auto-evaluations) section.
The `Auto Evaluation` section allows you to configure evaluators at different levels of granularity:
* **Session**: Evaluate multi-turn interactions (conversations) as a whole. Use this when you need to assess the quality of an entire conversation or dialogue flow.
* **Trace**: Evaluate a single response to a user. Use this for evaluating individual interactions or single completions.
* **Span**: Evaluate specific components within a trace (e.g., a particular generation, retrieval, or tool call). This is configured via the SDK - see [Node-Level Evaluation](/online-evals/via-sdk/node-level-evaluation) for details.
**Choosing the right level:**
* Use **Session** level for evaluating conversation quality, multi-turn coherence, or overall user satisfaction
* Use **Trace** level for single-turn quality metrics like helpfulness, accuracy, or tone
* Use **Span** level (via SDK) for component-specific metrics like retrieval quality or generation clarity
For each level (Session and Trace), click `Add evaluators` to select the evaluators you want to run.
Once you select an evaluator, you'll need to map variables to the evaluator's required inputs. For example:
* `{{input}}` might map to the user's input
* `{{output}}` might map to `trace[*].output` for session-level or `trace.output` for trace-level
* `{{context}}` might map to retrieved context like `retrieval[*].retrievedChunks[*]`
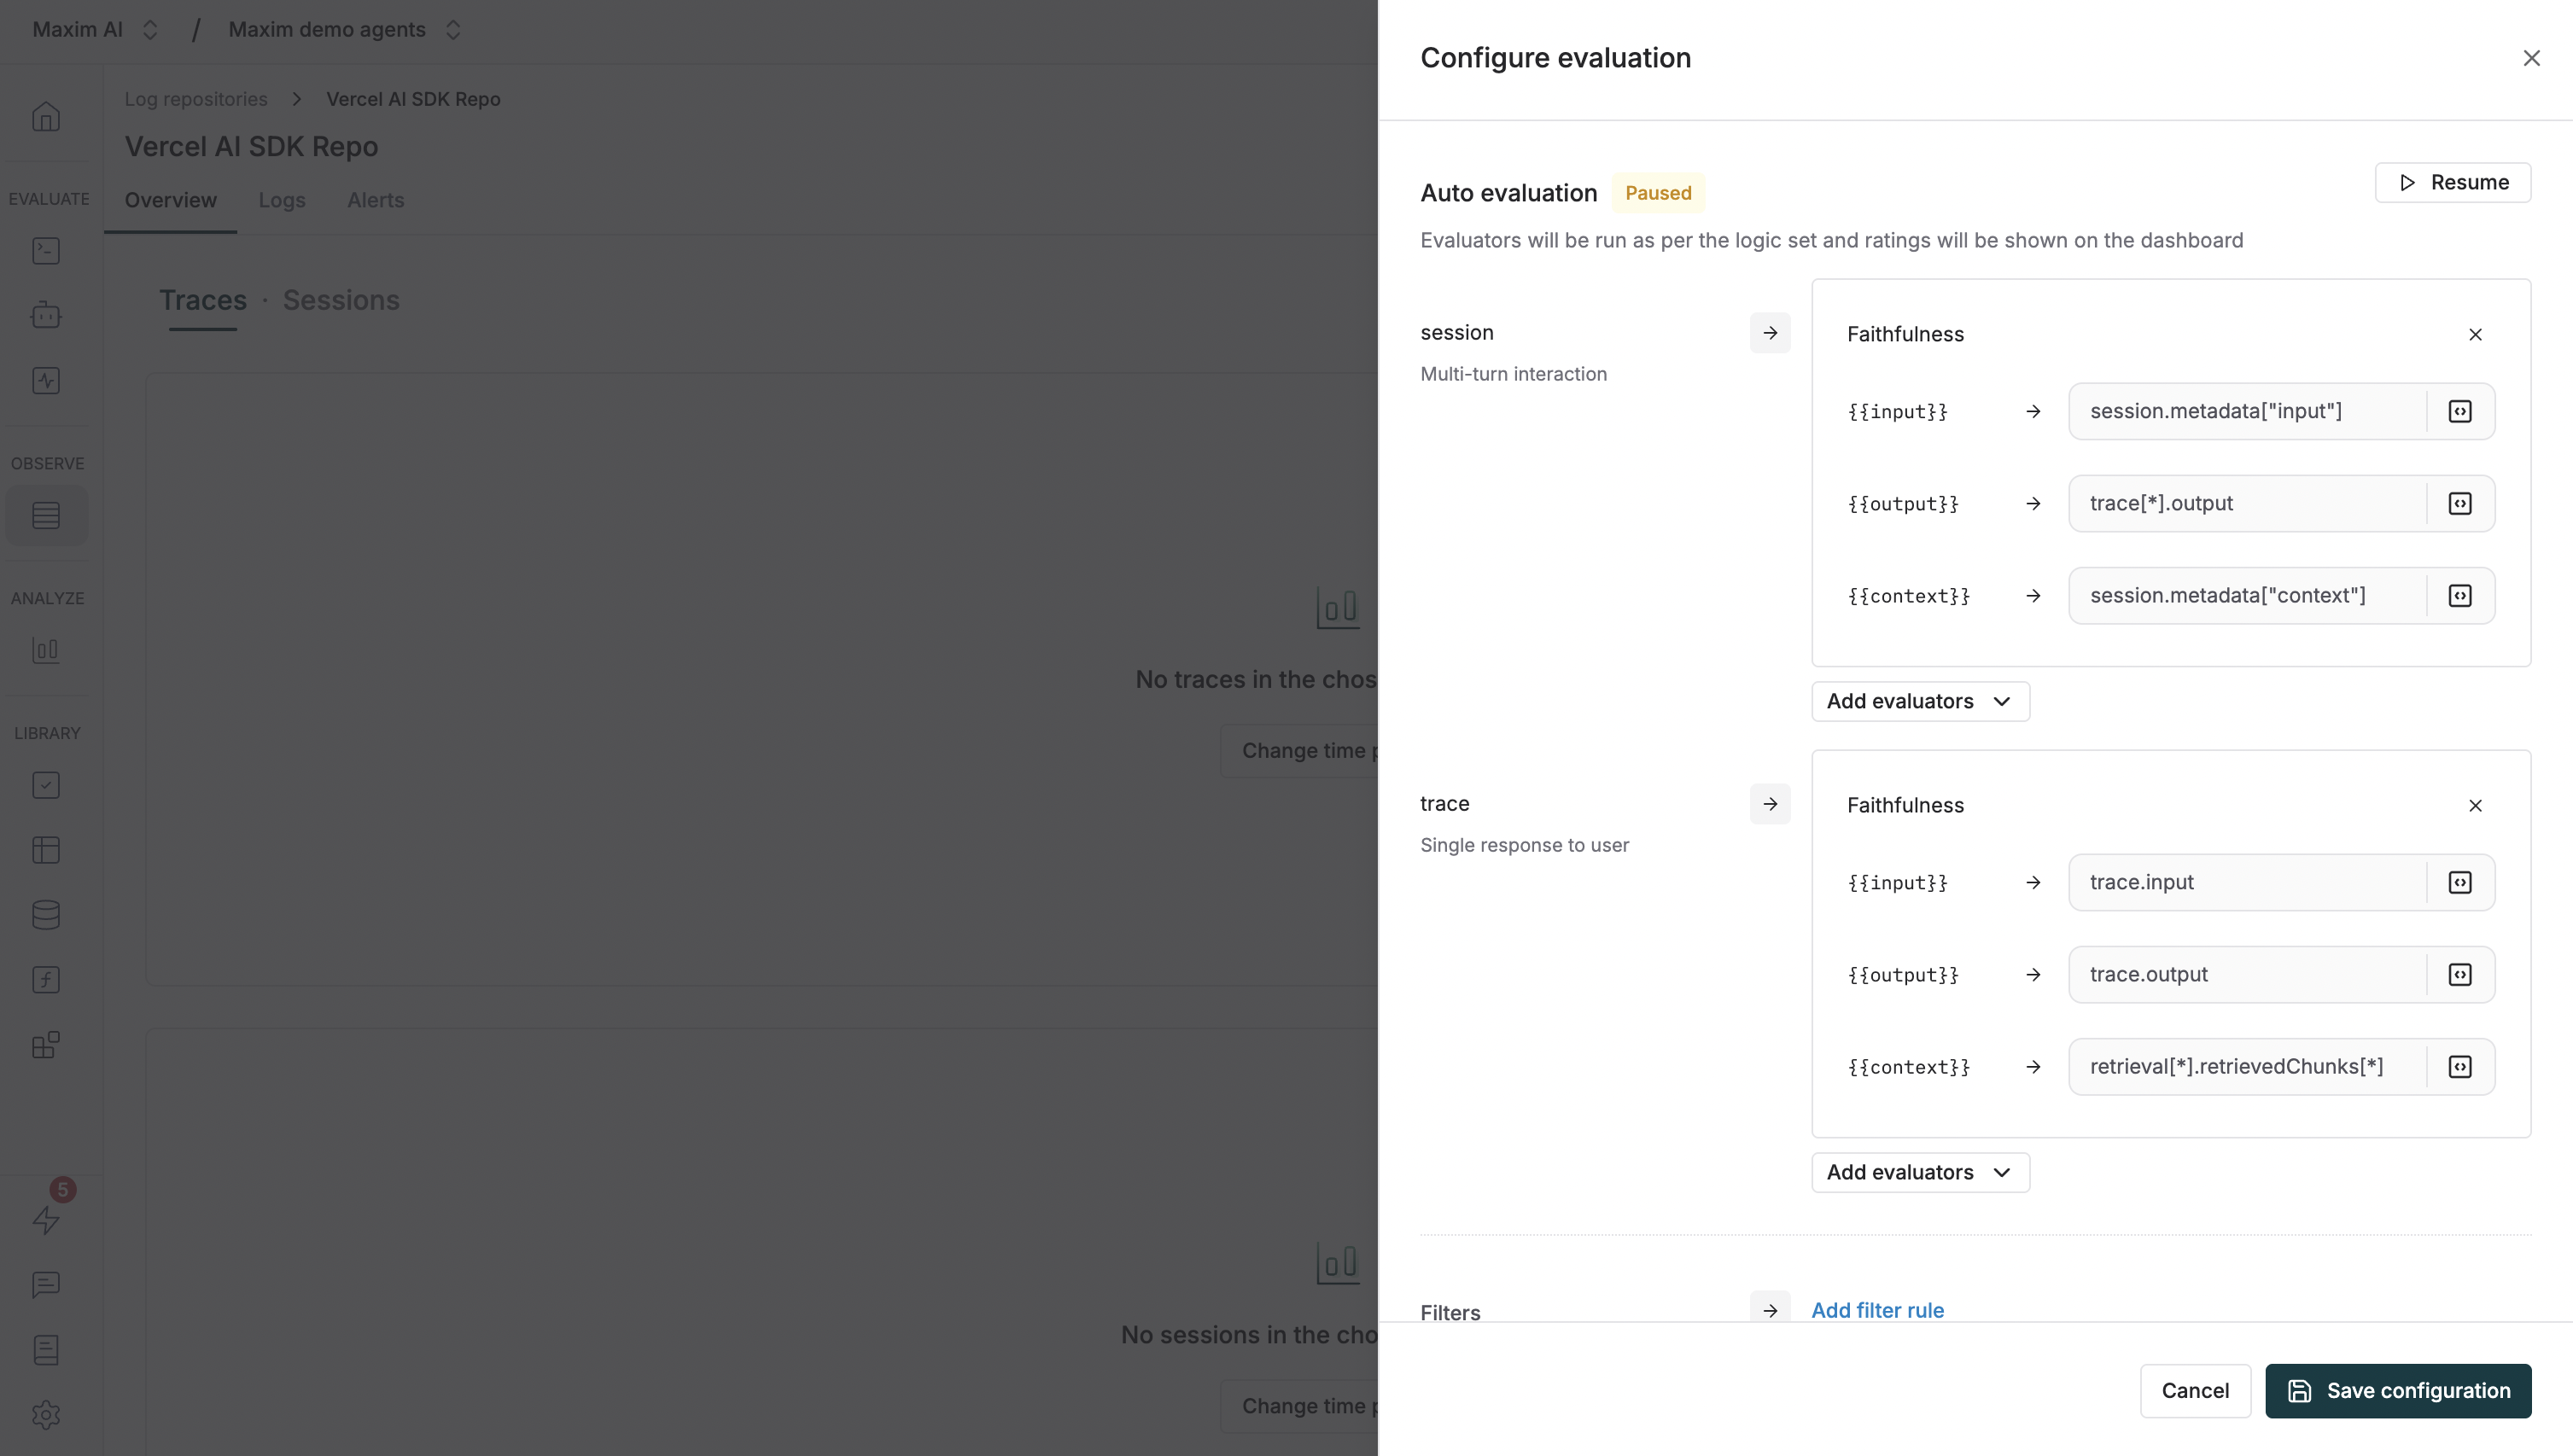 **Variable mapping syntax:**
* Use `trace.output` to reference a trace's output
* Use `trace[*].output` to reference all outputs in a session
* Use `retrieval[*].retrievedChunks[*]` to reference retrieved context from retrieval spans
* Custom mappings can be created by clicking on the mapping field
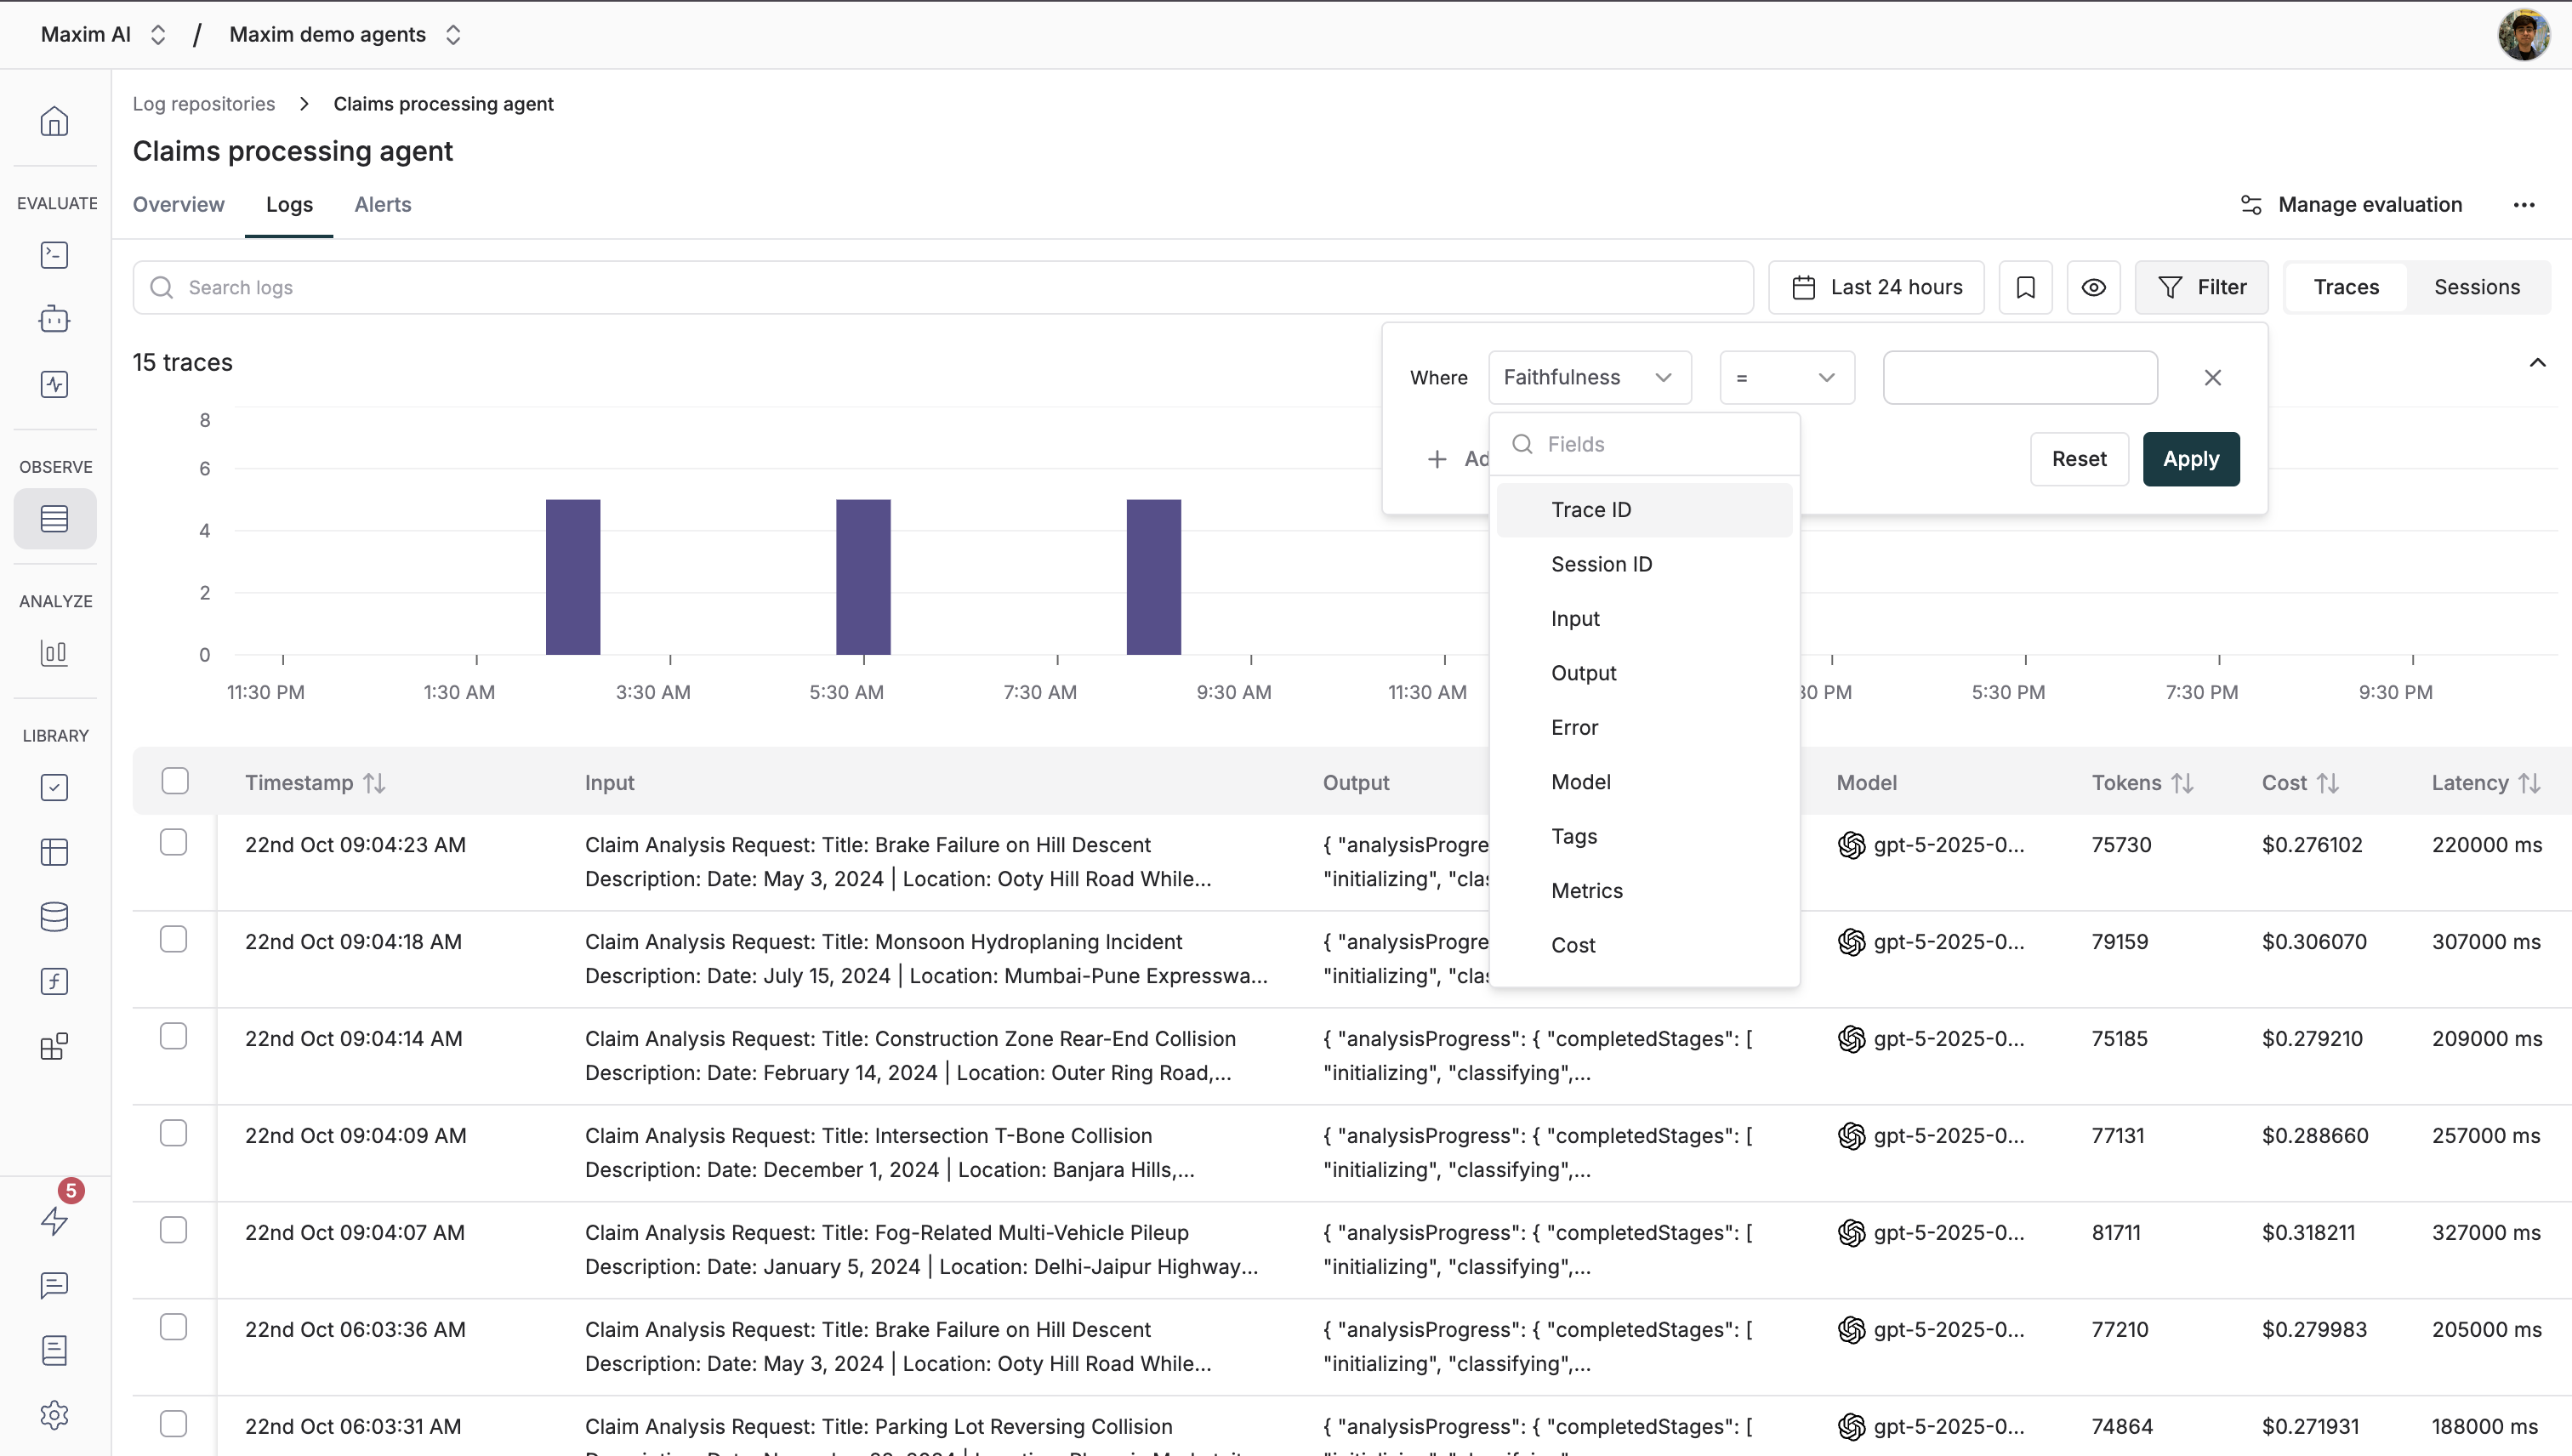
Below the evaluator configuration, you'll find:
**Filters**: Setup filters to only evaluate logs that meet certain criteria. Click `Add filter rule` to create conditions based on various log properties:
* **Trace ID / Session ID**: Filter by specific trace or session identifiers
* **Input / Output**: Filter based on user input or model output content
* **Error**: Filter logs that have errors or specific error types
* **Model**: Filter by the LLM model used (e.g., gpt-4, claude-3, etc.)
* **Tags**: Filter by custom tags you've added to your traces
* **Metrics**: Filter based on evaluation scores or other metrics
* **Cost**: Filter by cost thresholds (e.g., only evaluate expensive requests)
* **Tokens**: Filter by token usage (e.g., evaluate long conversations)
* **User Feedback**: Filter by user ratings or feedback scores
* **Latency**: Filter by response time (e.g., evaluate slow requests)
You can combine multiple filter conditions using "All" (AND) or "Any" (OR) logic to create sophisticated filtering rules.
**Sampling**: Choose a sampling rate to control what percentage of logs are evaluated. This helps manage costs by preventing evaluation of every single log.
**Variable mapping syntax:**
* Use `trace.output` to reference a trace's output
* Use `trace[*].output` to reference all outputs in a session
* Use `retrieval[*].retrievedChunks[*]` to reference retrieved context from retrieval spans
* Custom mappings can be created by clicking on the mapping field
Below the evaluator configuration, you'll find:
**Filters**: Setup filters to only evaluate logs that meet certain criteria. Click `Add filter rule` to create conditions based on various log properties:
* **Trace ID / Session ID**: Filter by specific trace or session identifiers
* **Input / Output**: Filter based on user input or model output content
* **Error**: Filter logs that have errors or specific error types
* **Model**: Filter by the LLM model used (e.g., gpt-4, claude-3, etc.)
* **Tags**: Filter by custom tags you've added to your traces
* **Metrics**: Filter based on evaluation scores or other metrics
* **Cost**: Filter by cost thresholds (e.g., only evaluate expensive requests)
* **Tokens**: Filter by token usage (e.g., evaluate long conversations)
* **User Feedback**: Filter by user ratings or feedback scores
* **Latency**: Filter by response time (e.g., evaluate slow requests)
You can combine multiple filter conditions using "All" (AND) or "Any" (OR) logic to create sophisticated filtering rules.
**Sampling**: Choose a sampling rate to control what percentage of logs are evaluated. This helps manage costs by preventing evaluation of every single log.
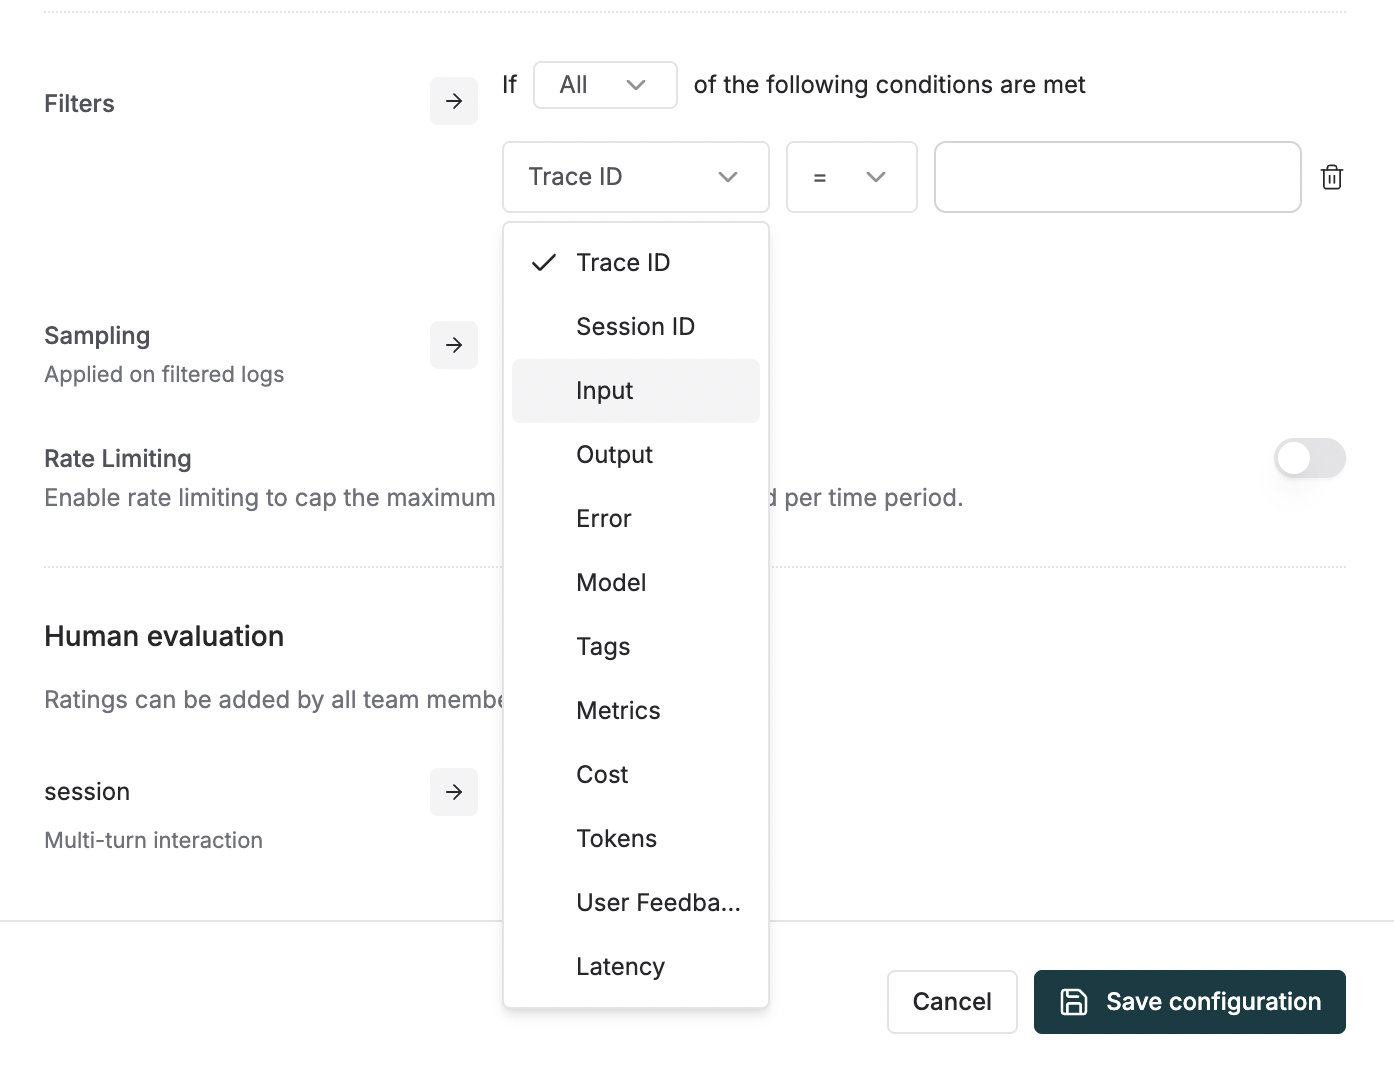 You can also enable **Rate Limiting** to cap the maximum number of logs sampled per time period, providing additional cost control.
The `Human Evaluation` section is explained in the [Set up human evaluation on logs](/online-evals/via-ui/set-up-human-annotation-on-logs) section
Finally click on the Save configuration button.
The configuration is now done and your logs should start evaluating automatically based on the filters and sampling rate you have set up! 🎉
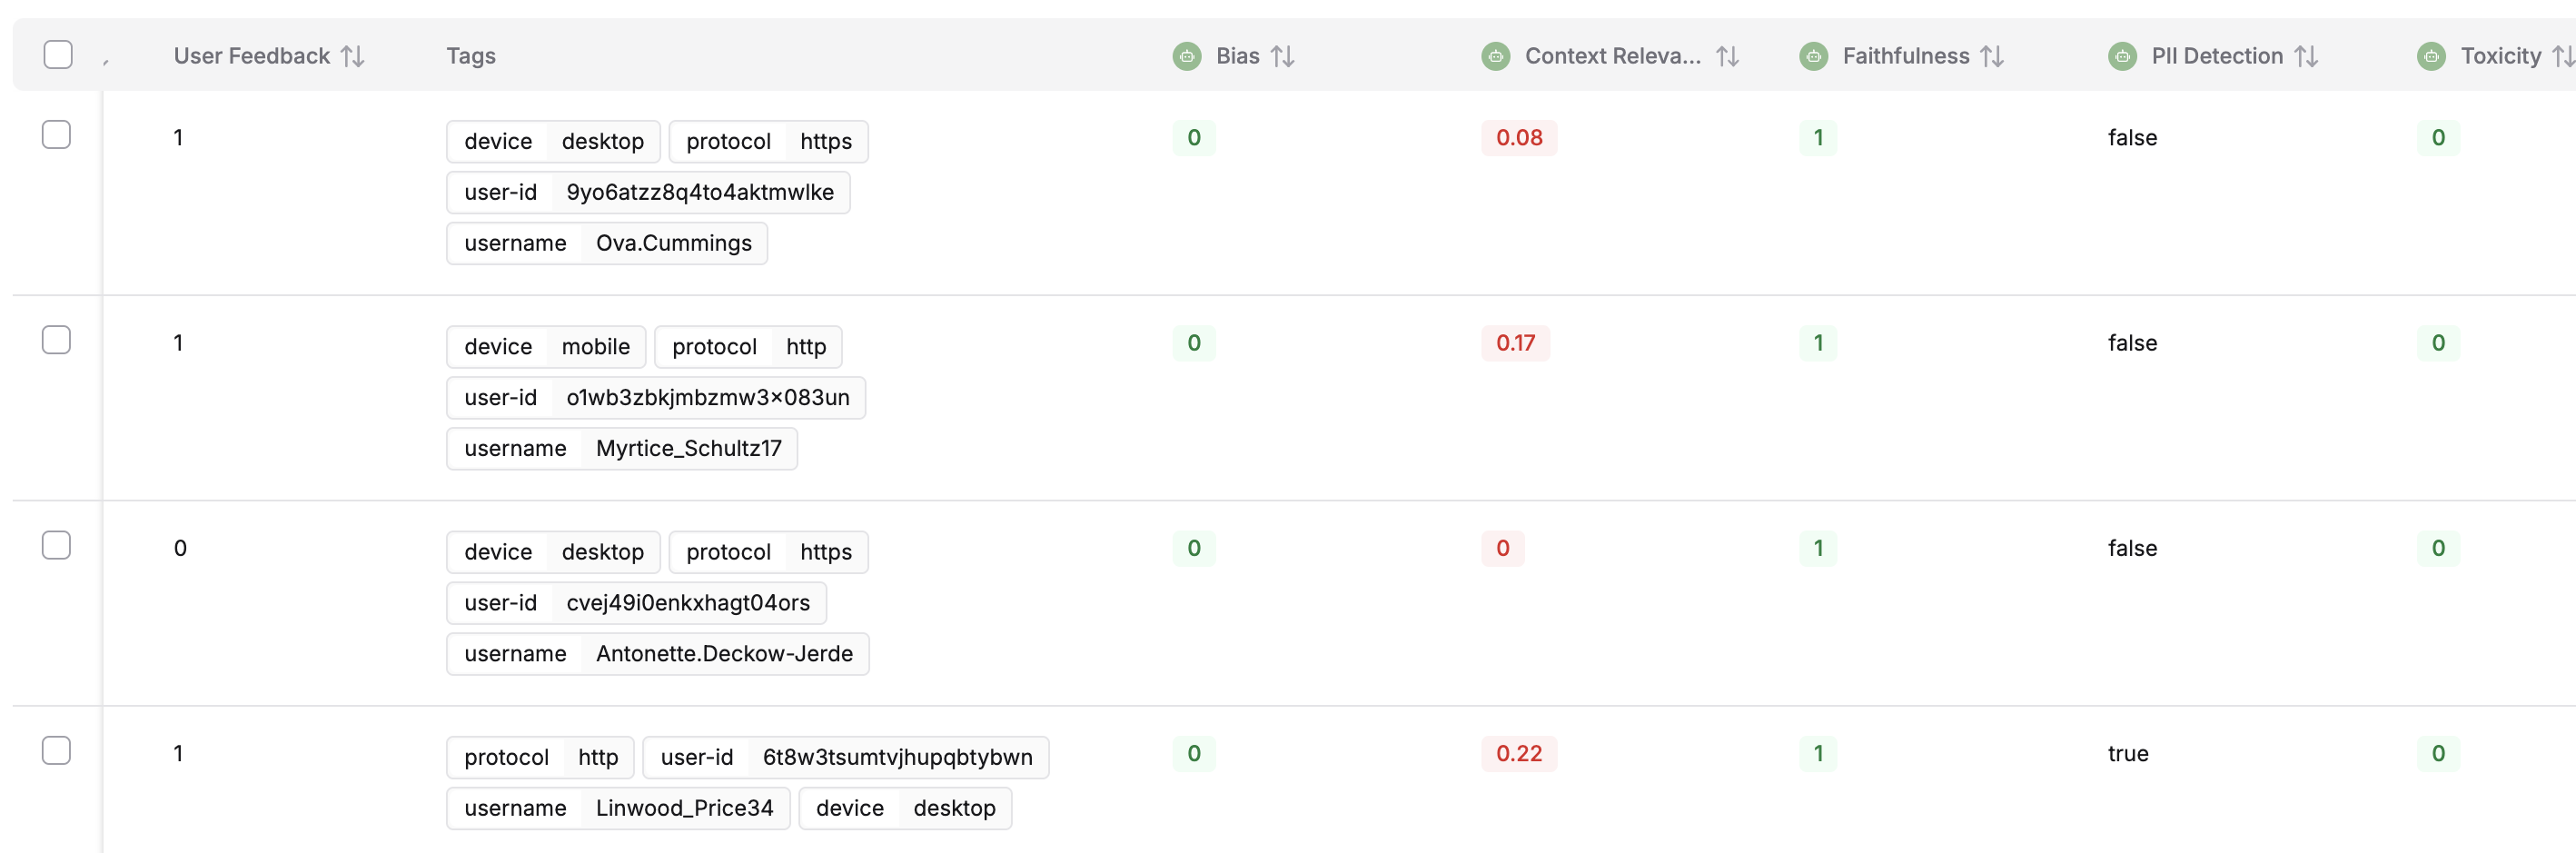
## Making Sense of Evaluations on Logs
In the logs' table view, you can find the evaluations on a trace in its row towards the left end, displaying the evaluation scores. You can sort the logs by evaluation scores as well by clicking on either of the evaluators' column header.
You can also enable **Rate Limiting** to cap the maximum number of logs sampled per time period, providing additional cost control.
The `Human Evaluation` section is explained in the [Set up human evaluation on logs](/online-evals/via-ui/set-up-human-annotation-on-logs) section
Finally click on the Save configuration button.
The configuration is now done and your logs should start evaluating automatically based on the filters and sampling rate you have set up! 🎉
## Making Sense of Evaluations on Logs
In the logs' table view, you can find the evaluations on a trace in its row towards the left end, displaying the evaluation scores. You can sort the logs by evaluation scores as well by clicking on either of the evaluators' column header.
 Click the trace to view detailed evaluation results. In the sheet, you will find the `Evaluation` tab, wherein you can see the evaluation in detail.
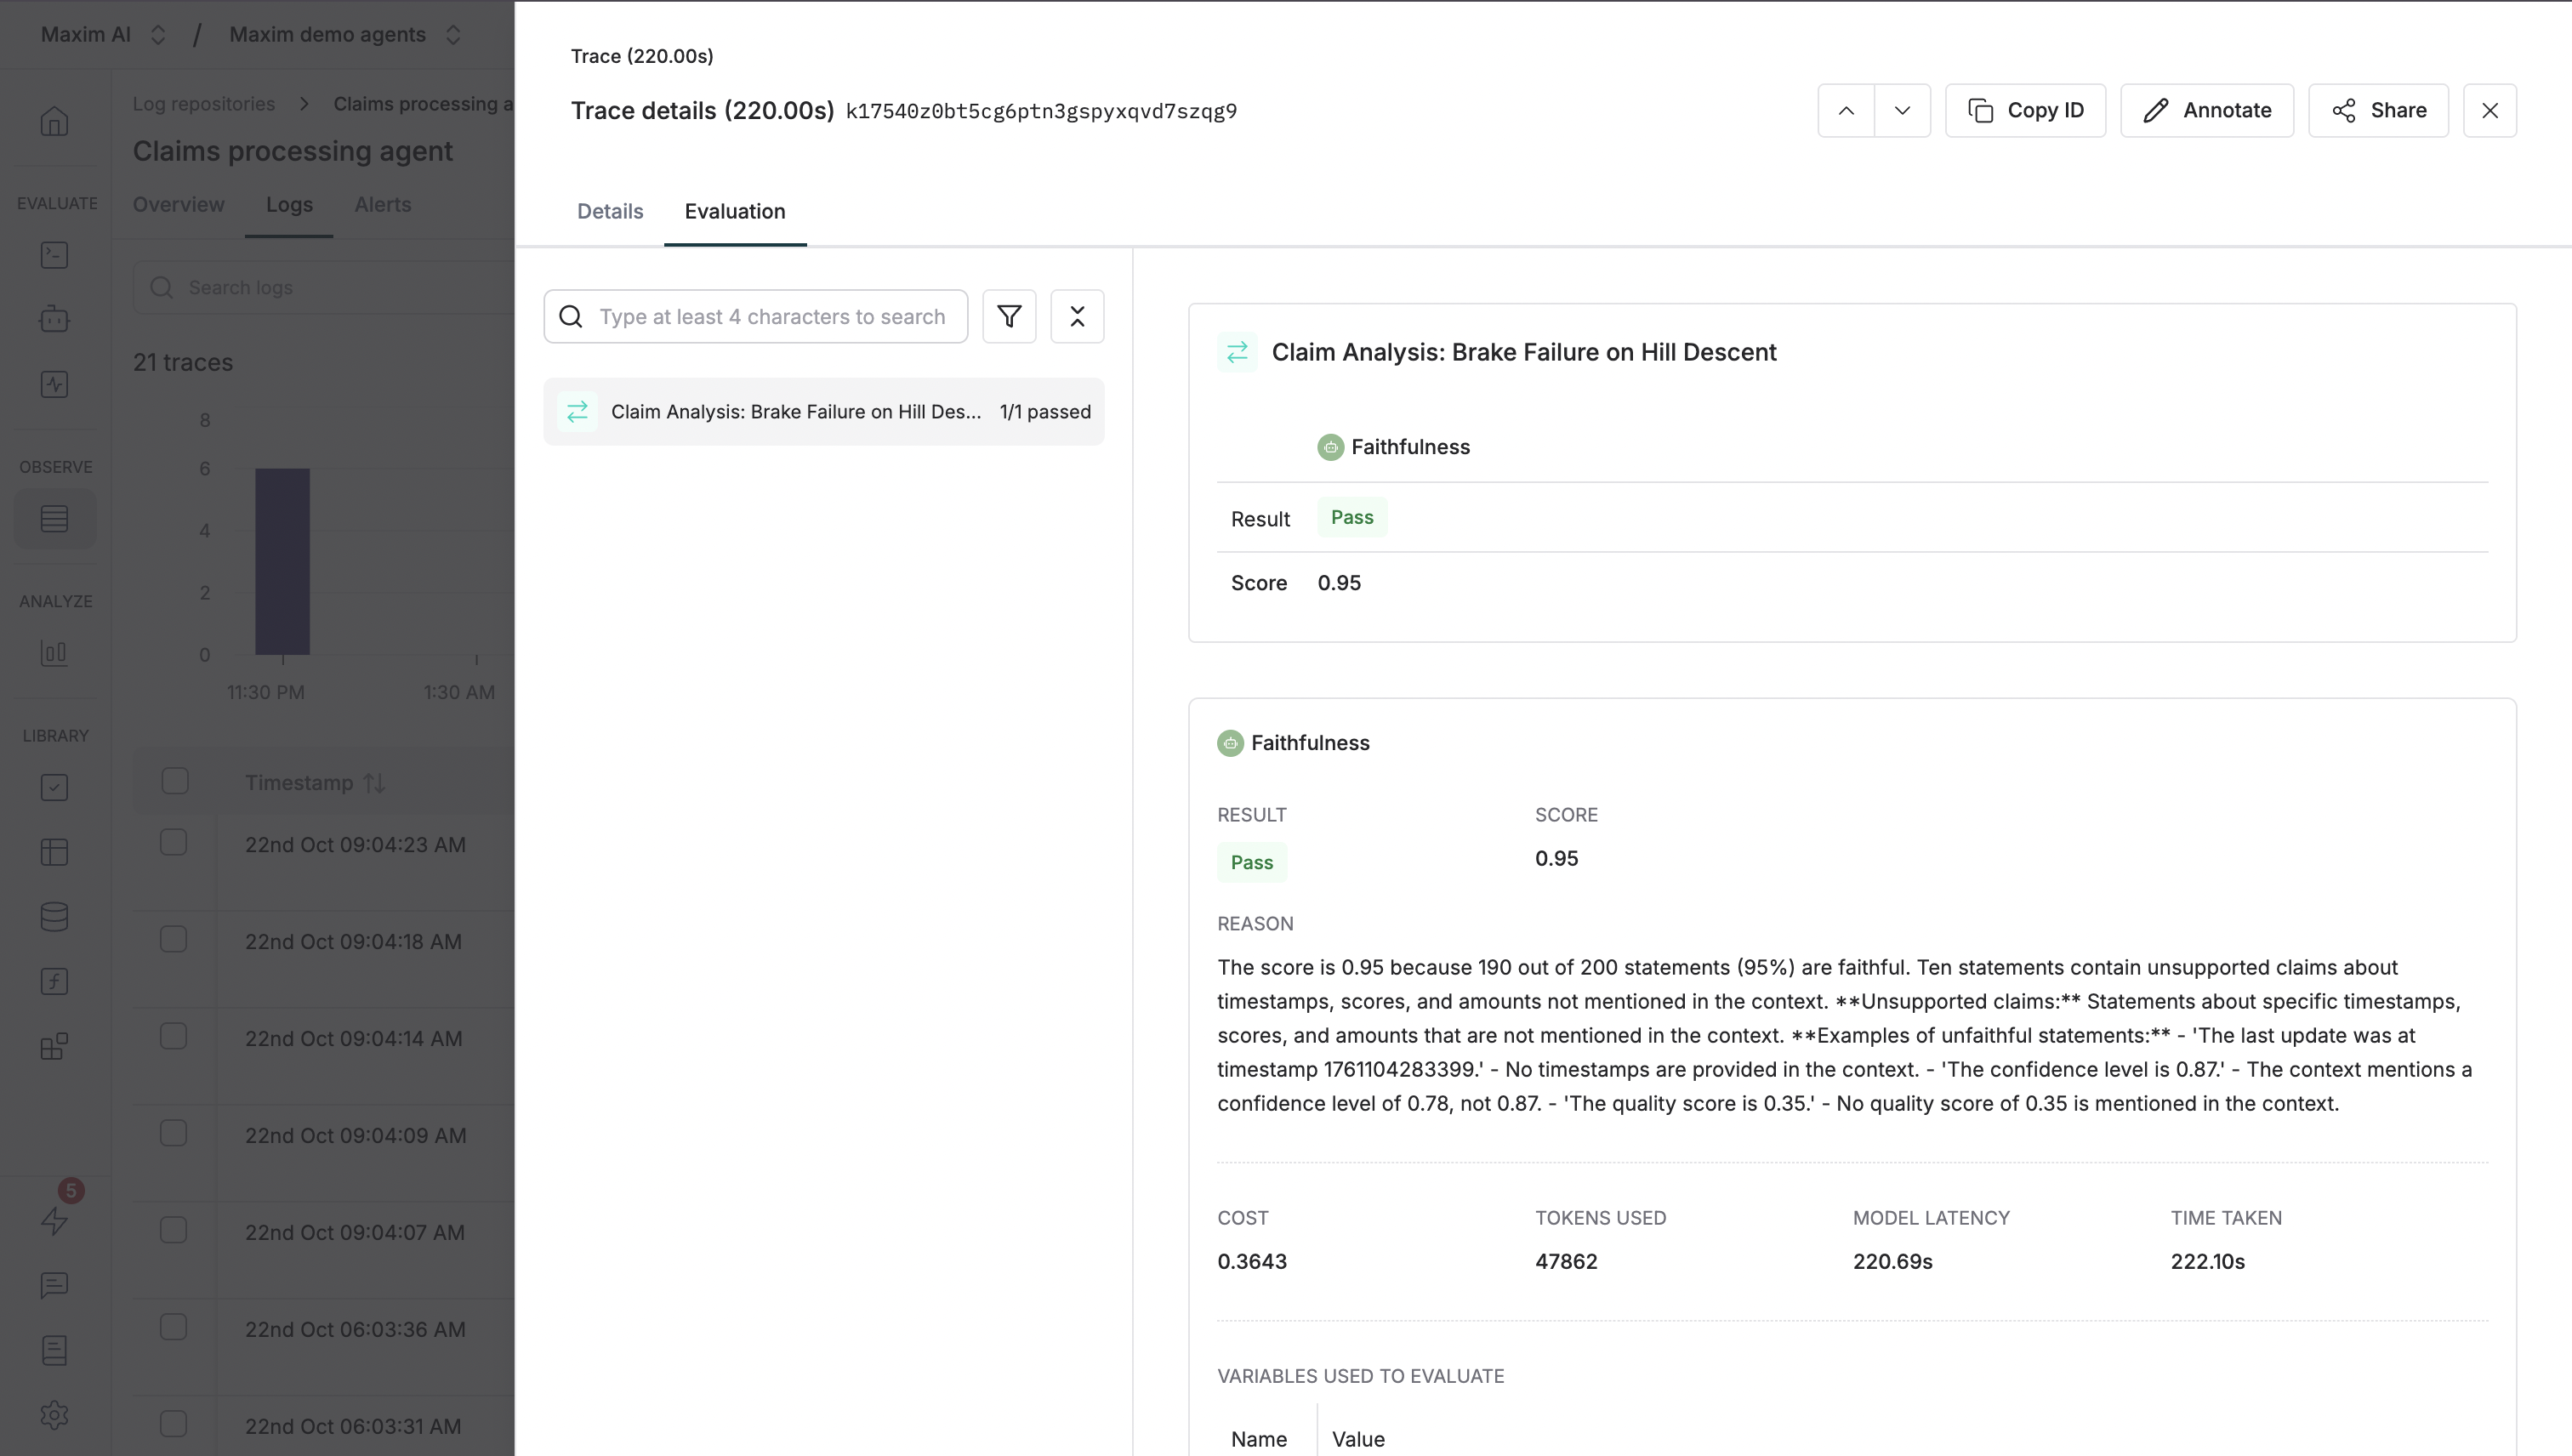 The evaluation tab displays many details regarding the evaluation of the trace, let us see how you can navigate through them and get more insights into how your LLM is performing.
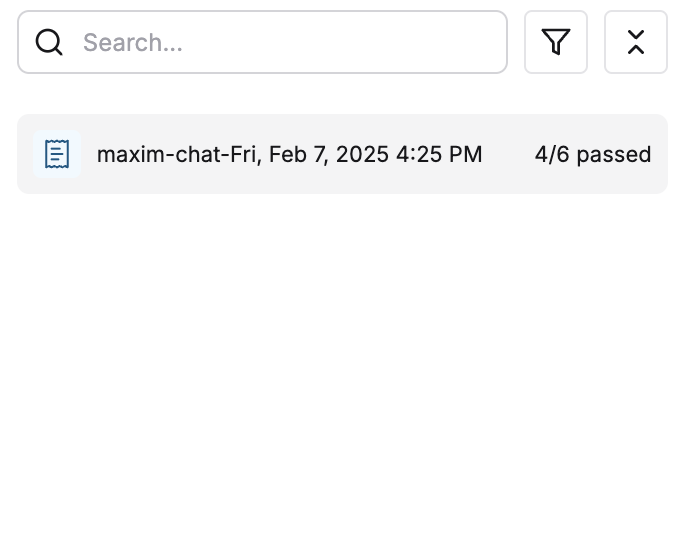
### Evaluation summary
Evaluation summary displays the following information (top to bottom, left to right):
* How many evaluators passed out of the total evaluators across the trace
* How much did all the evaluators' evaluation cost
* How many tokens were used across the all evaluators' evaluations
* What was the total time taken for the evaluation to process
### Evaluation cards by level
Depending on what levels you configured evaluators for, you'll see separate evaluation cards:
* **Session evaluation card**: Shows evaluators that ran on the entire session (multi-turn conversation)
* **Trace evaluation card**: Shows evaluators that ran on the individual trace (single interaction)
* **Span evaluation cards**: Shows evaluators that ran on specific components within the trace (configured via SDK)
In each card, you will find a tab switcher on the top right corner, this is used to navigate through the evaluation's details. Here is what you can find in different tabs:
#### Overview tab
The evaluation tab displays many details regarding the evaluation of the trace, let us see how you can navigate through them and get more insights into how your LLM is performing.
### Evaluation summary
Evaluation summary displays the following information (top to bottom, left to right):
* How many evaluators passed out of the total evaluators across the trace
* How much did all the evaluators' evaluation cost
* How many tokens were used across the all evaluators' evaluations
* What was the total time taken for the evaluation to process
### Evaluation cards by level
Depending on what levels you configured evaluators for, you'll see separate evaluation cards:
* **Session evaluation card**: Shows evaluators that ran on the entire session (multi-turn conversation)
* **Trace evaluation card**: Shows evaluators that ran on the individual trace (single interaction)
* **Span evaluation cards**: Shows evaluators that ran on specific components within the trace (configured via SDK)
In each card, you will find a tab switcher on the top right corner, this is used to navigate through the evaluation's details. Here is what you can find in different tabs:
#### Overview tab
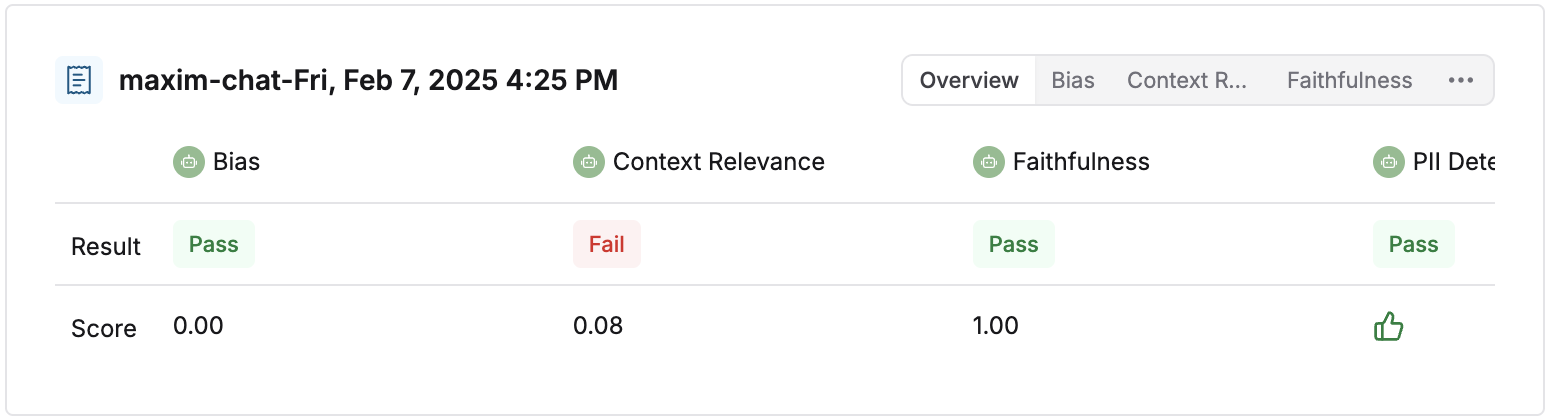 All the evaluators run on the trace level and their scores are displayed in a table here along with whether the evaluator passed or failed.
#### Individual evaluator's tab
All the evaluators run on the trace level and their scores are displayed in a table here along with whether the evaluator passed or failed.
#### Individual evaluator's tab
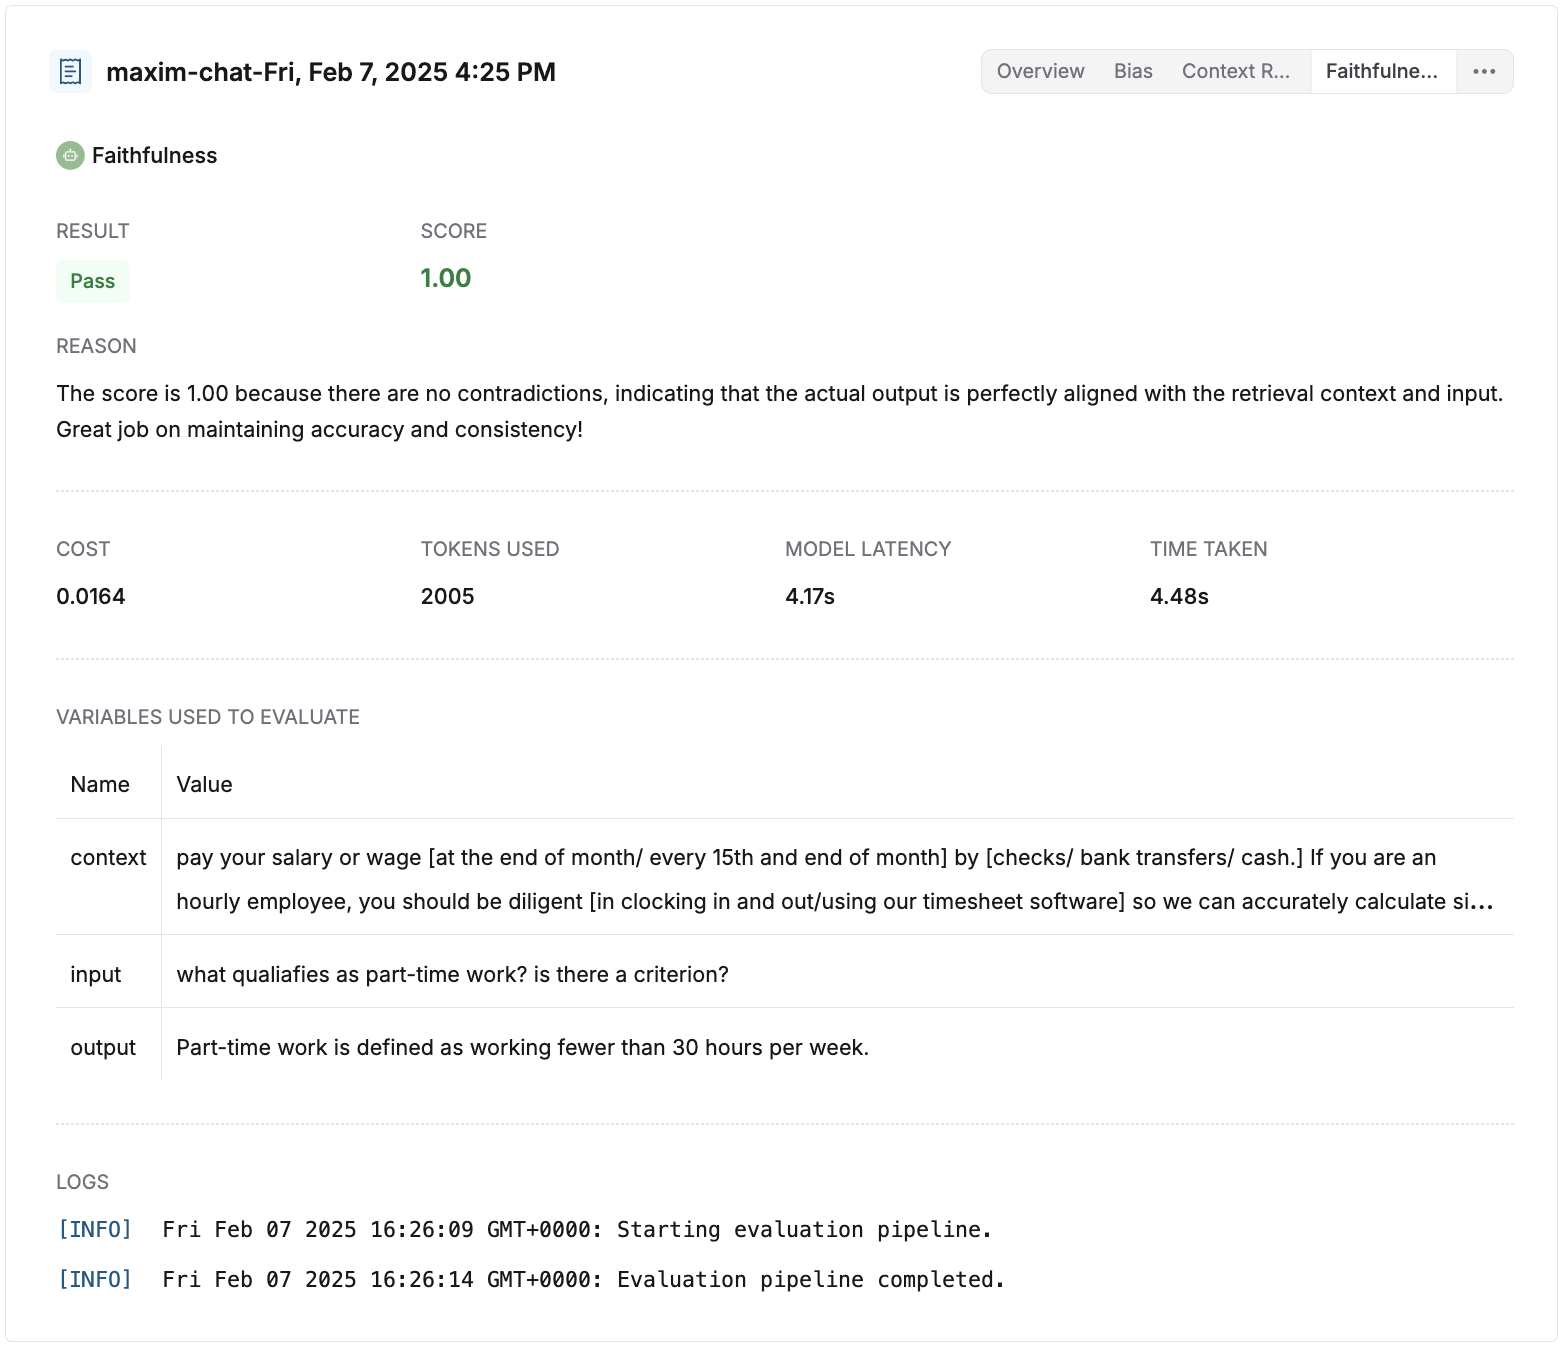 This tab contains the following sections:
* **Result**: Shows whether the evaluator passed or failed.
* **Score**: Shows the score of the evaluator.
* **Reason** (shown where applicable): Displays the reasoning behind the score of the evaluator, if given.
* **Cost** (shown where applicable): Shows the cost of the individual evaluator's evaluation.
* **Tokens used** (shown where applicable): Shows the number of tokens used by the individual evaluator's evaluation.
* **Model latency** (shown where applicable): Shows the time taken by the model to respond back with a result for an evaluator.
* **Time taken**: Shows the time taken by the evaluator to evaluate.
* **Variables used to evaluate**: Shows the values that were used to replace the variables with while processing the evaluator.
* **Logs**: These are logs that were generated during the evaluation process. They might be useful for debugging errors or issues that occurred during the evaluation.
### Tree view on the left panel
This tab contains the following sections:
* **Result**: Shows whether the evaluator passed or failed.
* **Score**: Shows the score of the evaluator.
* **Reason** (shown where applicable): Displays the reasoning behind the score of the evaluator, if given.
* **Cost** (shown where applicable): Shows the cost of the individual evaluator's evaluation.
* **Tokens used** (shown where applicable): Shows the number of tokens used by the individual evaluator's evaluation.
* **Model latency** (shown where applicable): Shows the time taken by the model to respond back with a result for an evaluator.
* **Time taken**: Shows the time taken by the evaluator to evaluate.
* **Variables used to evaluate**: Shows the values that were used to replace the variables with while processing the evaluator.
* **Logs**: These are logs that were generated during the evaluation process. They might be useful for debugging errors or issues that occurred during the evaluation.
### Tree view on the left panel
 When you click on any node in the tree view, the right panel displays the evaluation results specific to that level. This helps you understand which component's evaluation you're viewing and its place in the overall interaction hierarchy.
Learn more about evaluating individual components in [Node Level Evaluation](/online-evals/via-sdk/node-level-evaluation).
## Multiple configurations for auto evaluations
You can create multiple configurations on a single log repository for auto evaluations. Each configuration can be used to evaluate logs based on different criteria.
Click on the `Add configuration` button in the top right corner of the sheet. This will add a new configuration to the list.
You can add or remove evaluators, filters, and sampling rate for each configuration. Check the [Setting Up Auto Evaluation on Logs](#setting-up-auto-evaluation) section for more details on setting up a single configuration.
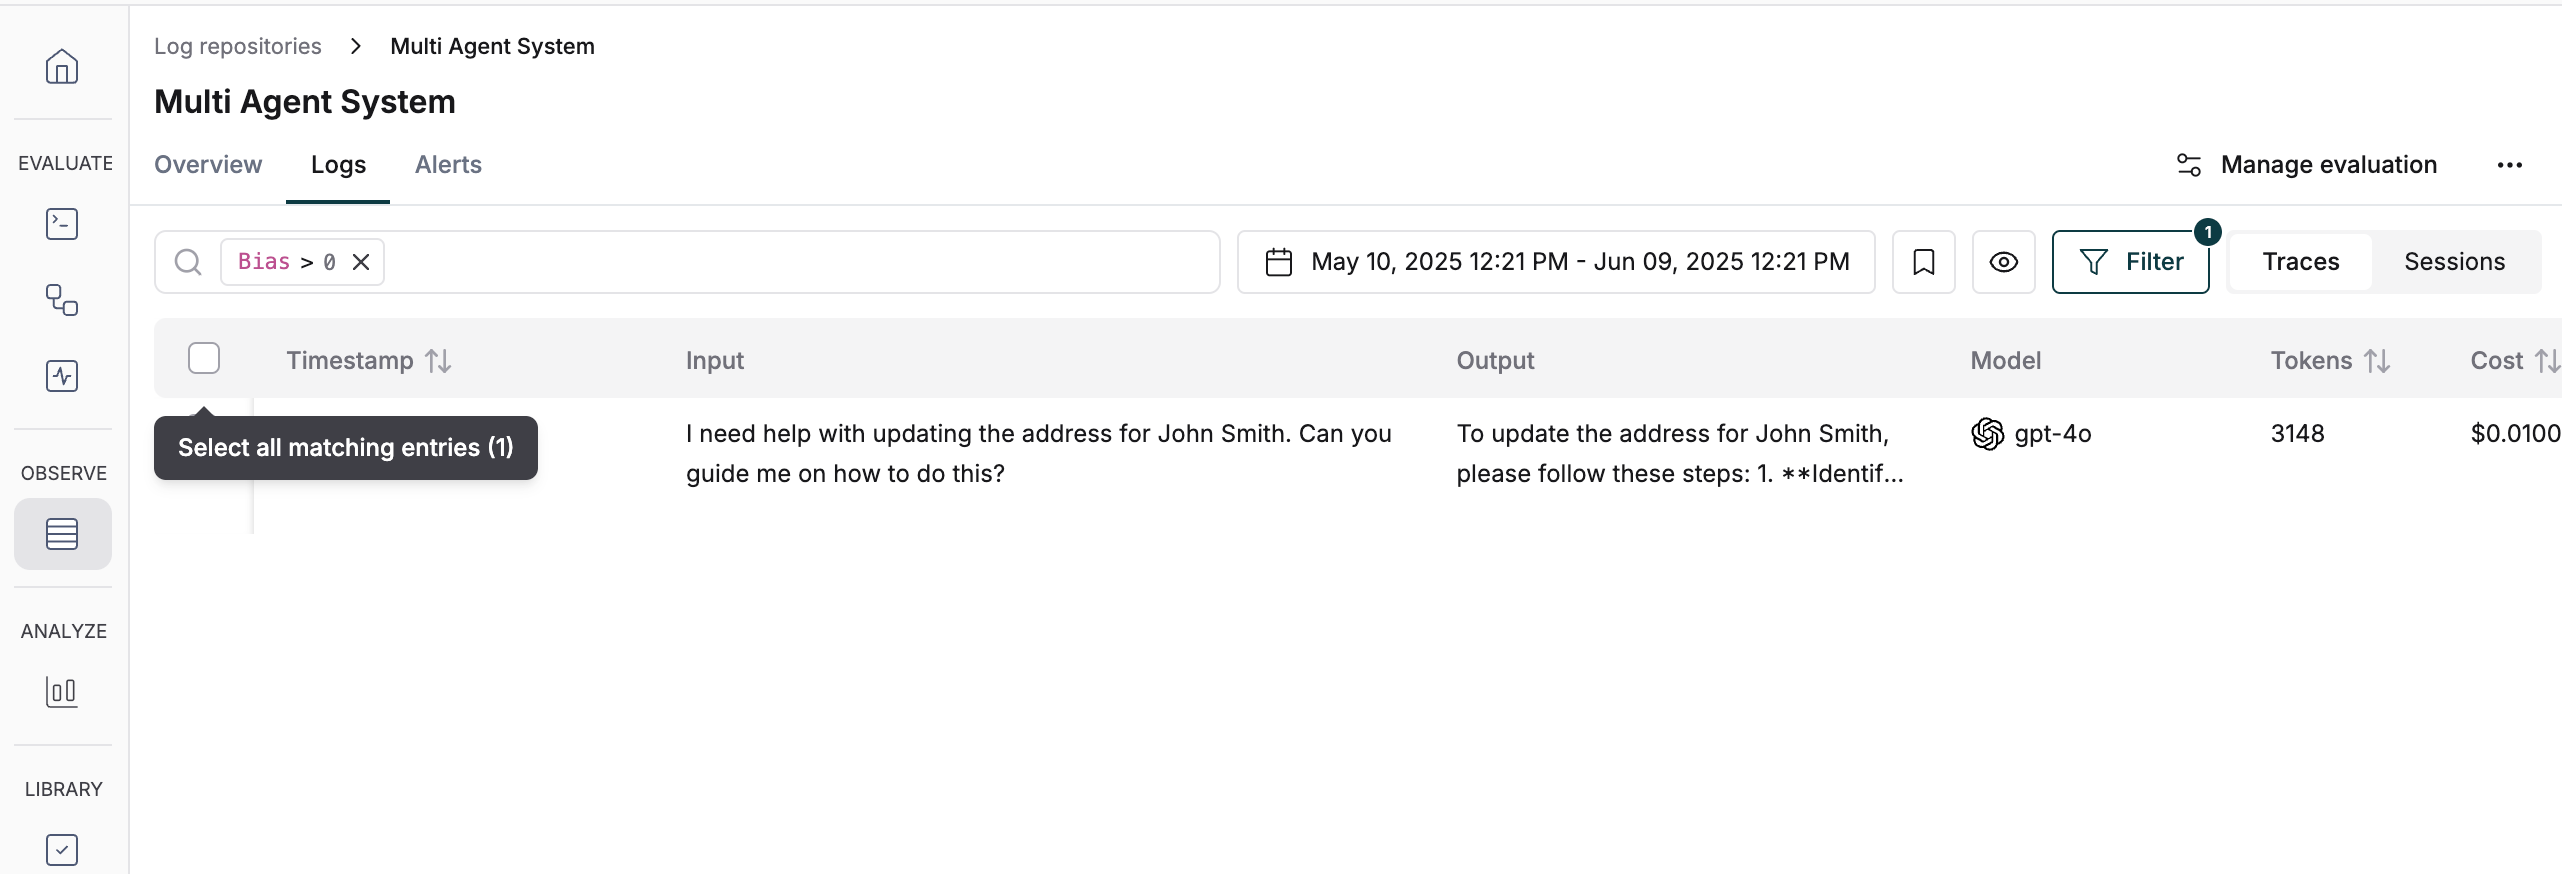
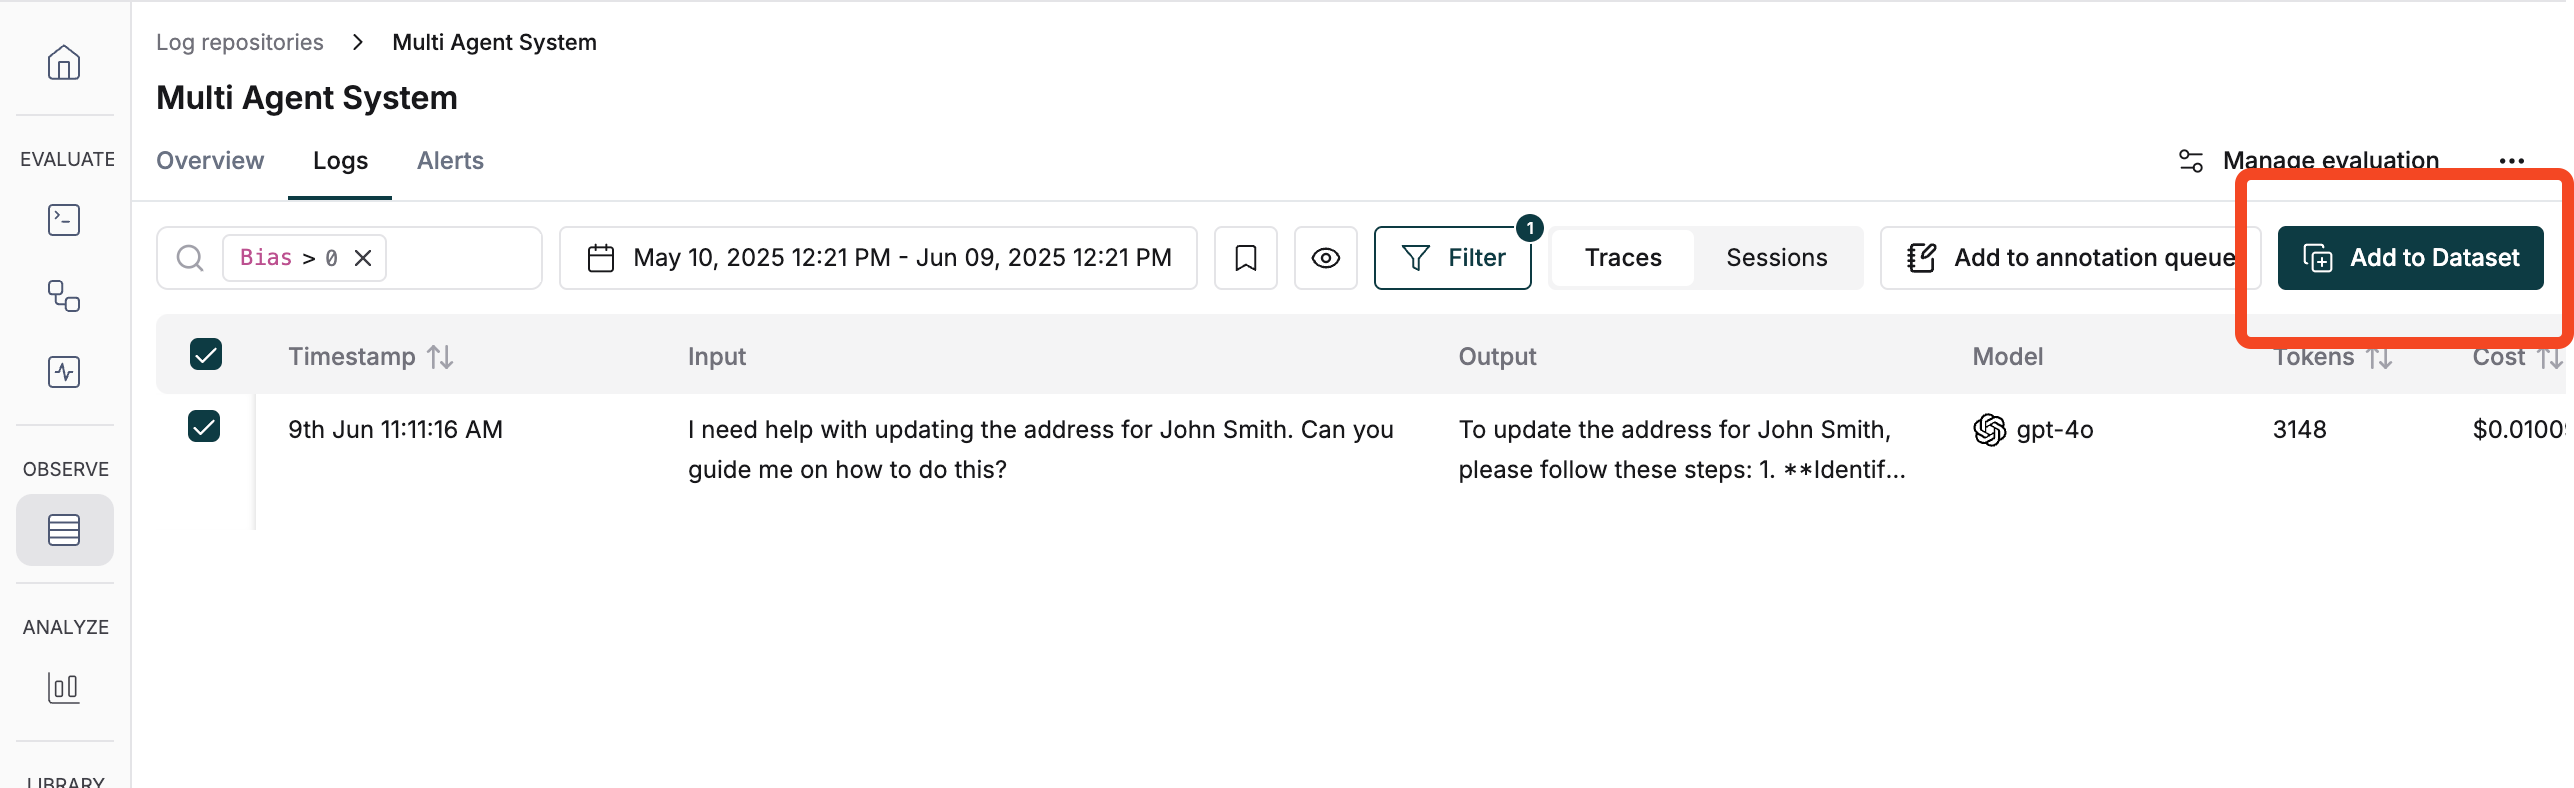
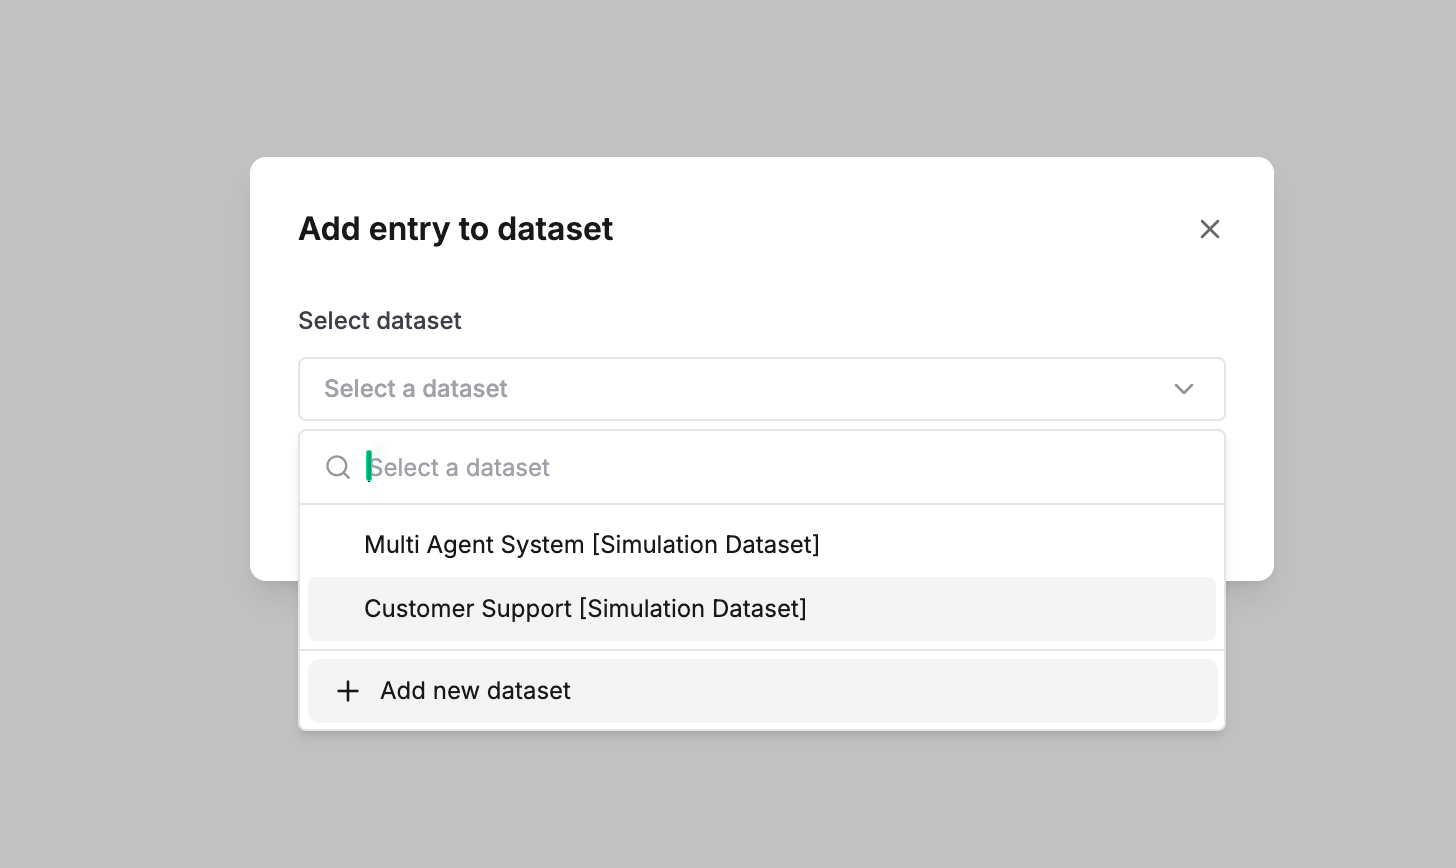
## Dataset Curation
Once you have logs and evaluations in Maxim, you can easily curate datasets by filtering and selecting logs based on different criteria.
When you click on any node in the tree view, the right panel displays the evaluation results specific to that level. This helps you understand which component's evaluation you're viewing and its place in the overall interaction hierarchy.
Learn more about evaluating individual components in [Node Level Evaluation](/online-evals/via-sdk/node-level-evaluation).
## Multiple configurations for auto evaluations
You can create multiple configurations on a single log repository for auto evaluations. Each configuration can be used to evaluate logs based on different criteria.
Click on the `Add configuration` button in the top right corner of the sheet. This will add a new configuration to the list.
You can add or remove evaluators, filters, and sampling rate for each configuration. Check the [Setting Up Auto Evaluation on Logs](#setting-up-auto-evaluation) section for more details on setting up a single configuration.
## Dataset Curation
Once you have logs and evaluations in Maxim, you can easily curate datasets by filtering and selecting logs based on different criteria.
 [Schedule a demo](https://getmaxim.ai/demo) to see how Maxim AI helps teams ship reliable agents.