> ## Documentation Index
> Fetch the complete documentation index at: https://www.getmaxim.ai/docs/llms.txt
> Use this file to discover all available pages before exploring further.
# Test Runs Comparison Dashboard
> Learn how to create a comparison report for your test runs
## Create a comparison dashboard
Go to the Dashboard tab from the left-hand side and click on "Generate Comparison Dashboard"
 Name your comparison report something descriptive (e.g., "Co-pilot Nov Updates Comparison")
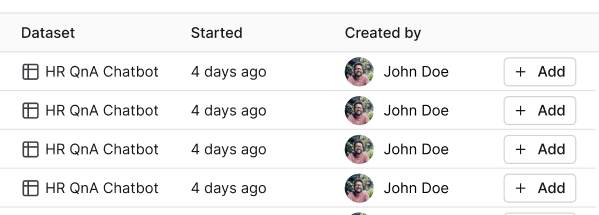
Pick the runs you want to compare by clicking the add button next to each one
Name your comparison report something descriptive (e.g., "Co-pilot Nov Updates Comparison")
Pick the runs you want to compare by clicking the add button next to each one
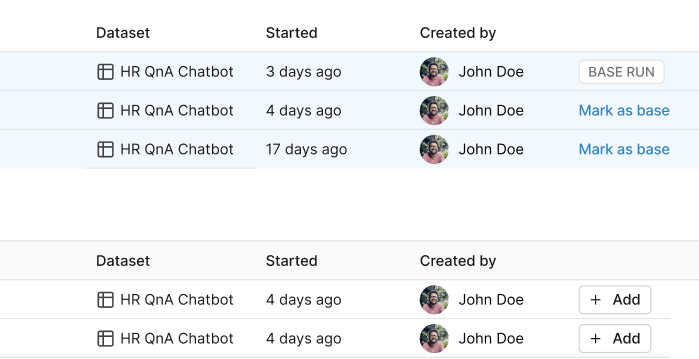
 You can set any run as your base run to compare others against
 Use the search bar and filters to find specific runs
Click "Create dashboard" and you're all set
## Understand your comparison report
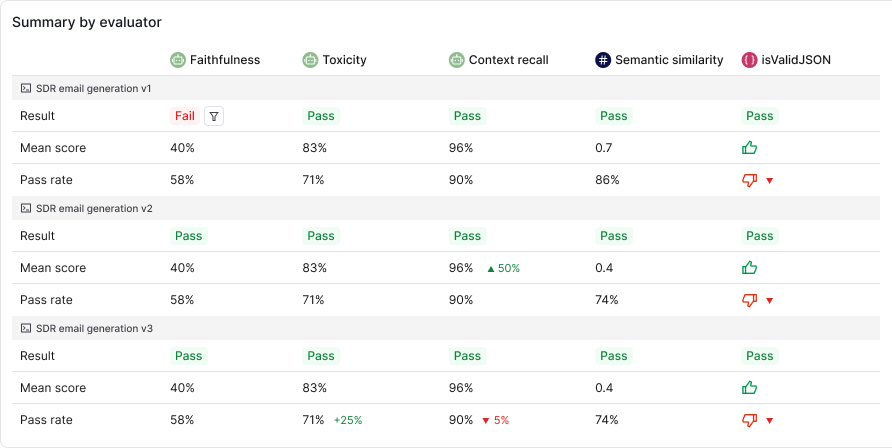
You'll see several key metrics and visualizations:
* Summary by Evaluator
* Cost by Prompt
* Token usage
* Latency metrics
If you've set a base run, you'll see how metrics change compared to that baseline.
Use the search bar and filters to find specific runs
Click "Create dashboard" and you're all set
## Understand your comparison report
You'll see several key metrics and visualizations:
* Summary by Evaluator
* Cost by Prompt
* Token usage
* Latency metrics
If you've set a base run, you'll see how metrics change compared to that baseline.
 ## Update your report
Hover over the report title and click "Edit" to add new runs, remove existing ones, or change your base run.
## Update your report
Hover over the report title and click "Edit" to add new runs, remove existing ones, or change your base run.
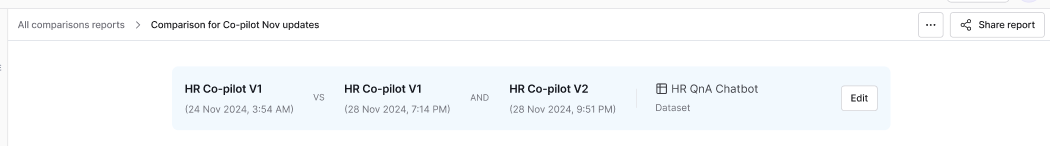 ## Share your report
Just click the "Share report" button at the top of the page to share with your team.
## Share your report
Just click the "Share report" button at the top of the page to share with your team.