> ## Documentation Index
> Fetch the complete documentation index at: https://www.getmaxim.ai/docs/llms.txt
> Use this file to discover all available pages before exploring further.
# Live Trends Dashboard
> Visualize key metrics across the latest test runs for a selected entity
Live trends dashboards help you visualize key metrics across the most recent test runs for a selected entity. This helps in continuous monitoring of the entity's performance and protection against regressions.
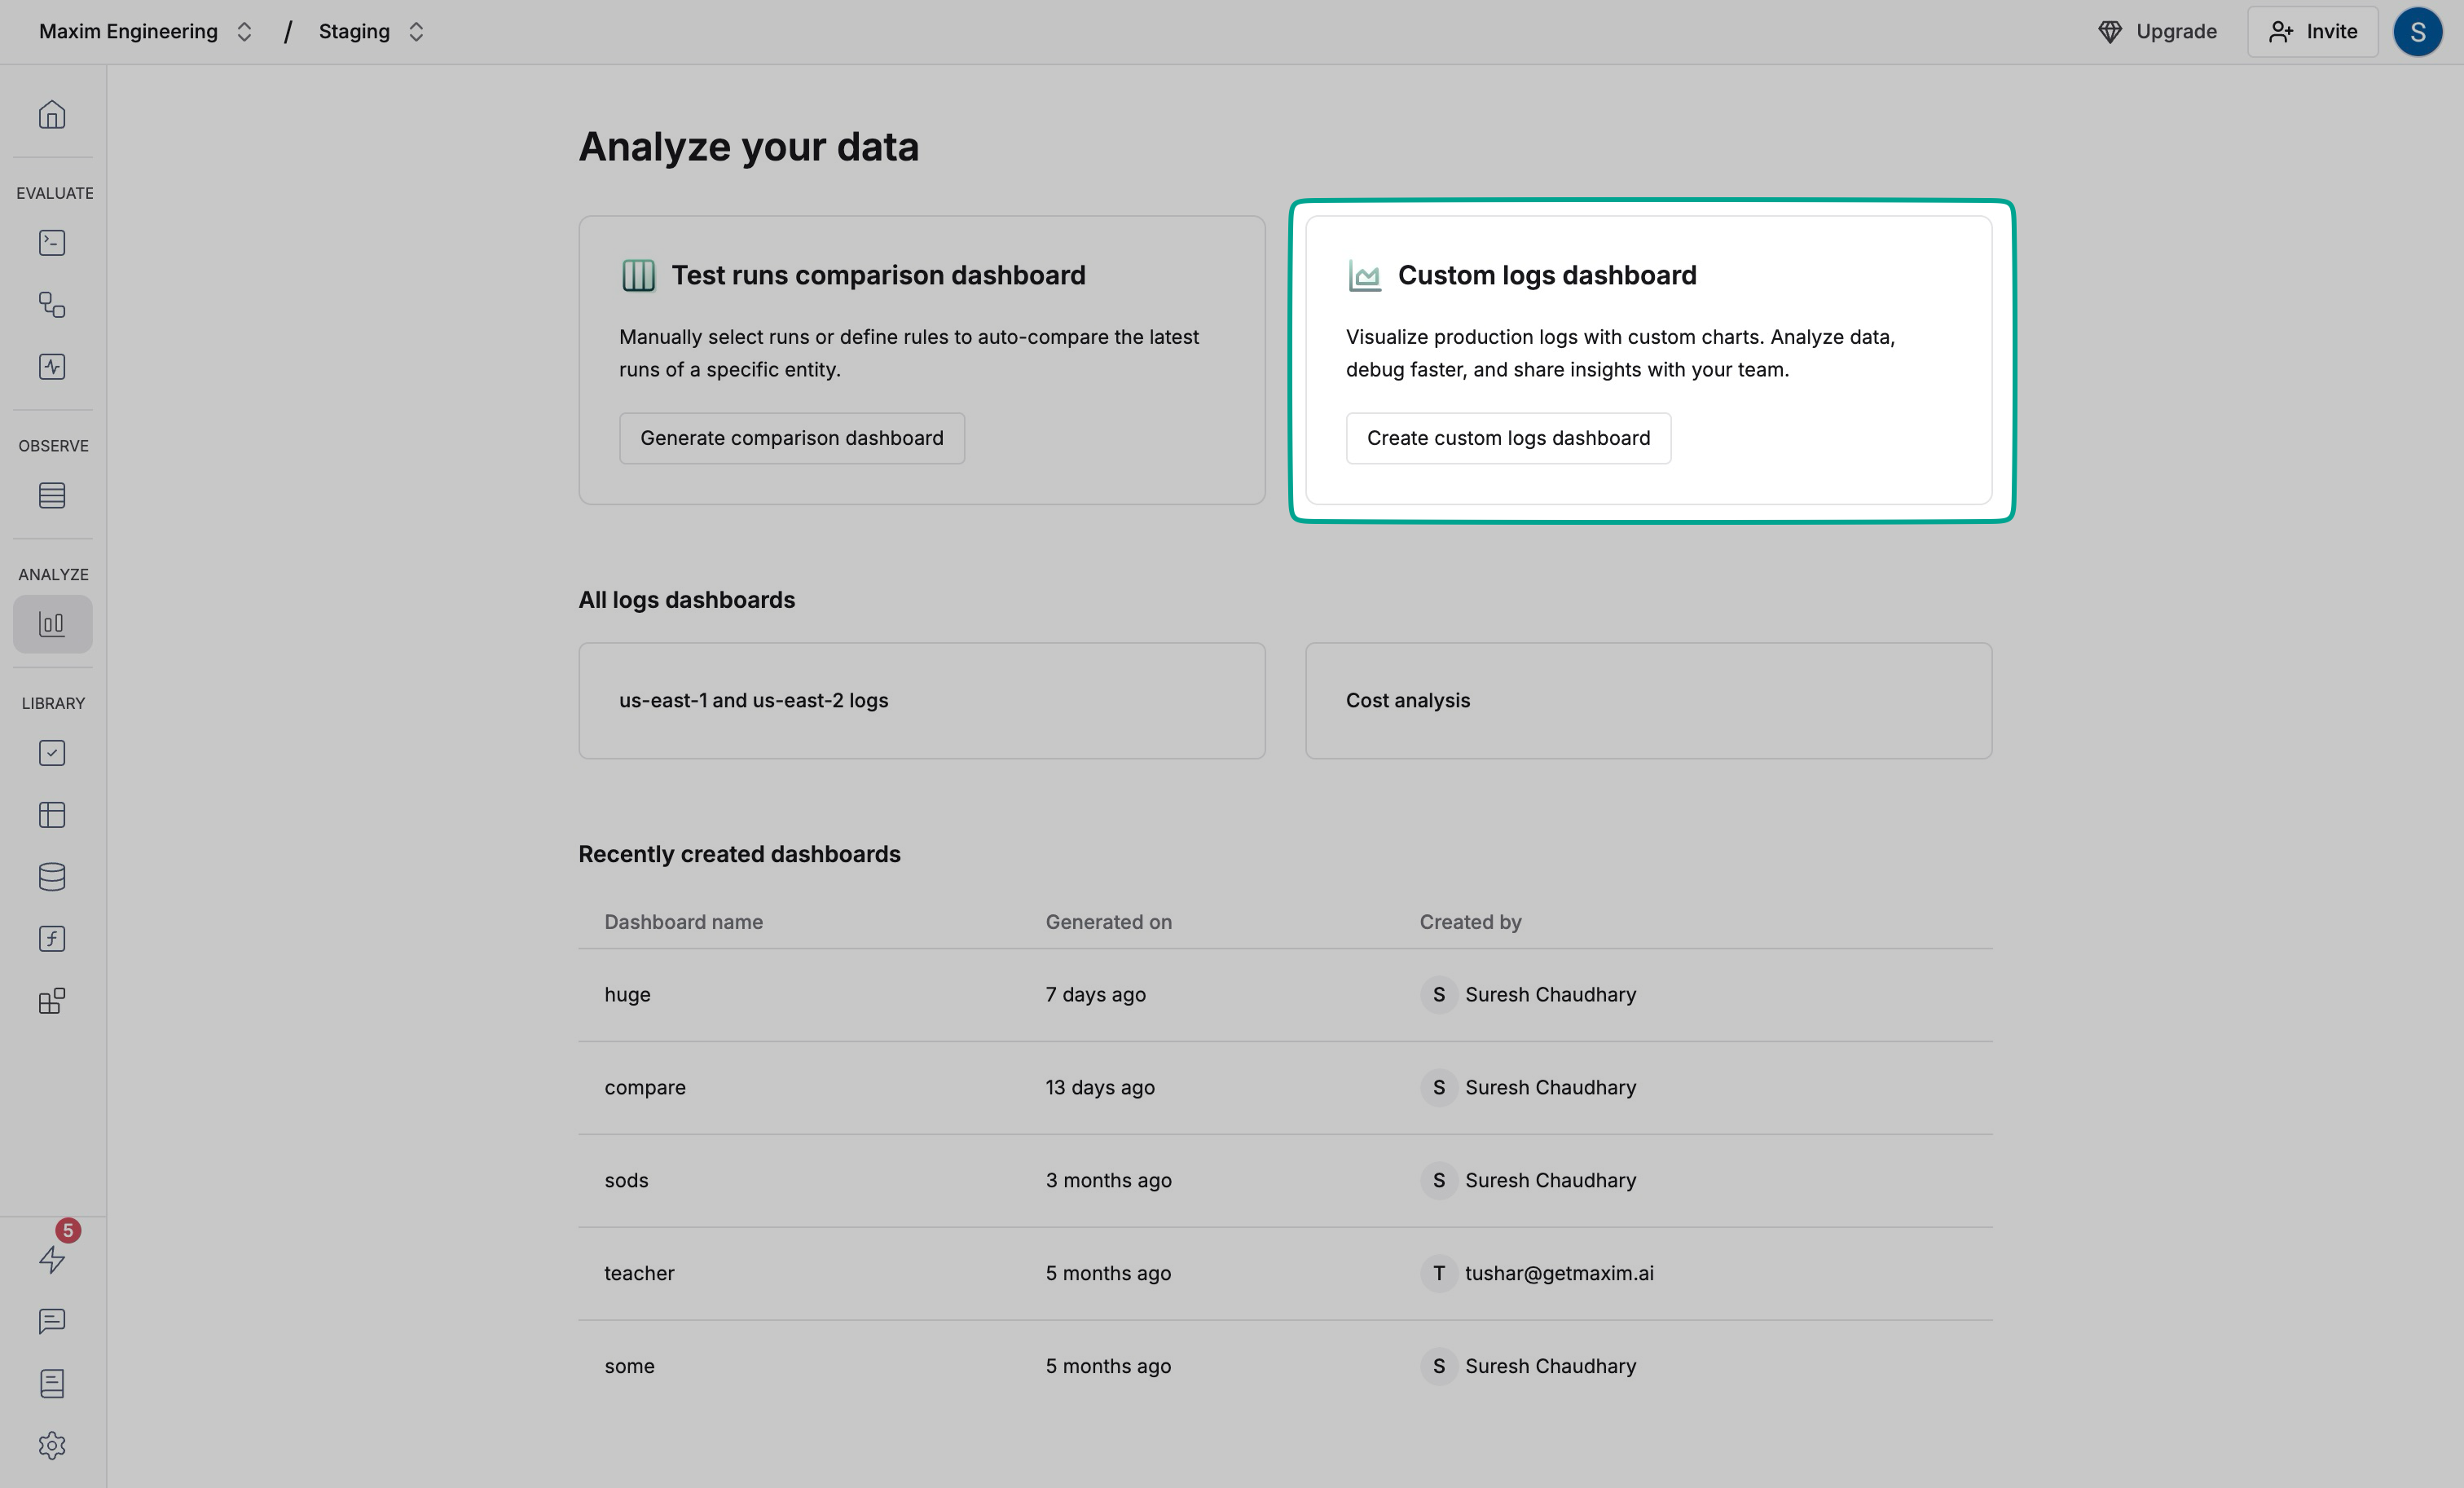
## Creating your first live trends dashboard
Select **Dashboards** in the left sidebar and click `Generate comparison dashboard`
 Select Live trends and enter a name that describes the dashboard's purpose
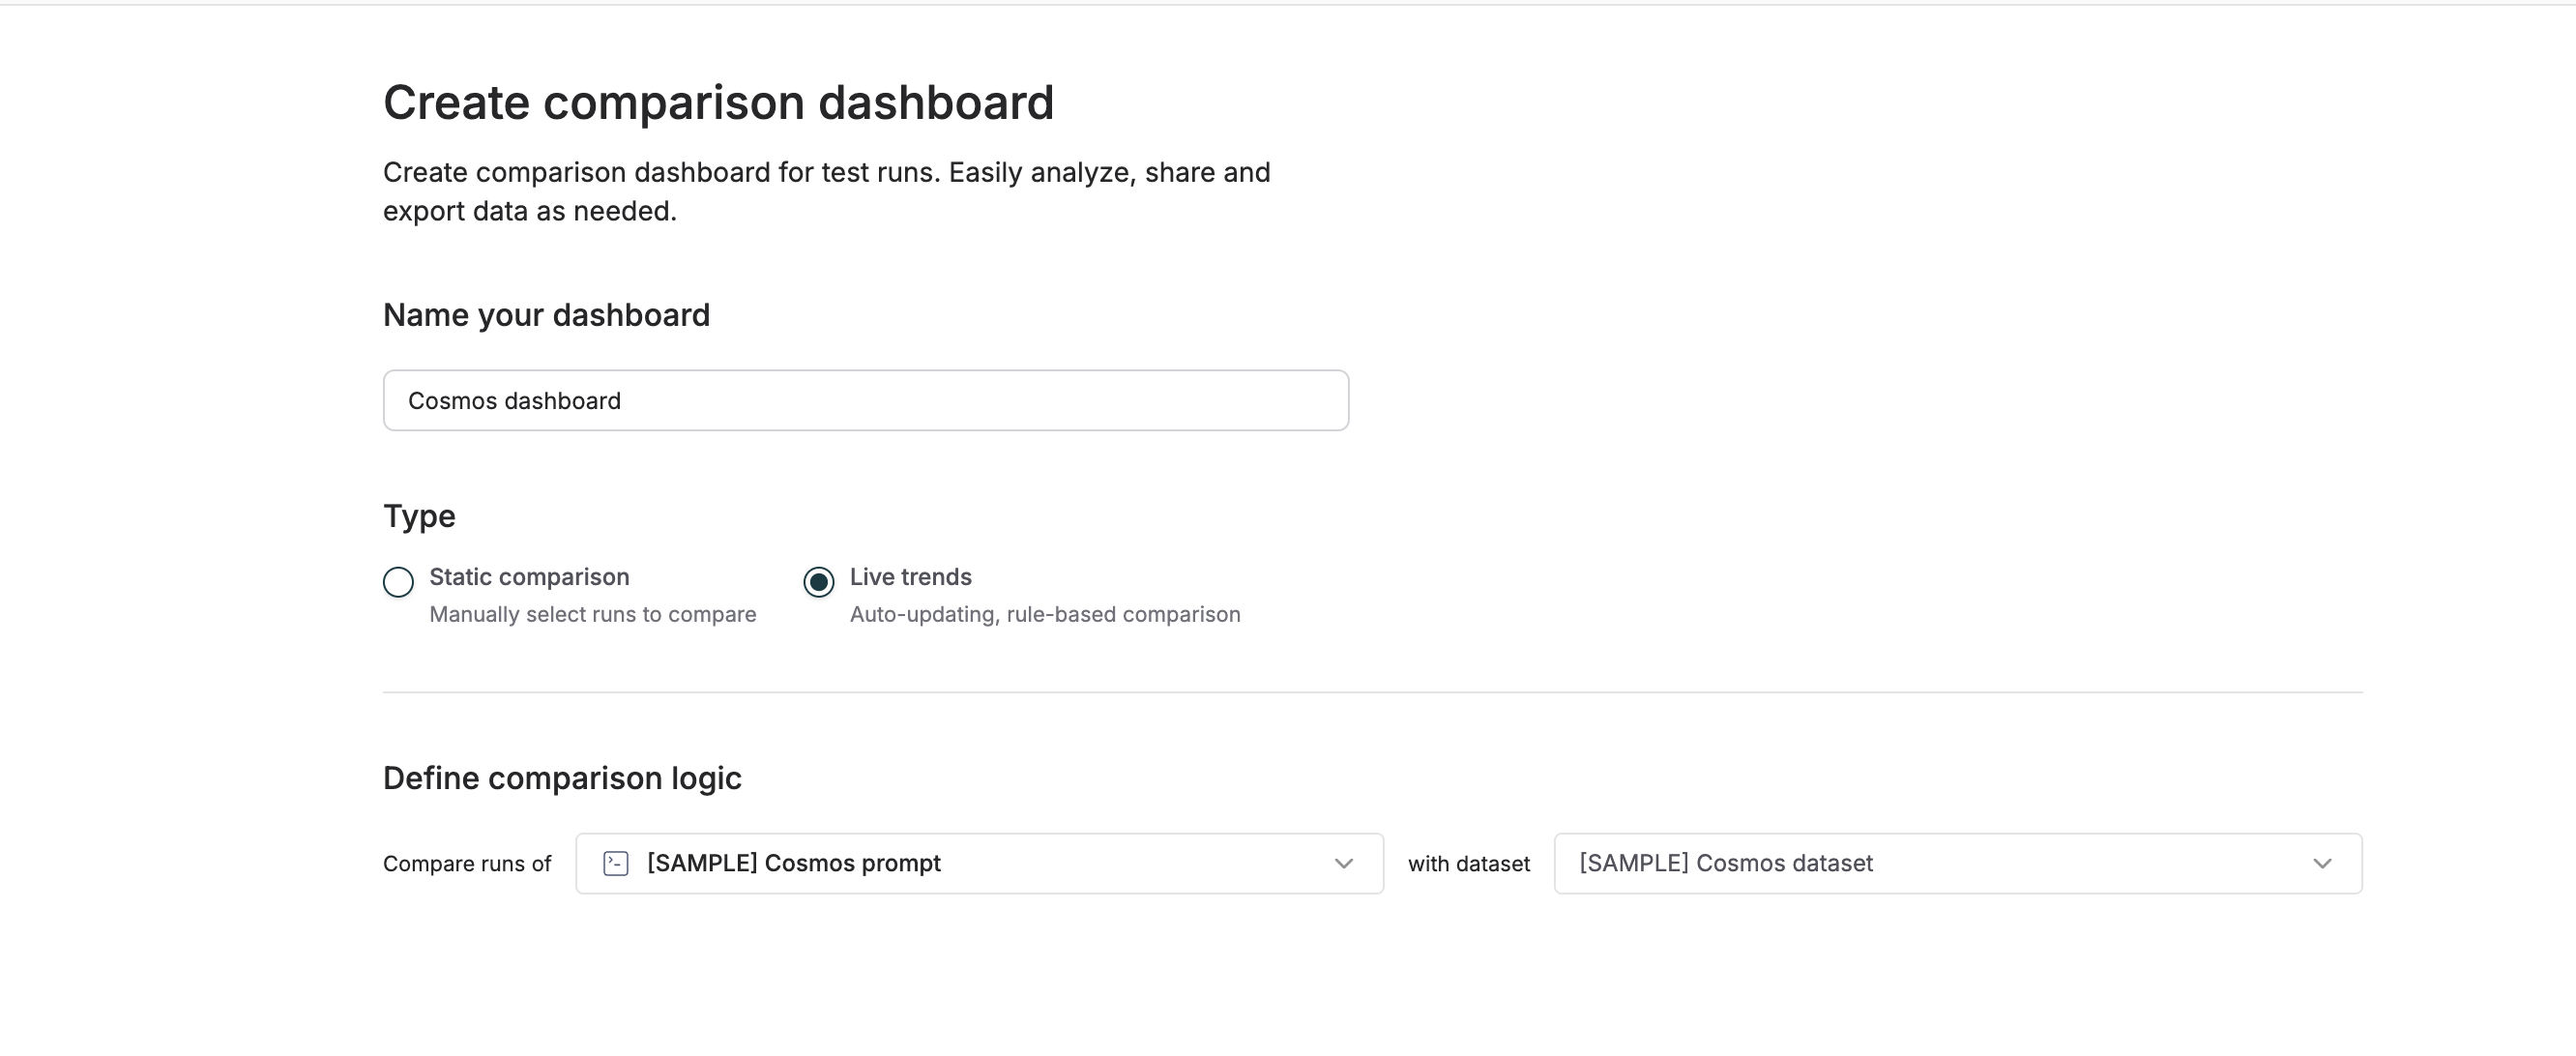 Select the entity you want to monitor from the dropdown and click on `Create dashboard` on the bottom of the screen.
You can also select the number of recent runs you want to include in the dashboard from the button in the top right corner of the screen.
## Understanding the dashboard
You will now receive a detailed dashboard with the most recent test runs for the selected entity.
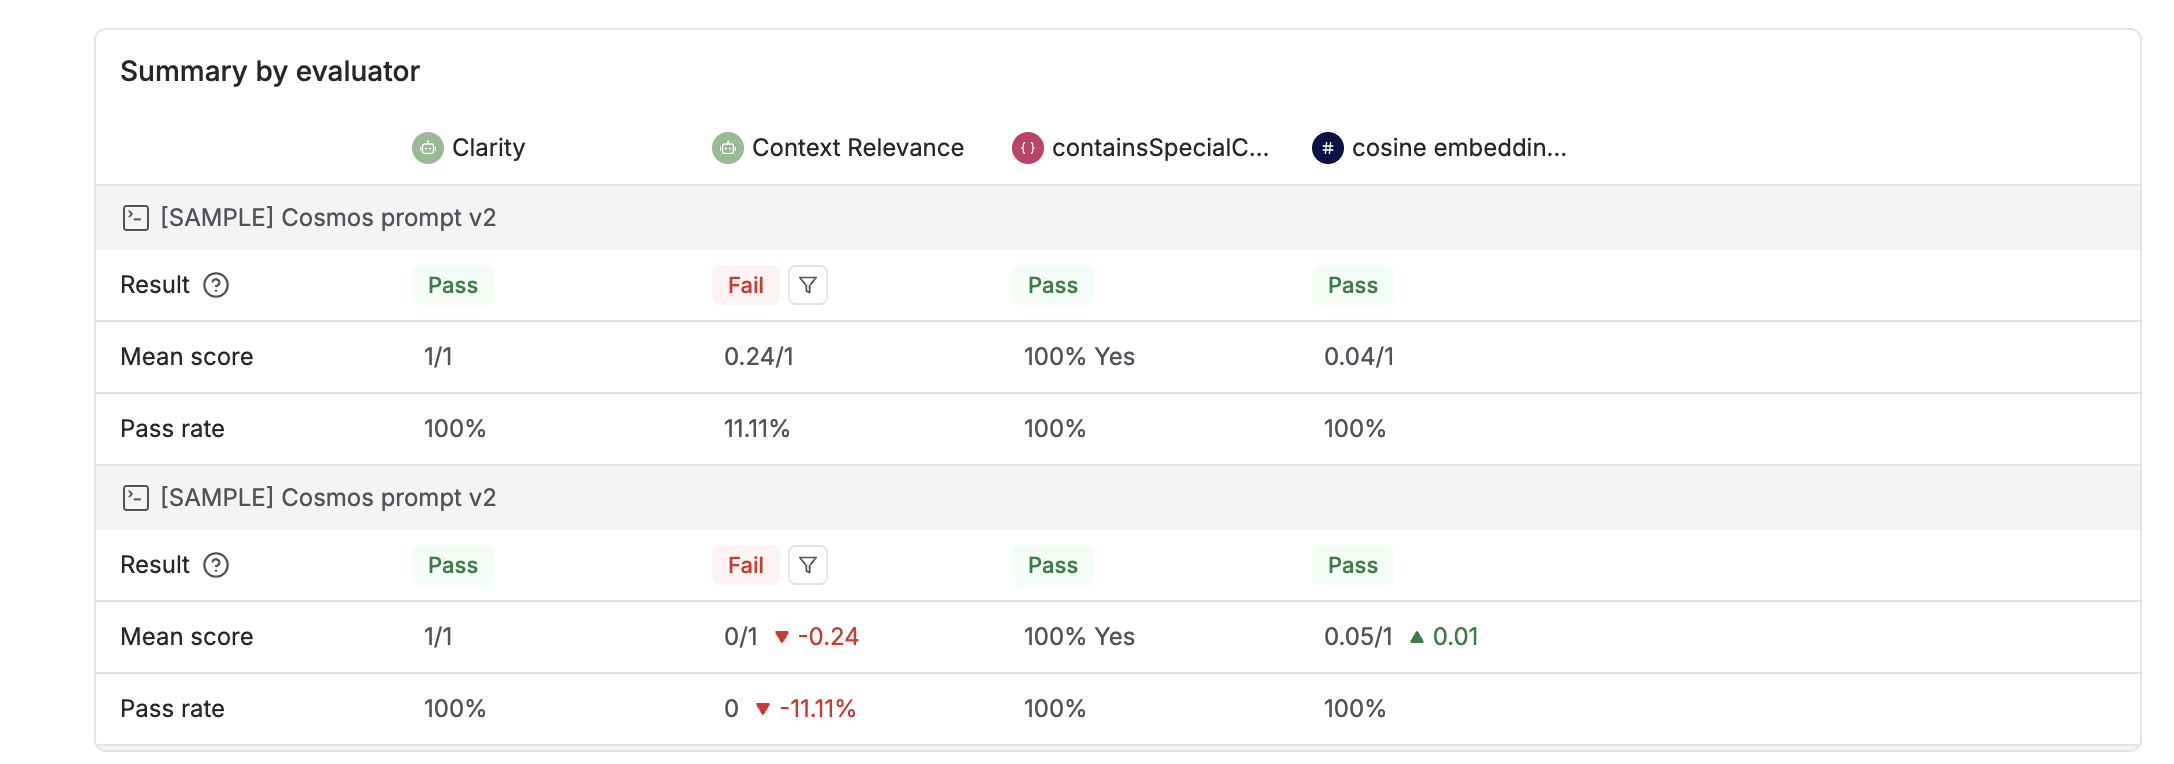
### Evaluator summary
Select the entity you want to monitor from the dropdown and click on `Create dashboard` on the bottom of the screen.
You can also select the number of recent runs you want to include in the dashboard from the button in the top right corner of the screen.
## Understanding the dashboard
You will now receive a detailed dashboard with the most recent test runs for the selected entity.
### Evaluator summary
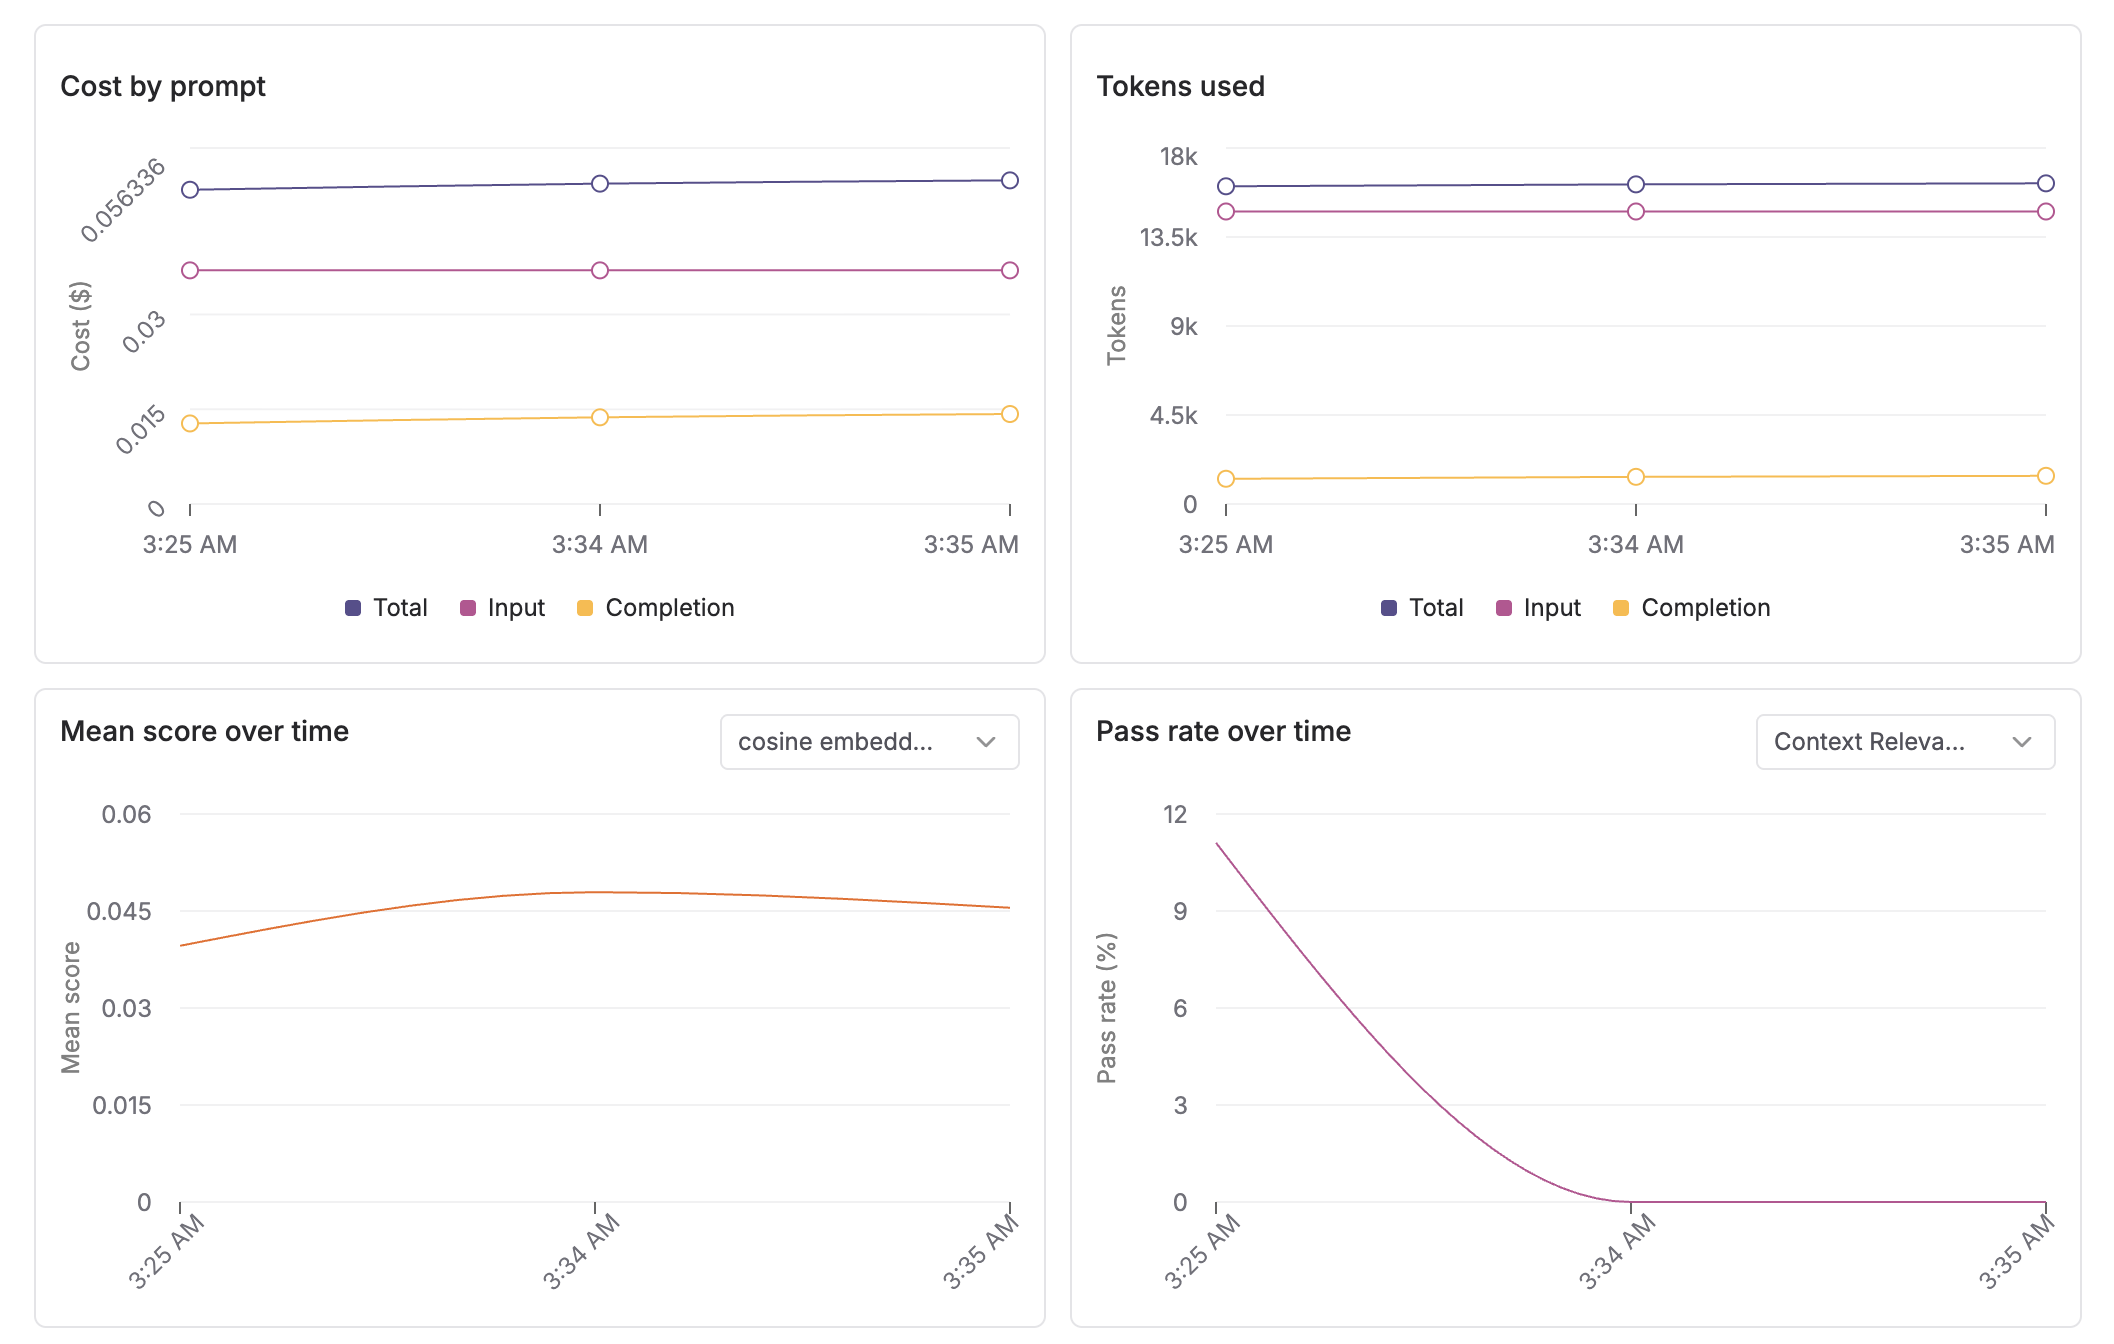
 ### Visualizations for various metrics
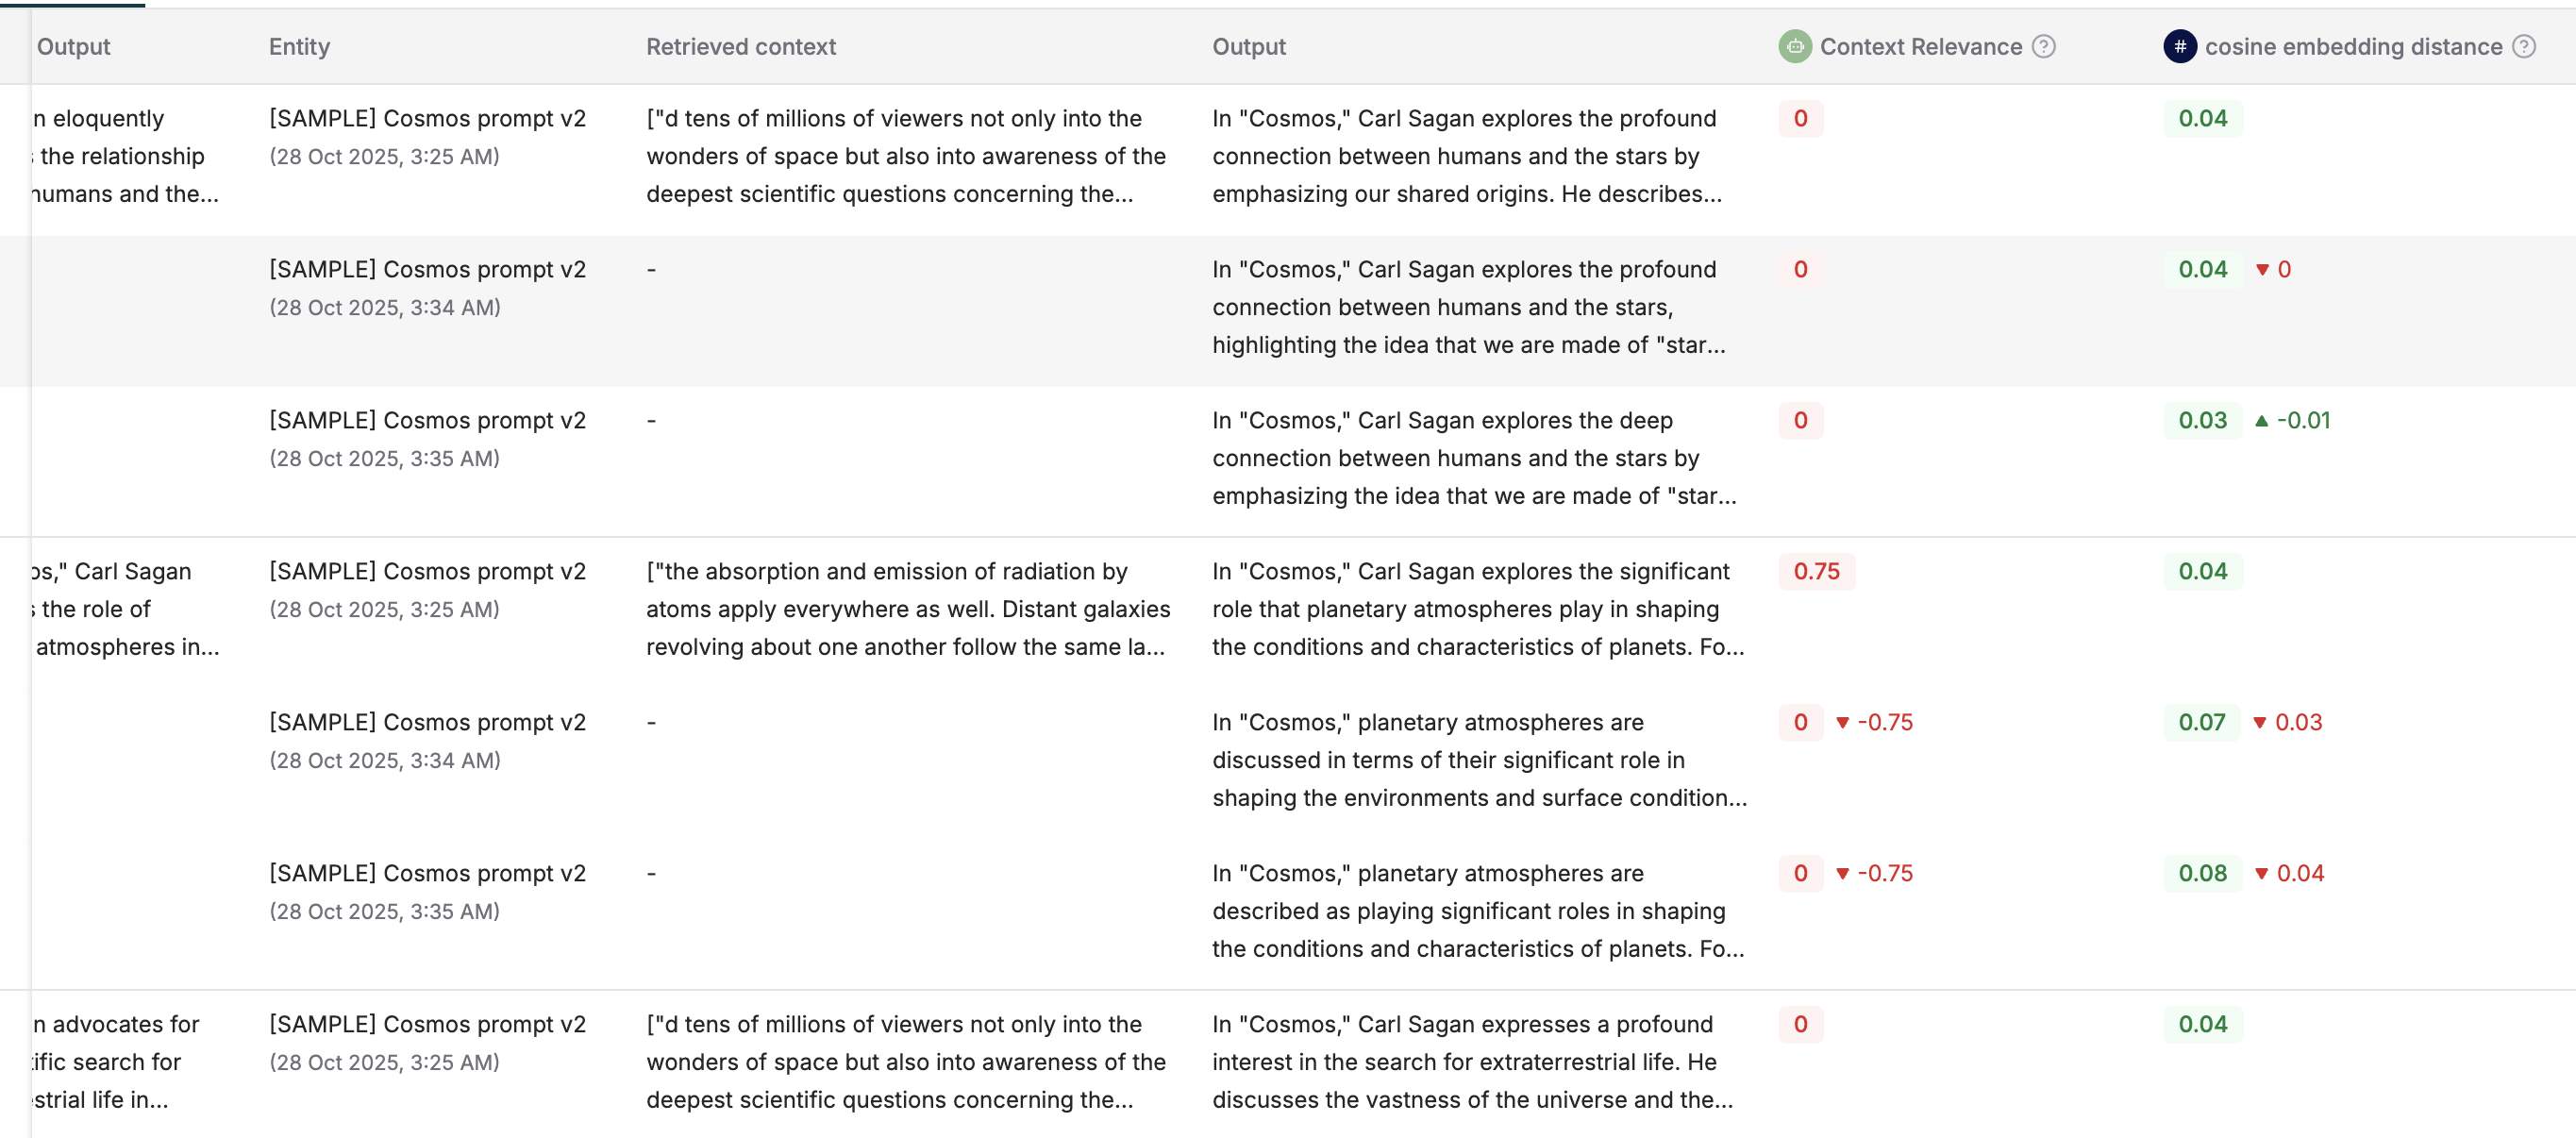
 ### Run comparisons
 ## Sharing your dashboard
You can share your dashboard with your team by clicking the `Share dashboard` button in the top right corner of the screen.
## Sharing your dashboard
You can share your dashboard with your team by clicking the `Share dashboard` button in the top right corner of the screen.