> ## Documentation Index
> Fetch the complete documentation index at: https://www.getmaxim.ai/docs/llms.txt
> Use this file to discover all available pages before exploring further.
# Custom Logs Dashboards
> Create custom dashboards to analyze and track your AI application logs across repositories using configurable metrics, filters, and charts.
export const MaximPlayer = ({url}) => {
return ;
};
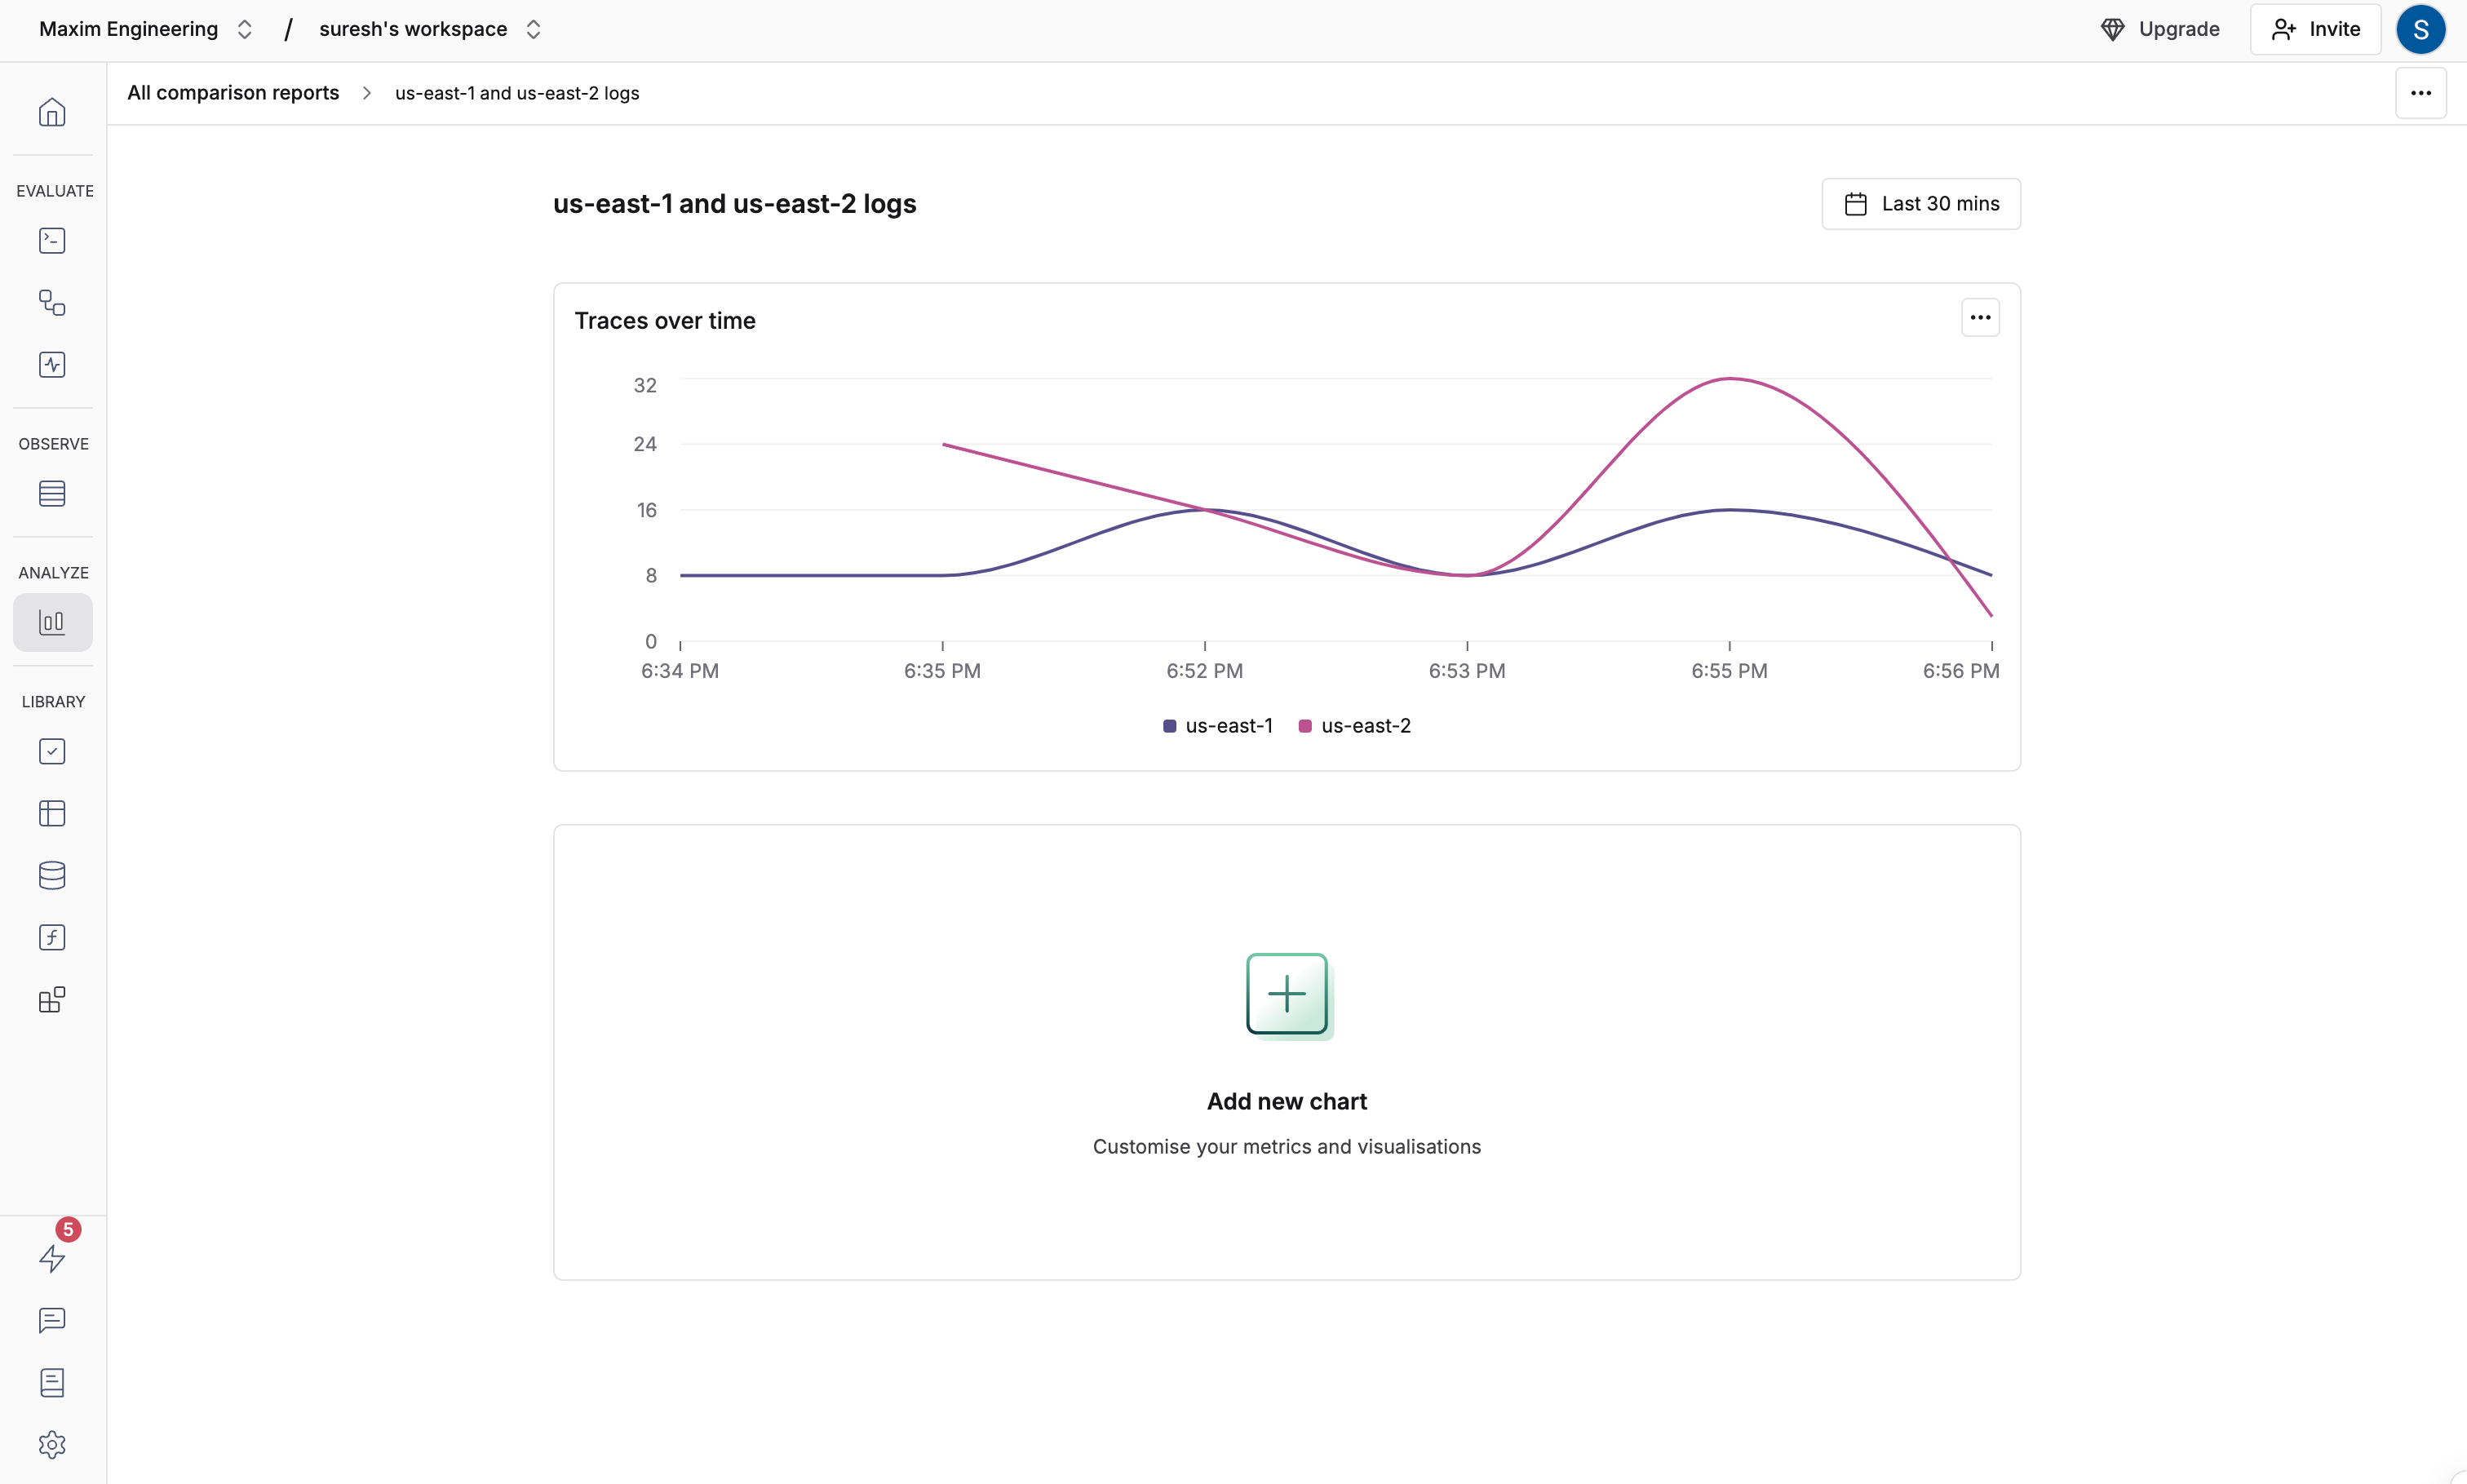
Log dashboards help you visualize key metrics from your production logs. Create custom views by combining data from multiple repositories and applying filters to track what matters most.
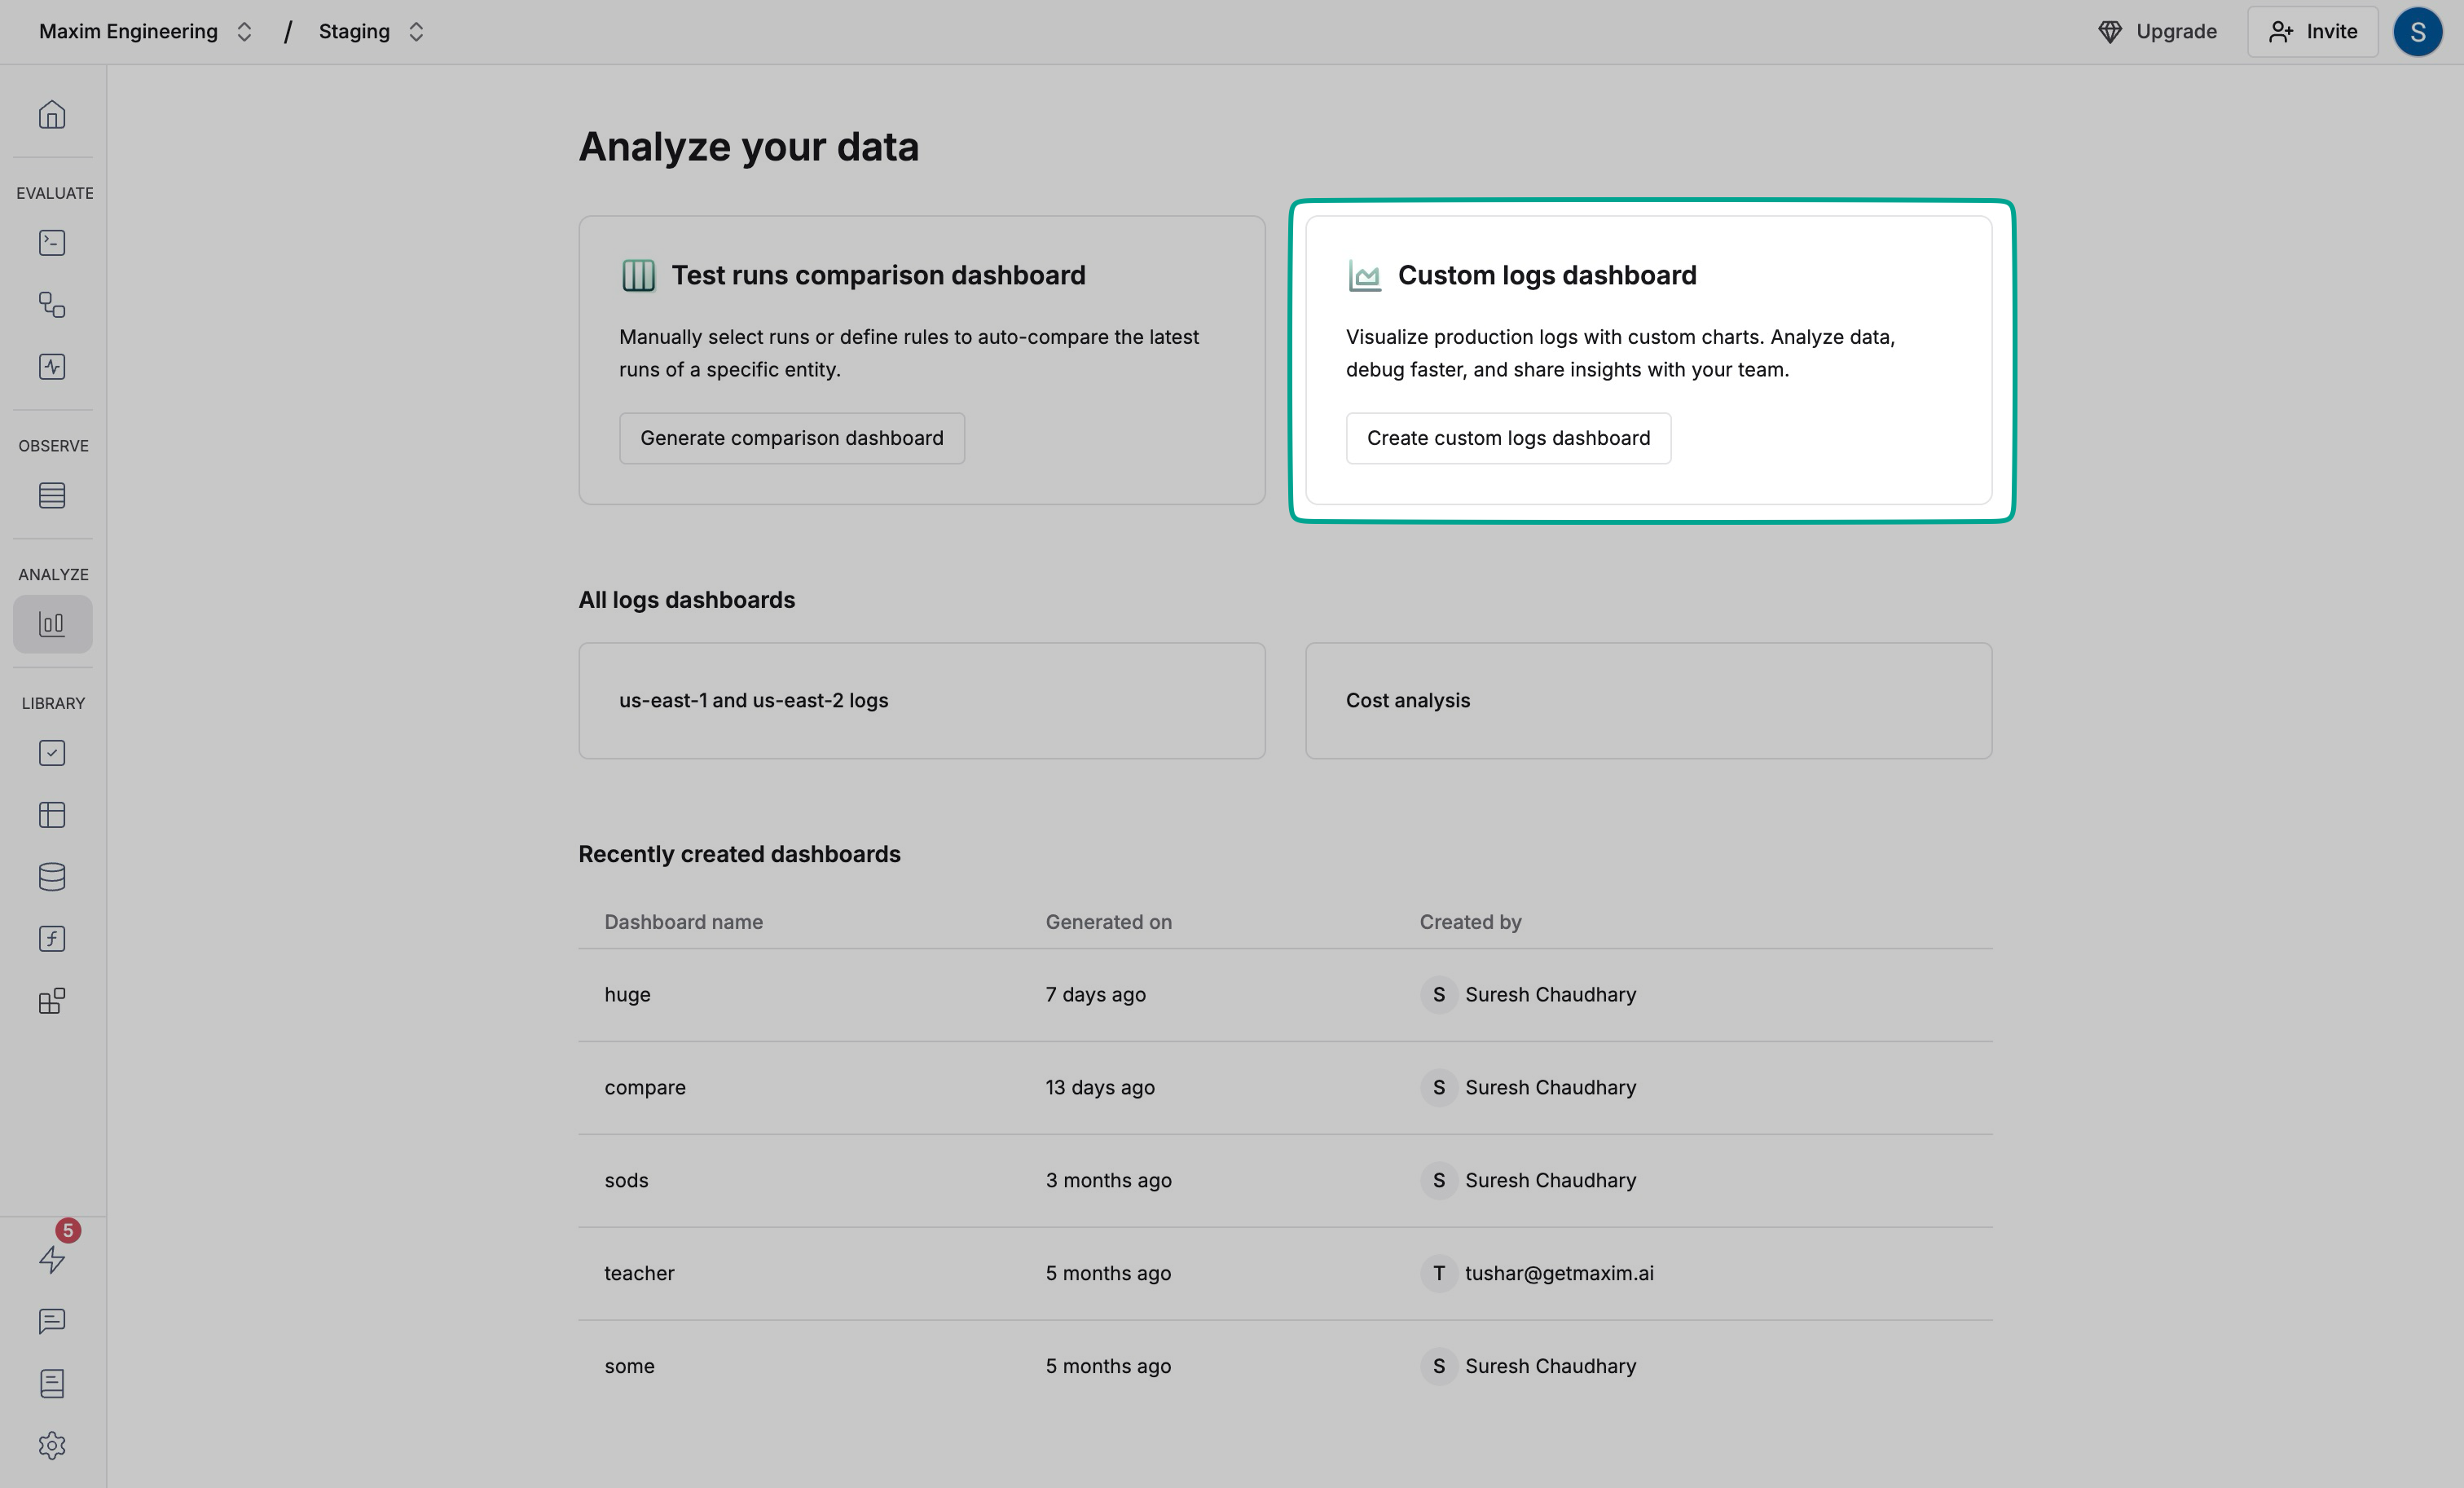
## Creating your first custom dashboard
Select **Dashboards** in the left sidebar and click "Create custom logs dashboard"
 Enter a name that describes the dashboard purpose
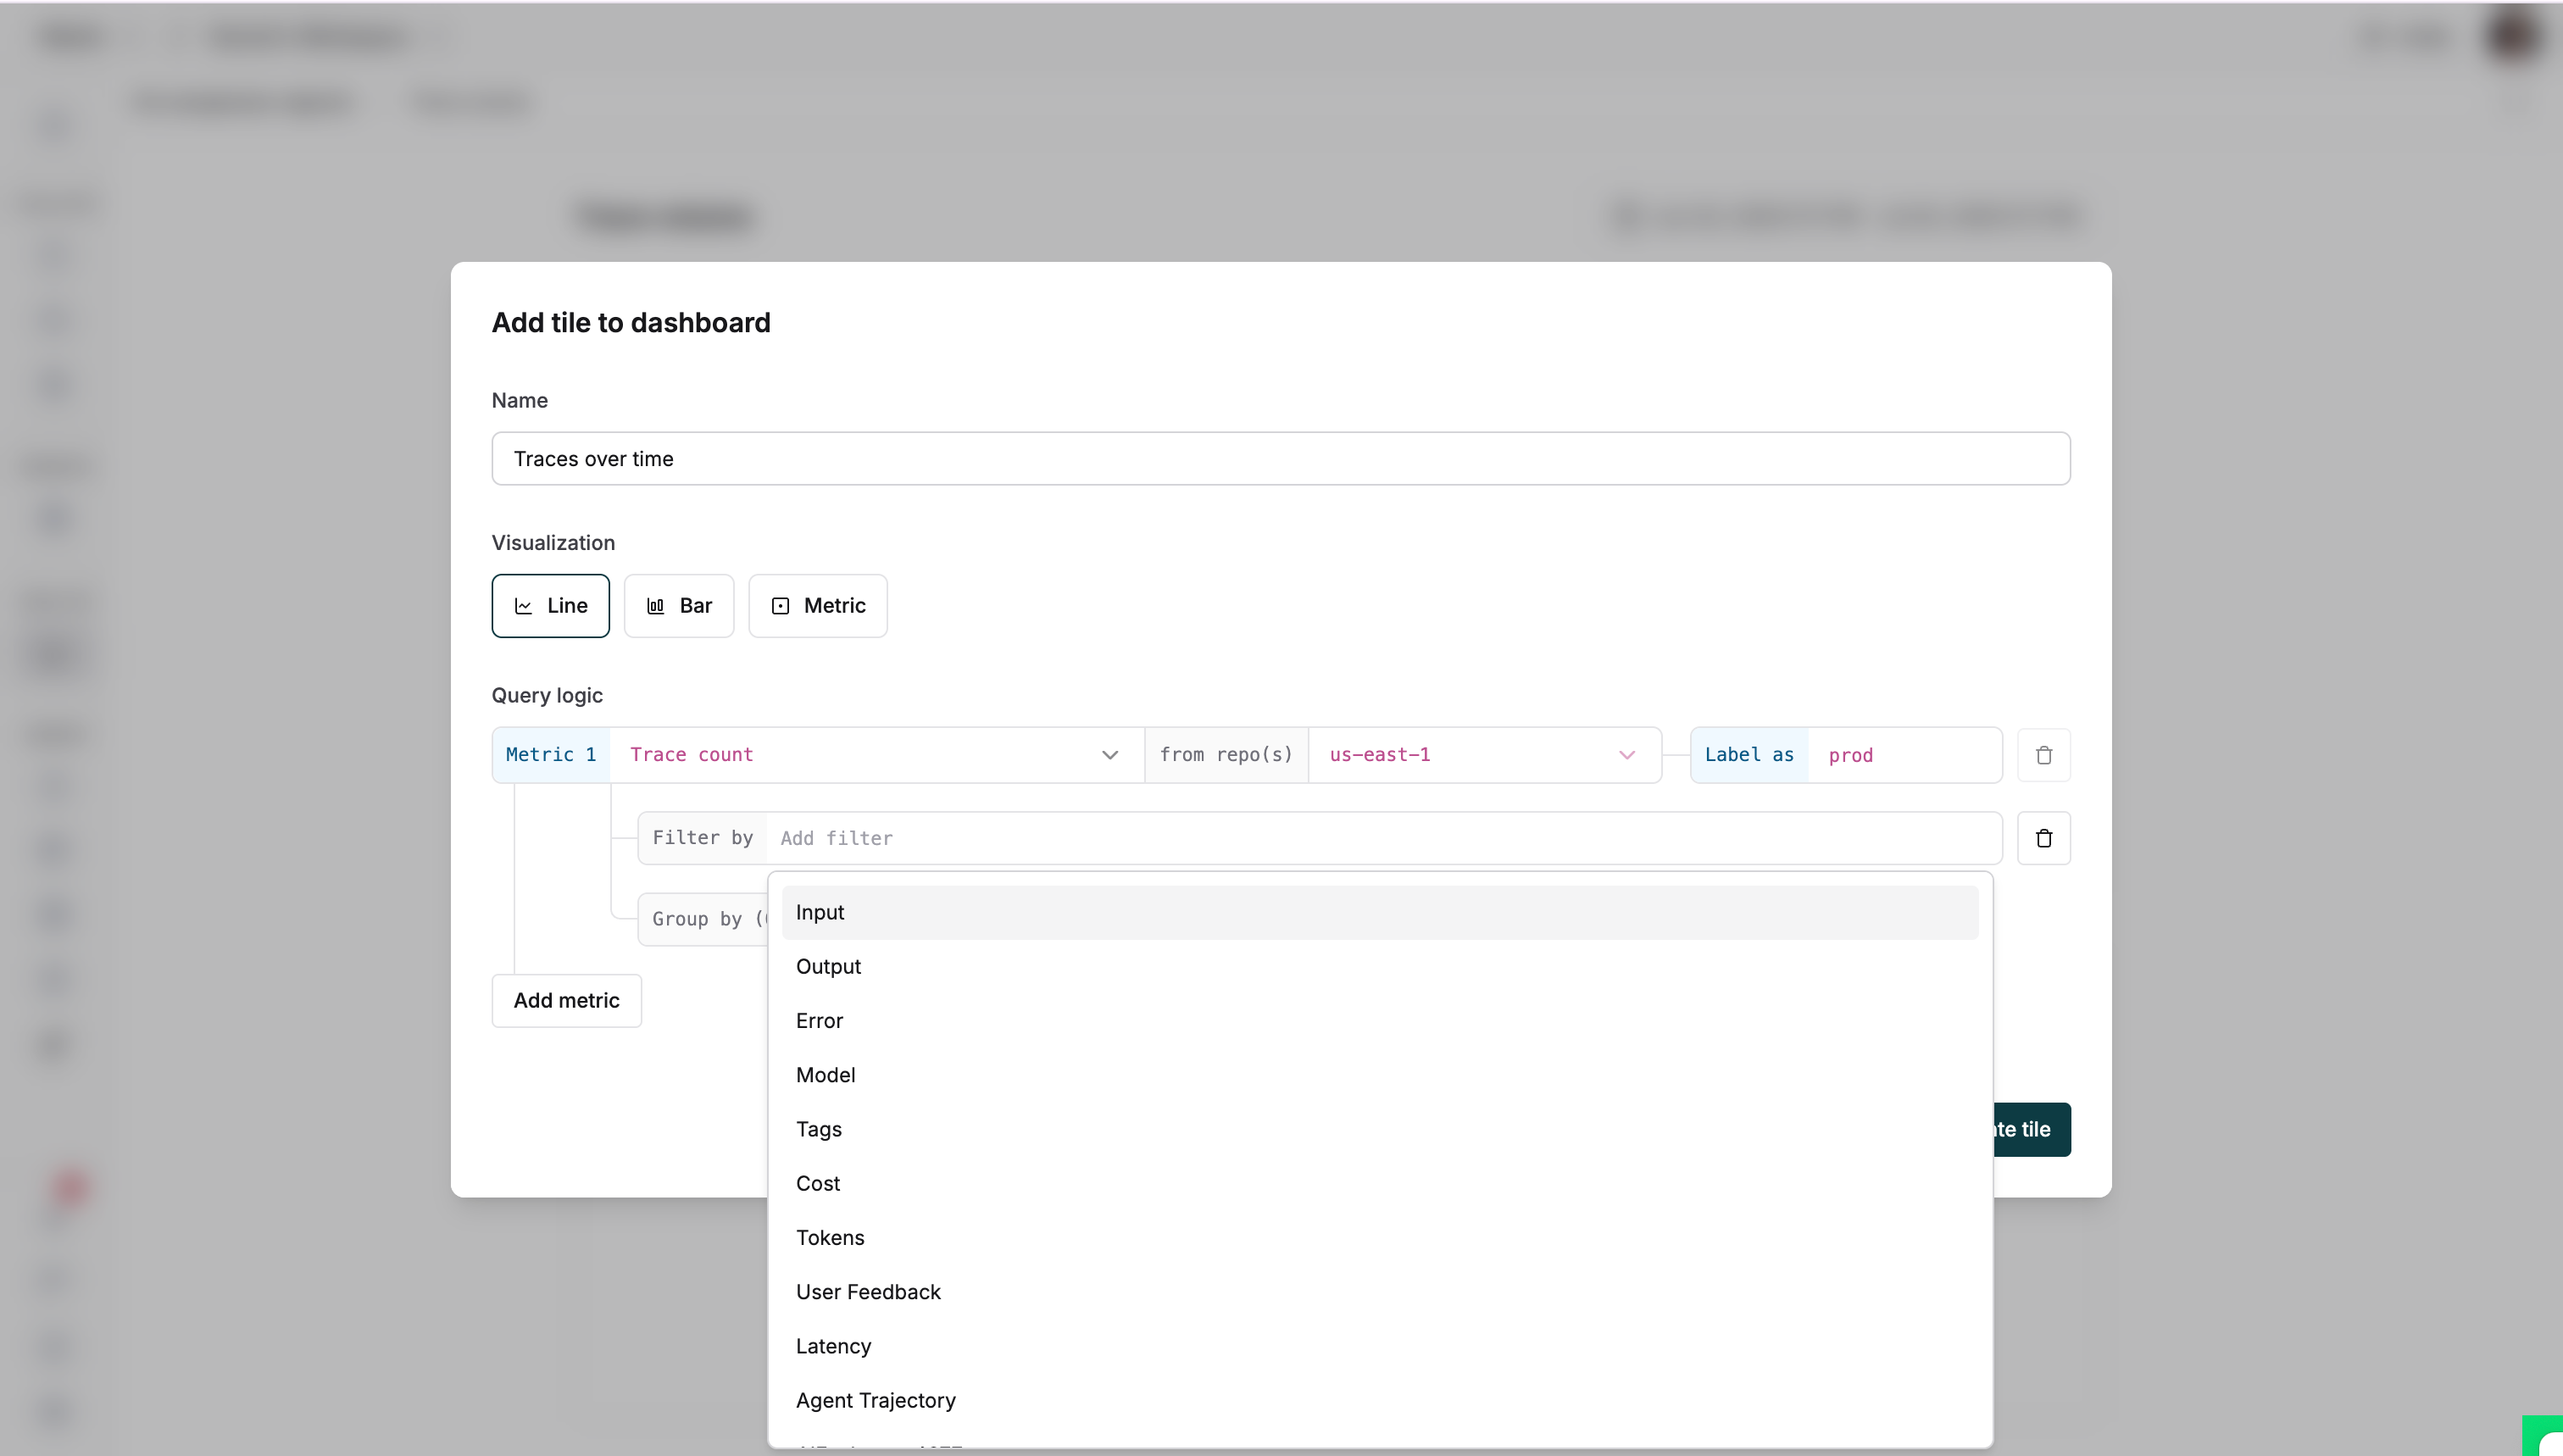
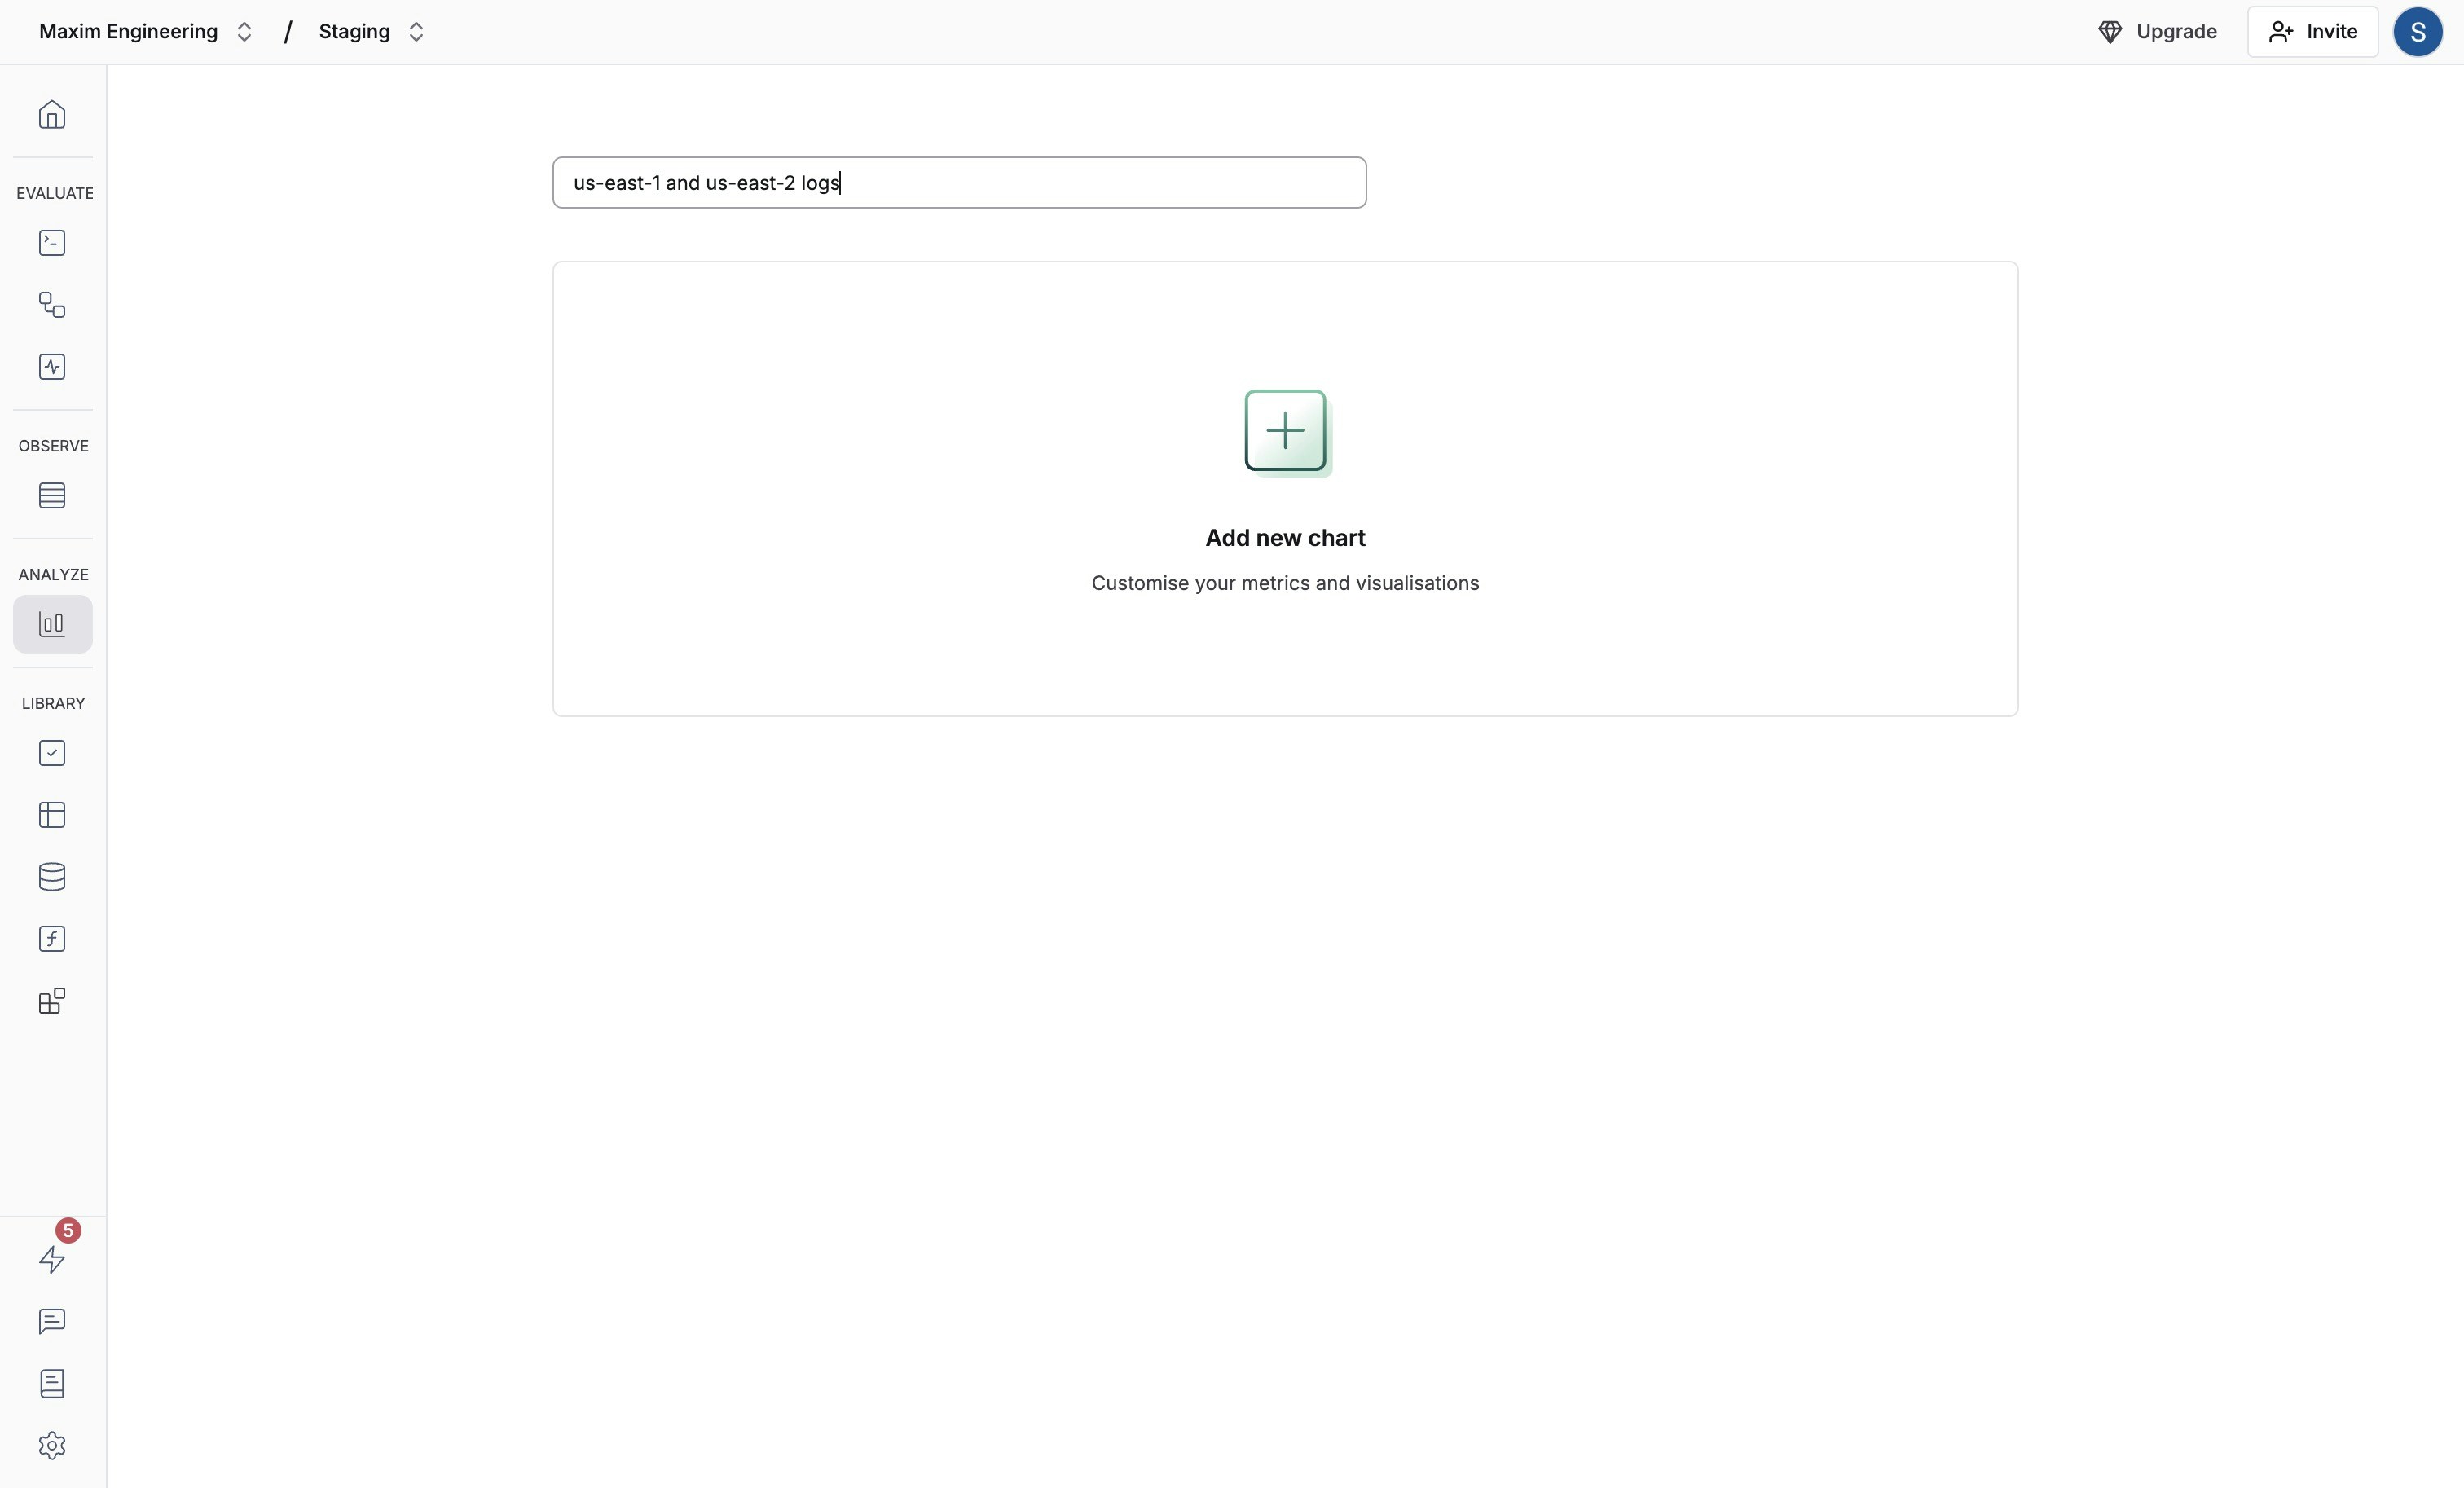 Add charts to monitor key metrics:
1. Choose a visualization type
2. Select metrics (trace count, latency, token usage)
3. Pick repositories to analyze
Compare metrics across applications by selecting multiple repositories
Add charts to monitor key metrics:
1. Choose a visualization type
2. Select metrics (trace count, latency, token usage)
3. Pick repositories to analyze
Compare metrics across applications by selecting multiple repositories
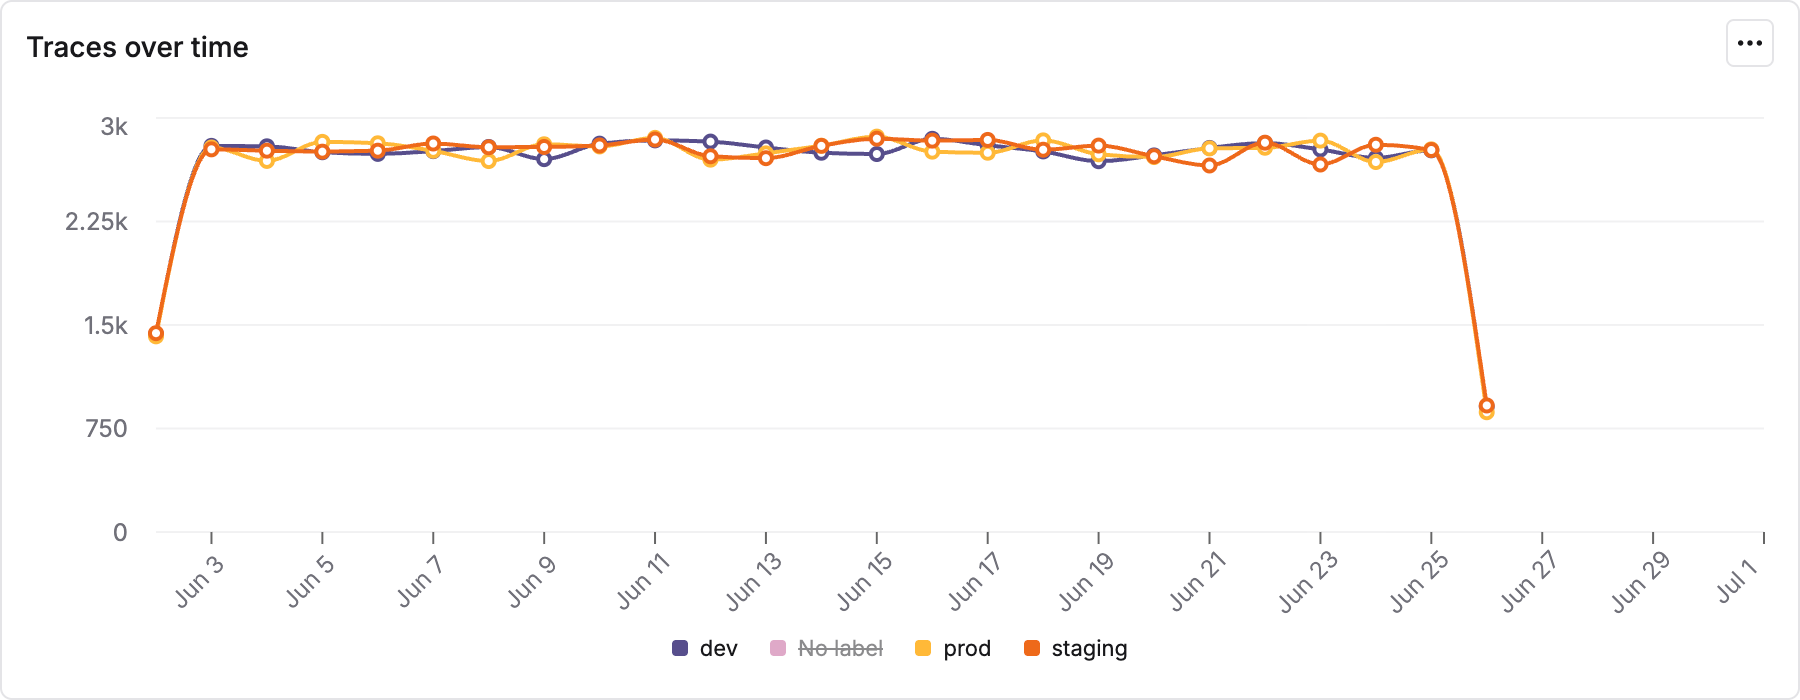
 Track metrics over time with real-time updates
 Interact with charts to dive deeper:
* Hover to see exact data points
* Click any point to view corresponding logs
* Apply filters and time ranges to identify specific logs
## Advanced configurations
### Add filters
Customize charts with filters to track:
* Specific user segments
* High-latency requests
* Error patterns
Interact with charts to dive deeper:
* Hover to see exact data points
* Click any point to view corresponding logs
* Apply filters and time ranges to identify specific logs
## Advanced configurations
### Add filters
Customize charts with filters to track:
* Specific user segments
* High-latency requests
* Error patterns
 ### Data aggregation
Group data to analyze patterns:
* Select **Group by** to segment data by model, tags, or repositories
### Data aggregation
Group data to analyze patterns:
* Select **Group by** to segment data by model, tags, or repositories
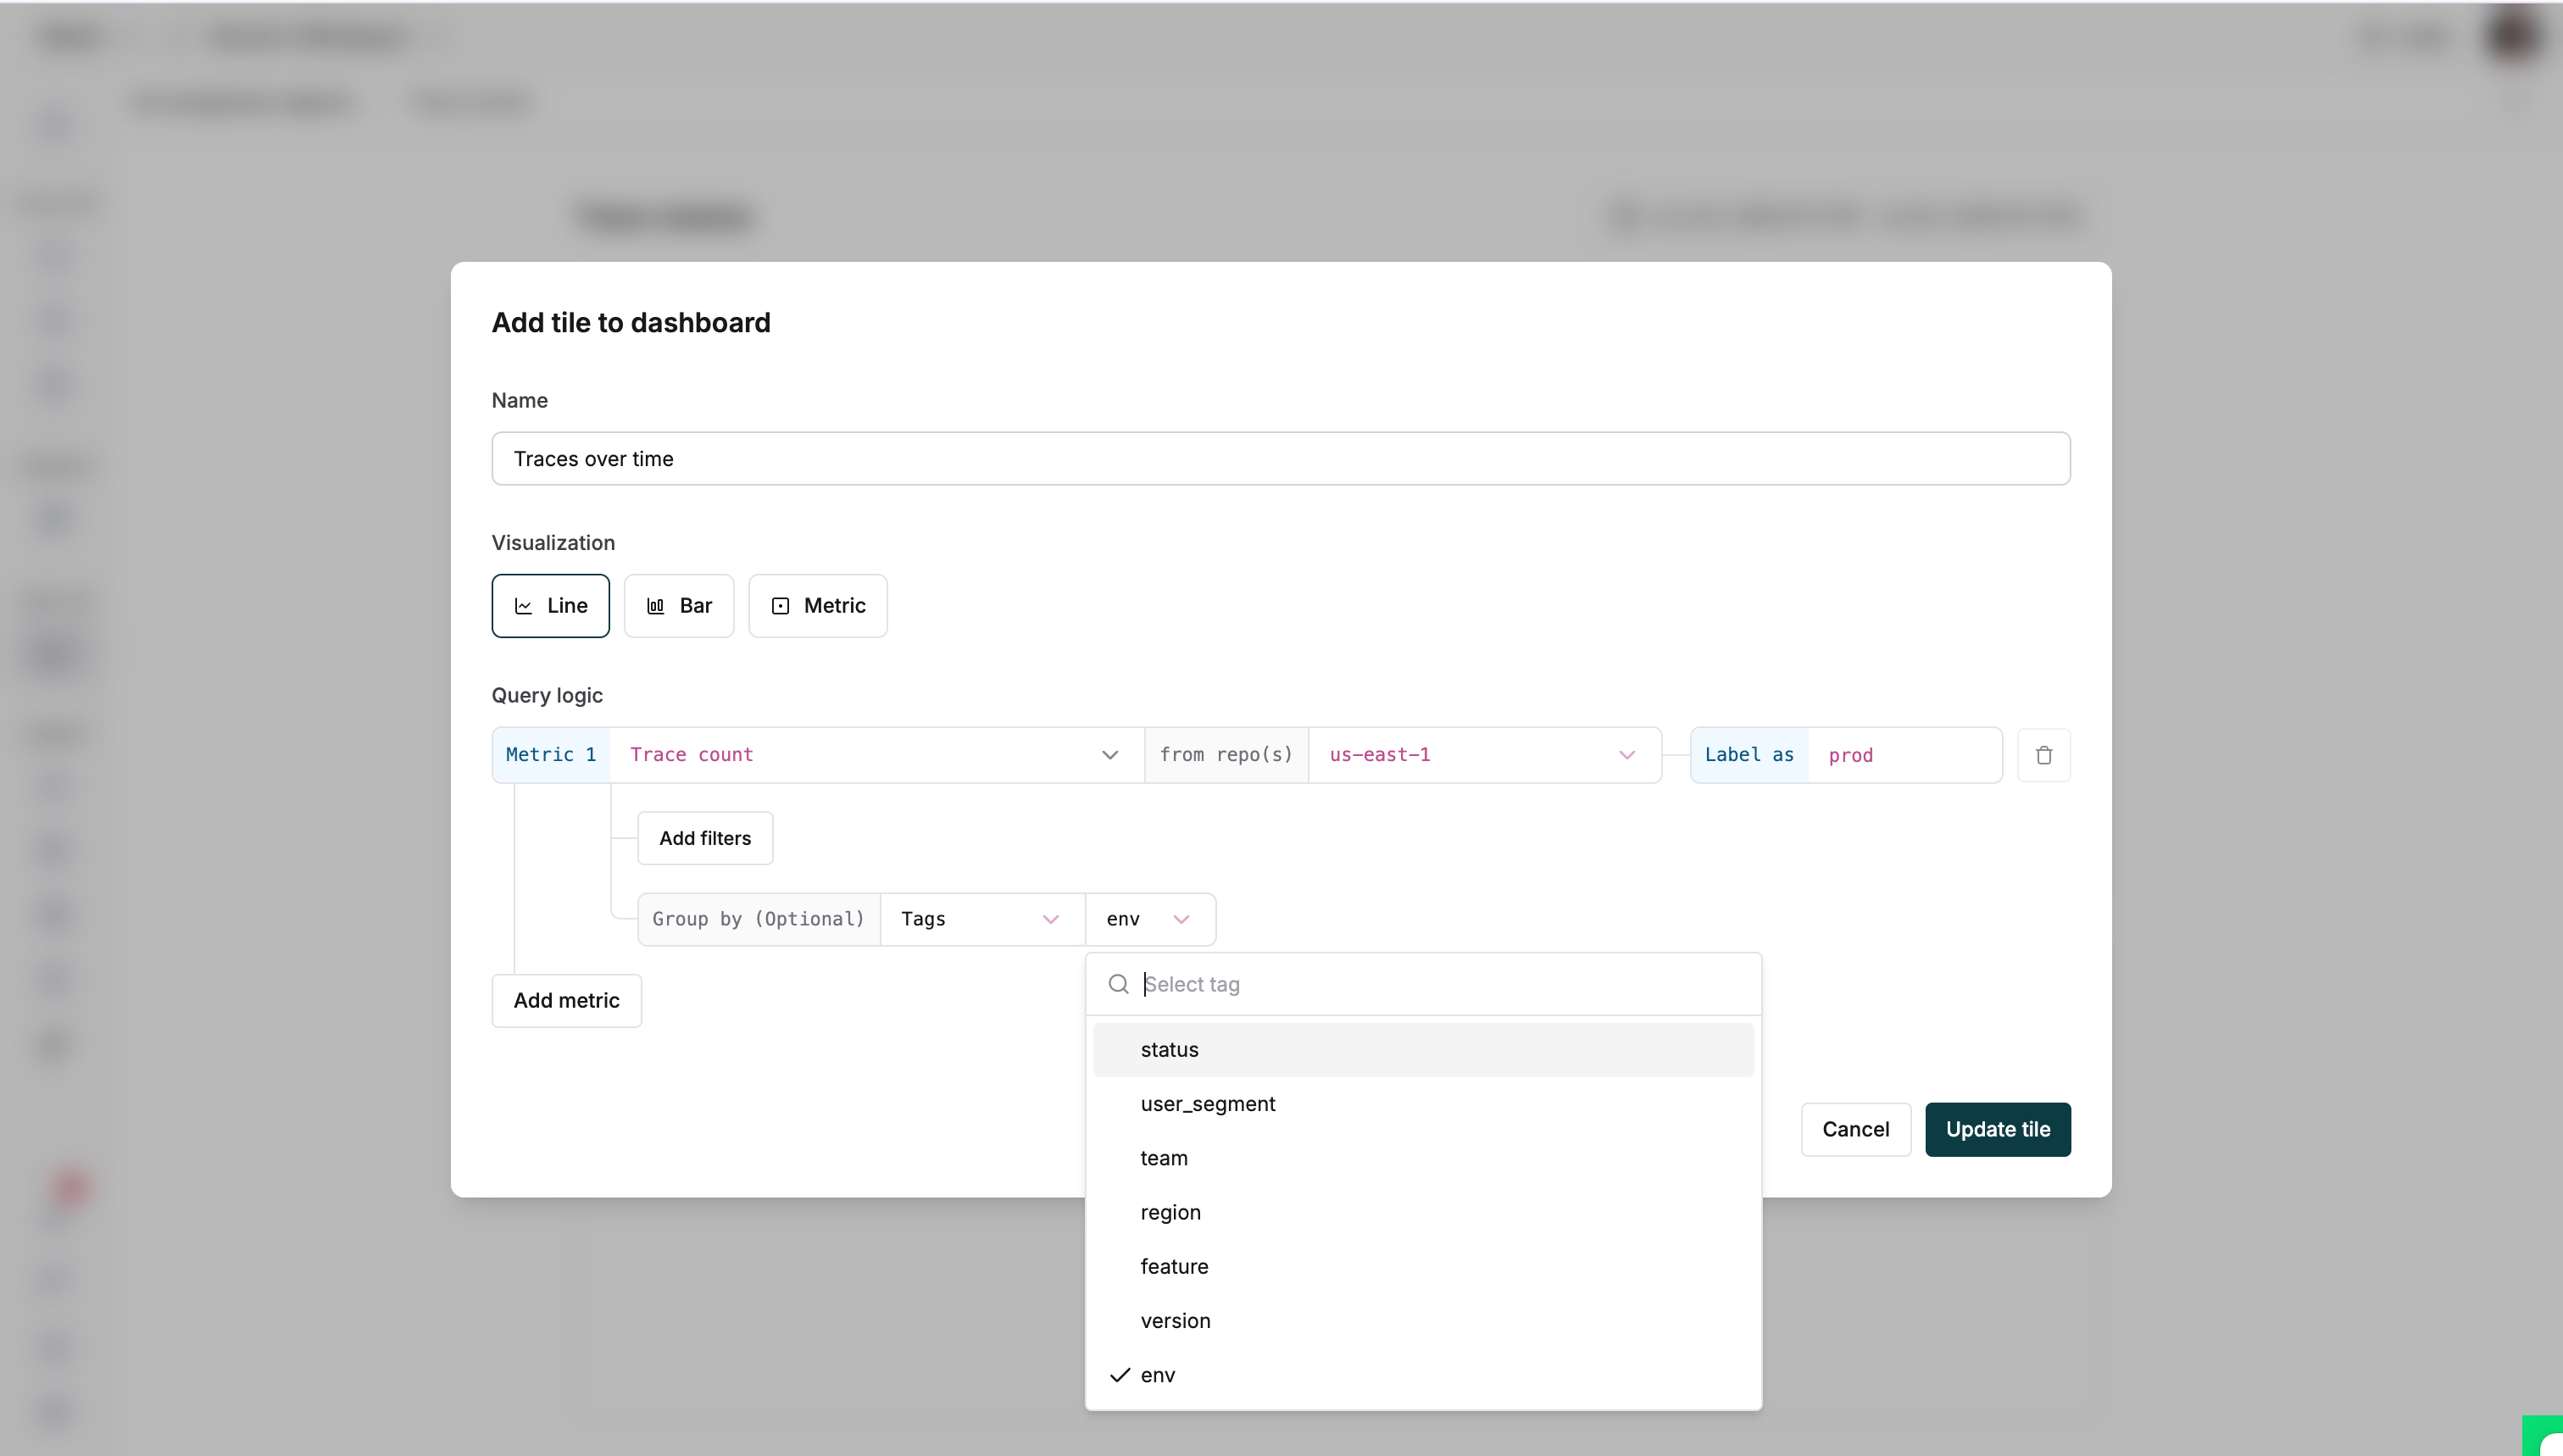 * Once configured, save the entry to see your data
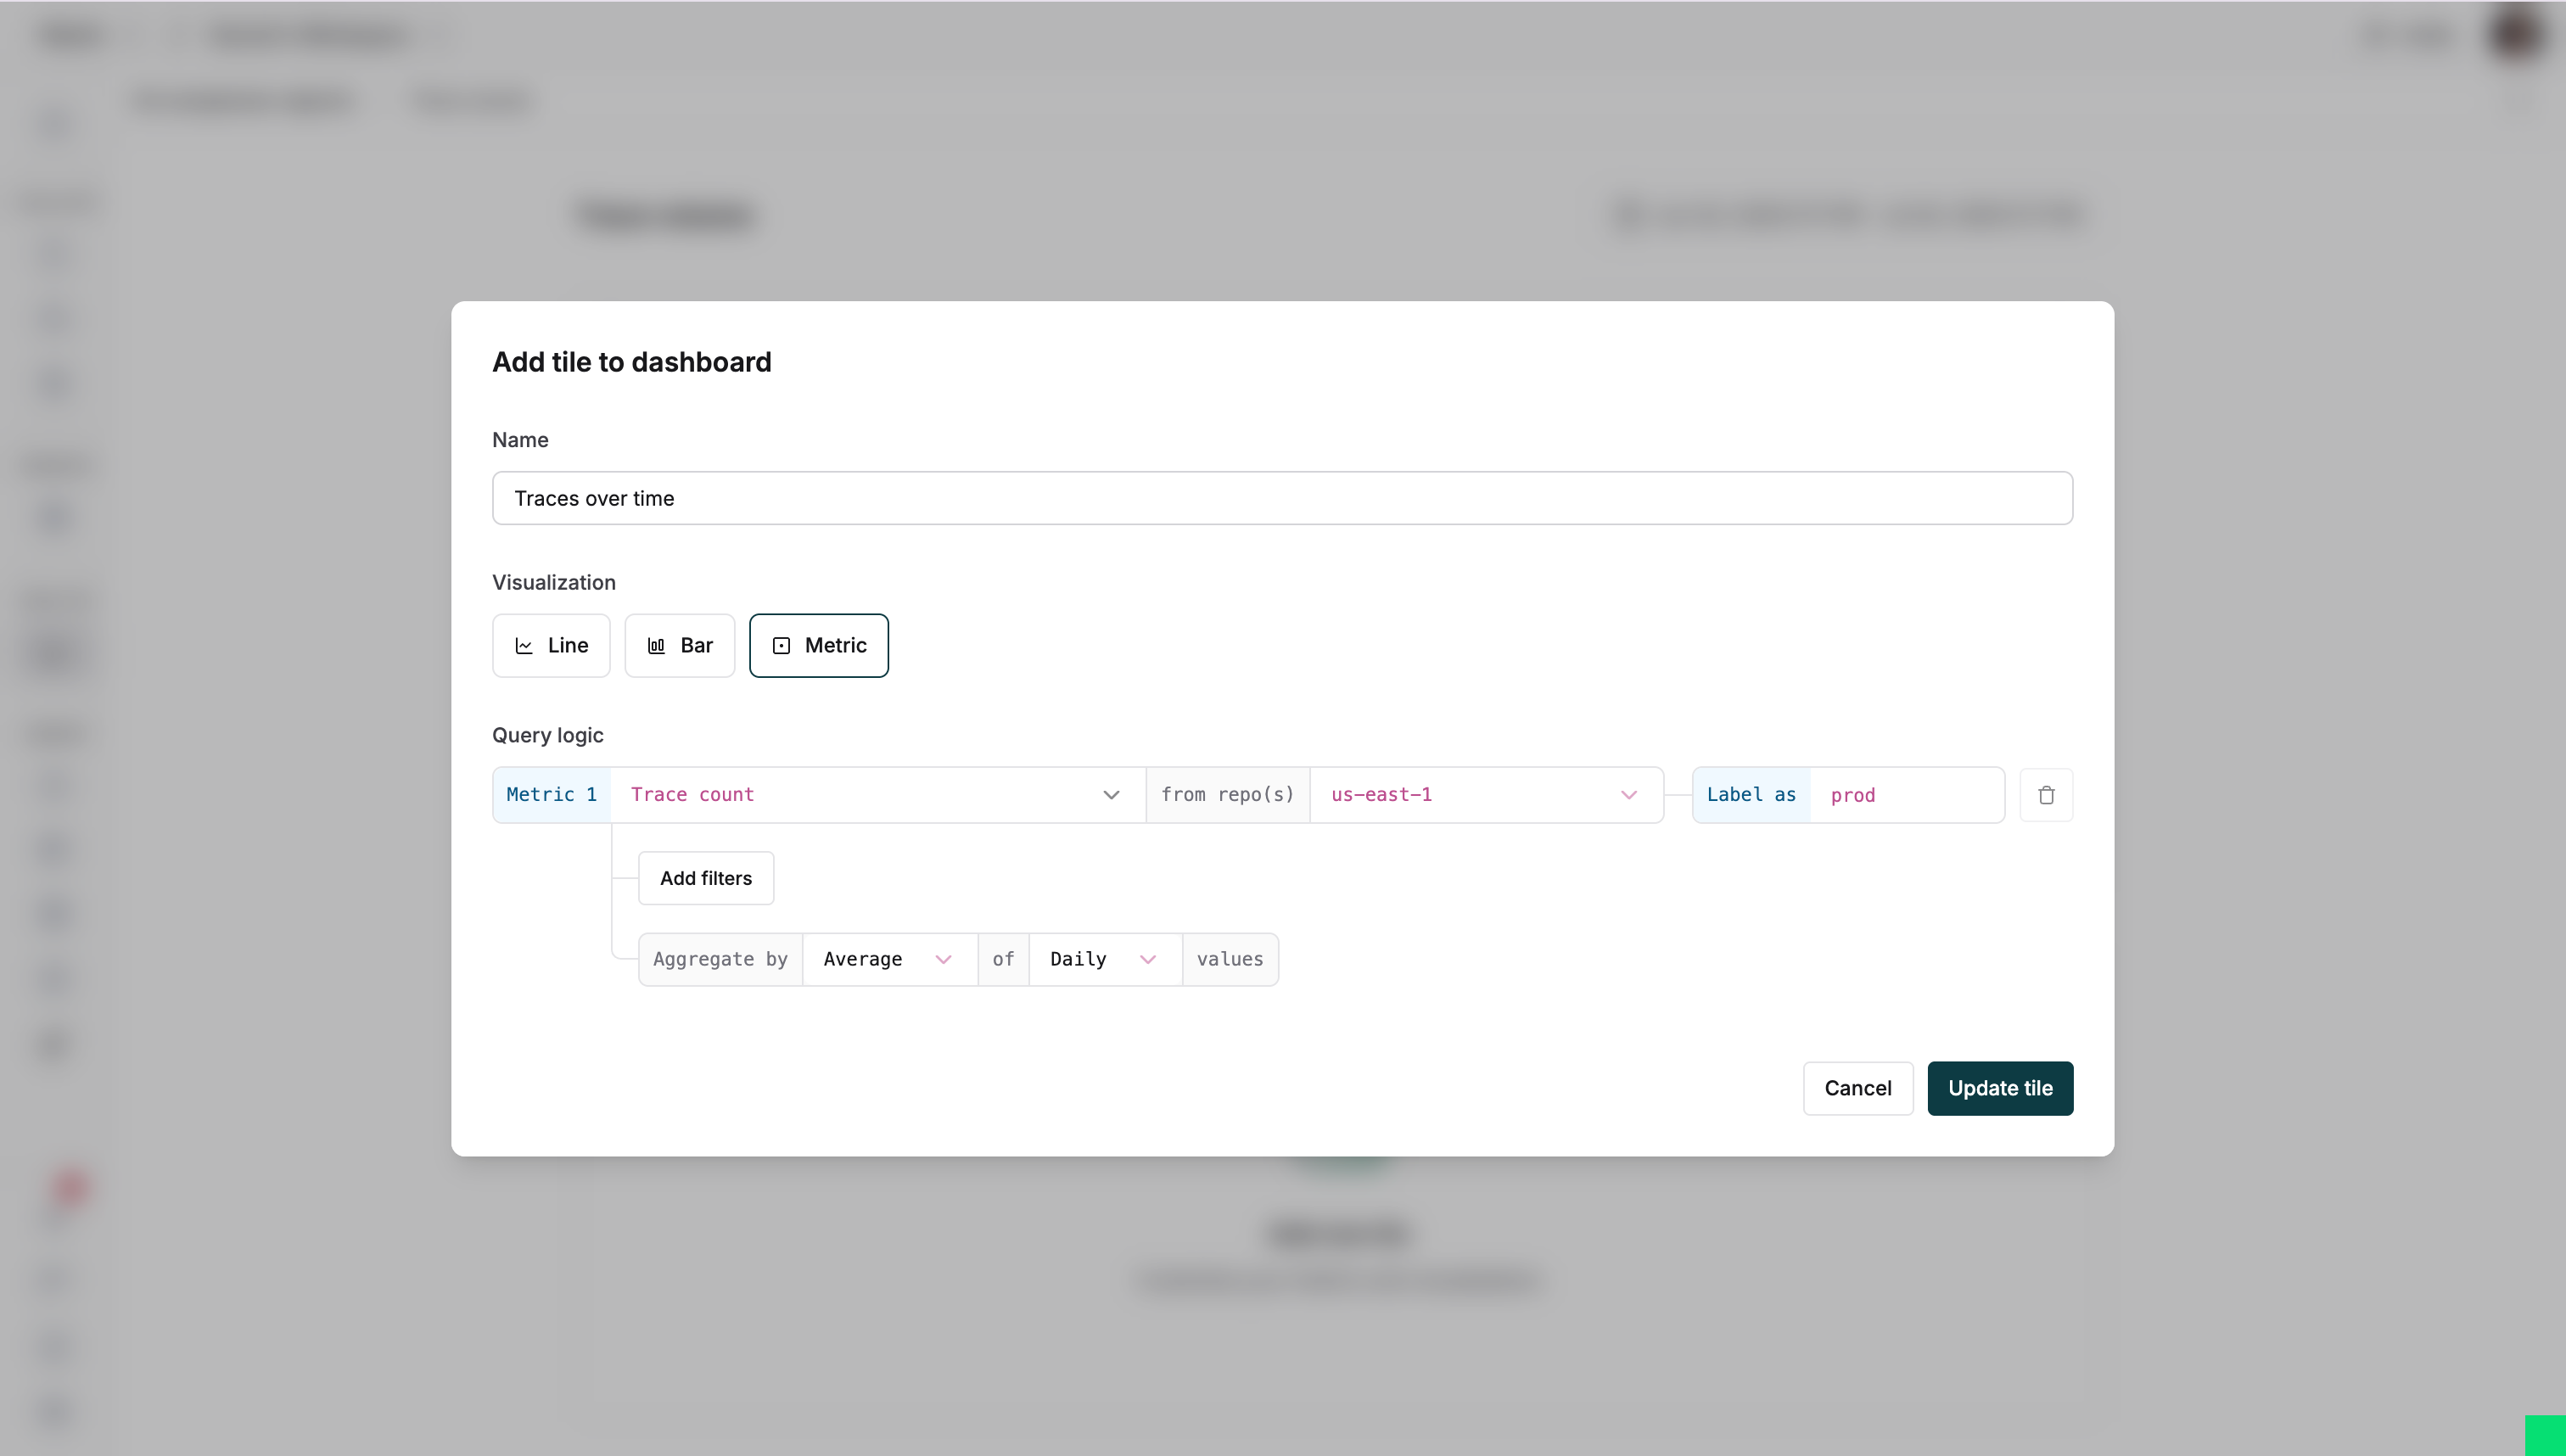
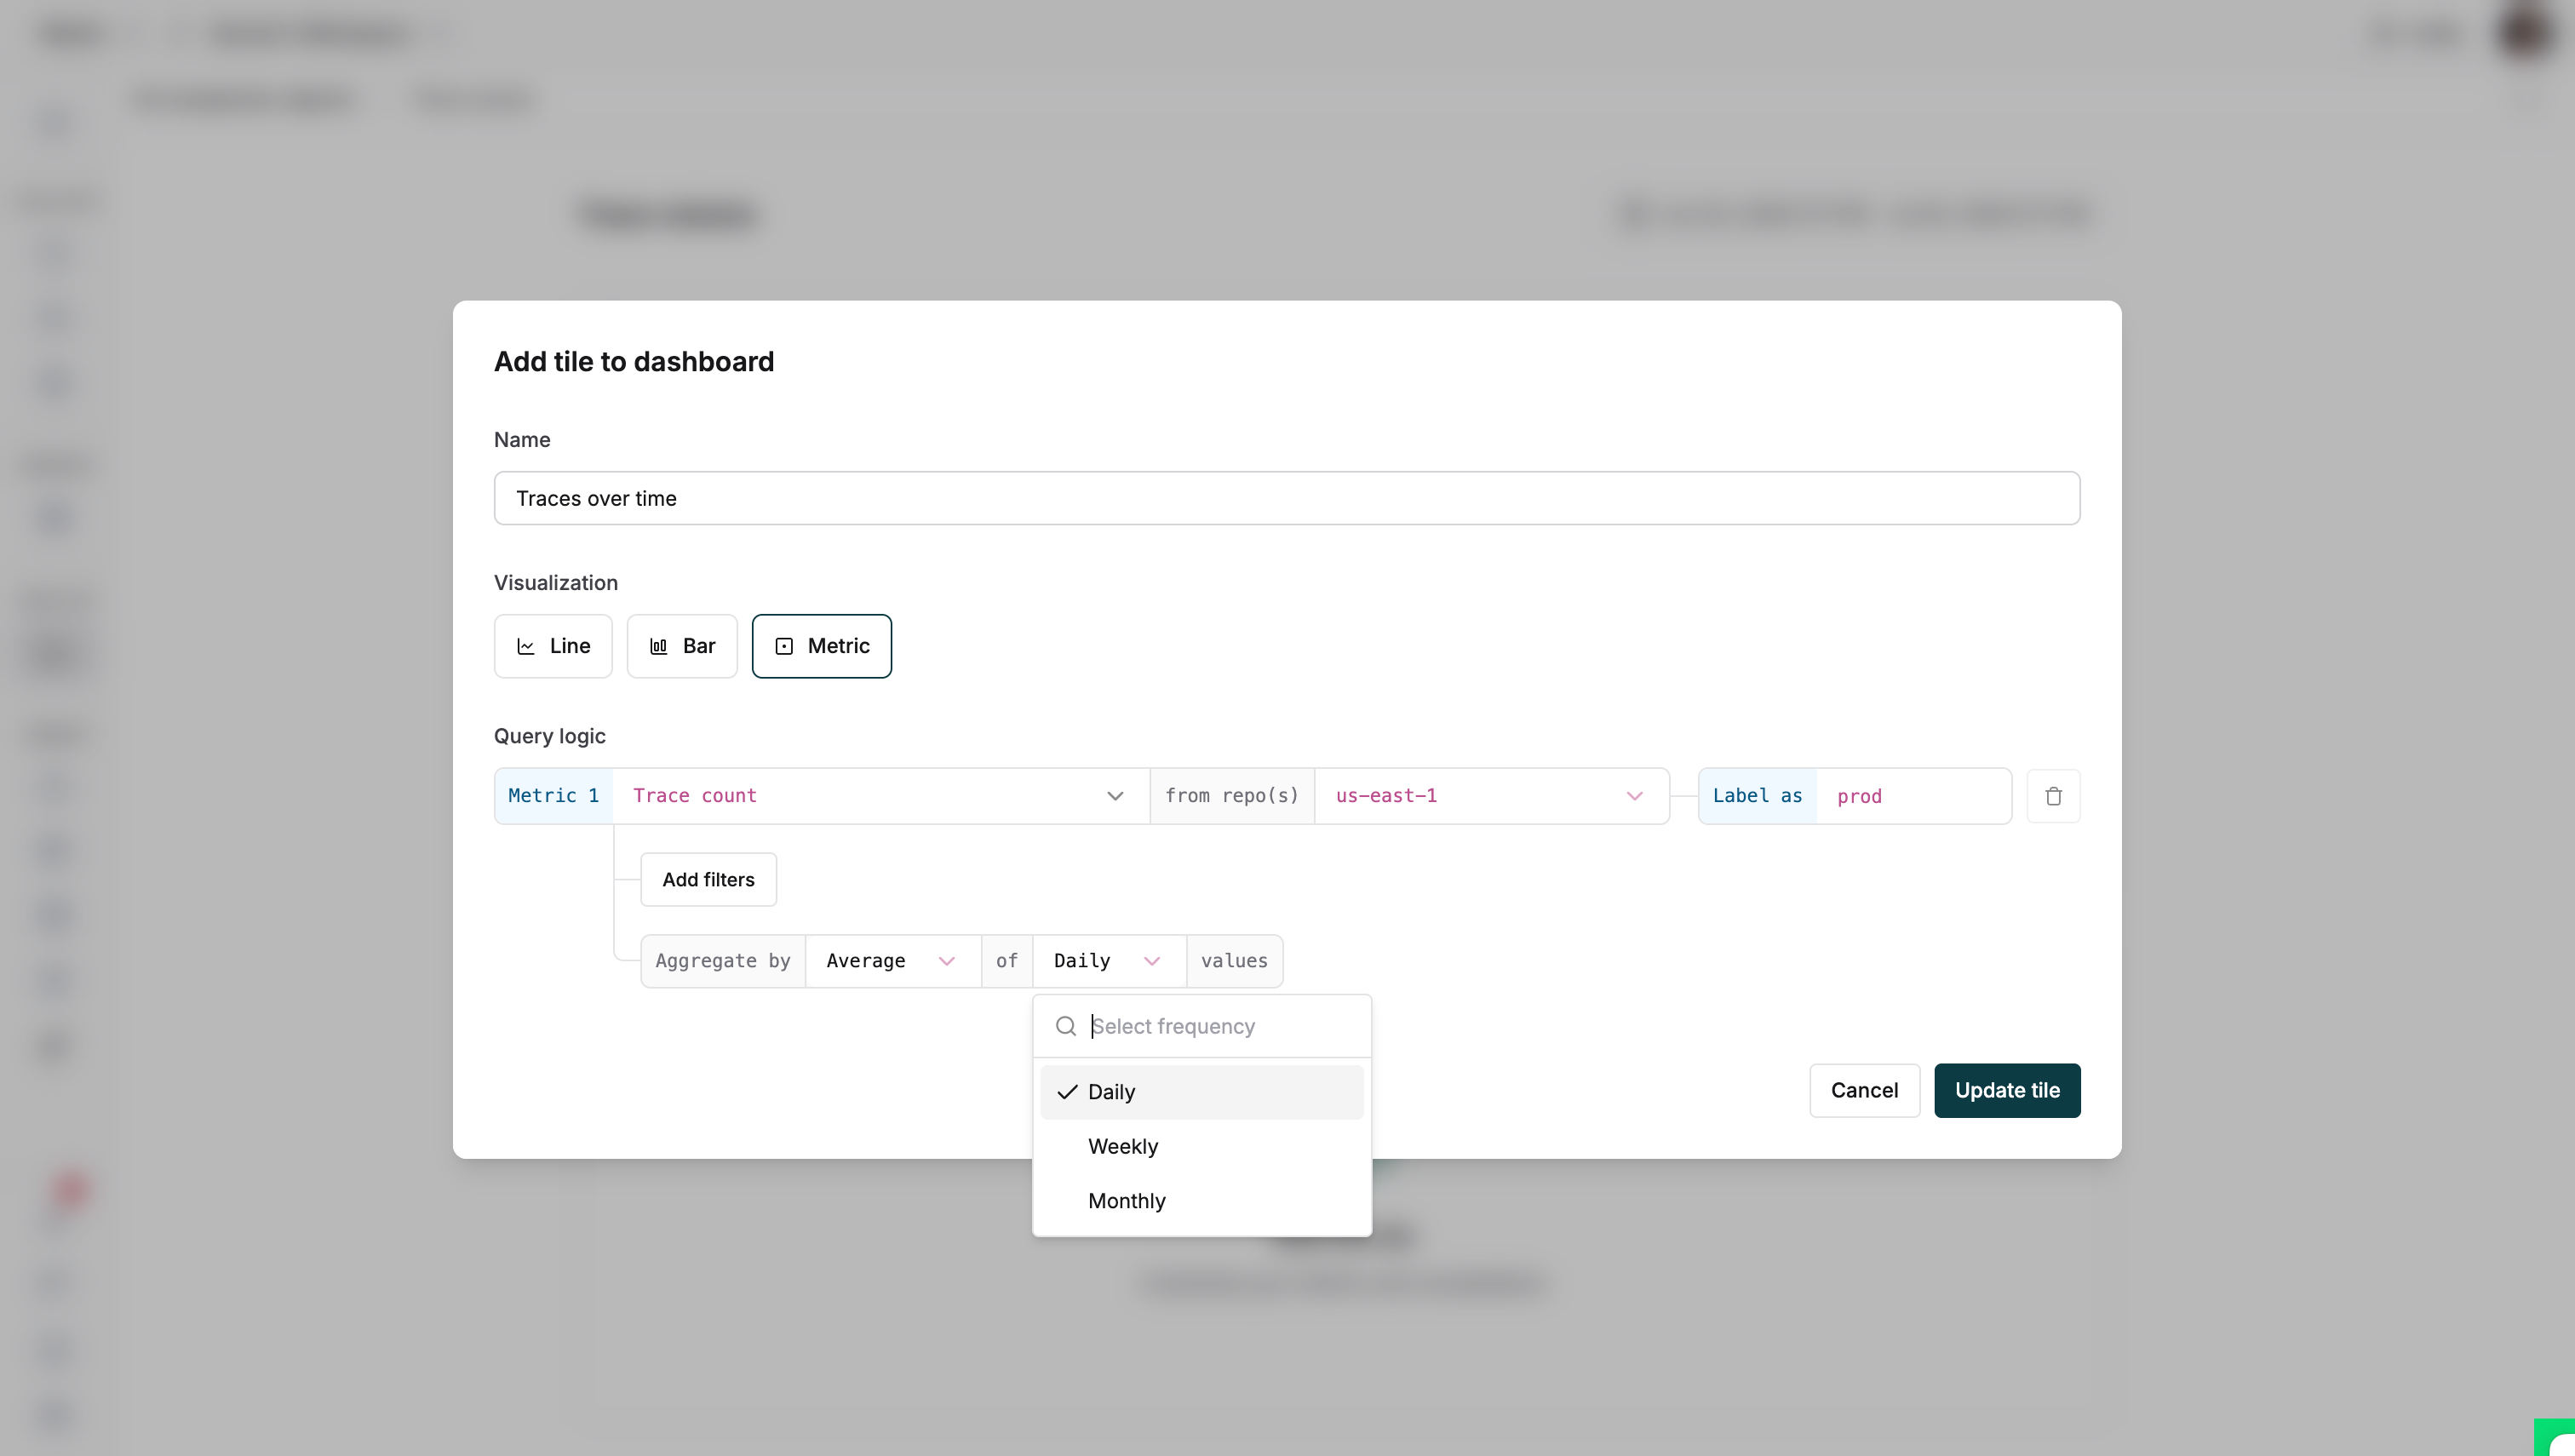
 For metric data:
* Select metric visualization
* Choose time-based aggregation
* Pick sum for total traces or average for mean values
* Set aggregation frequency (daily, weekly, monthly)
For metric data:
* Select metric visualization
* Choose time-based aggregation
* Pick sum for total traces or average for mean values
* Set aggregation frequency (daily, weekly, monthly)
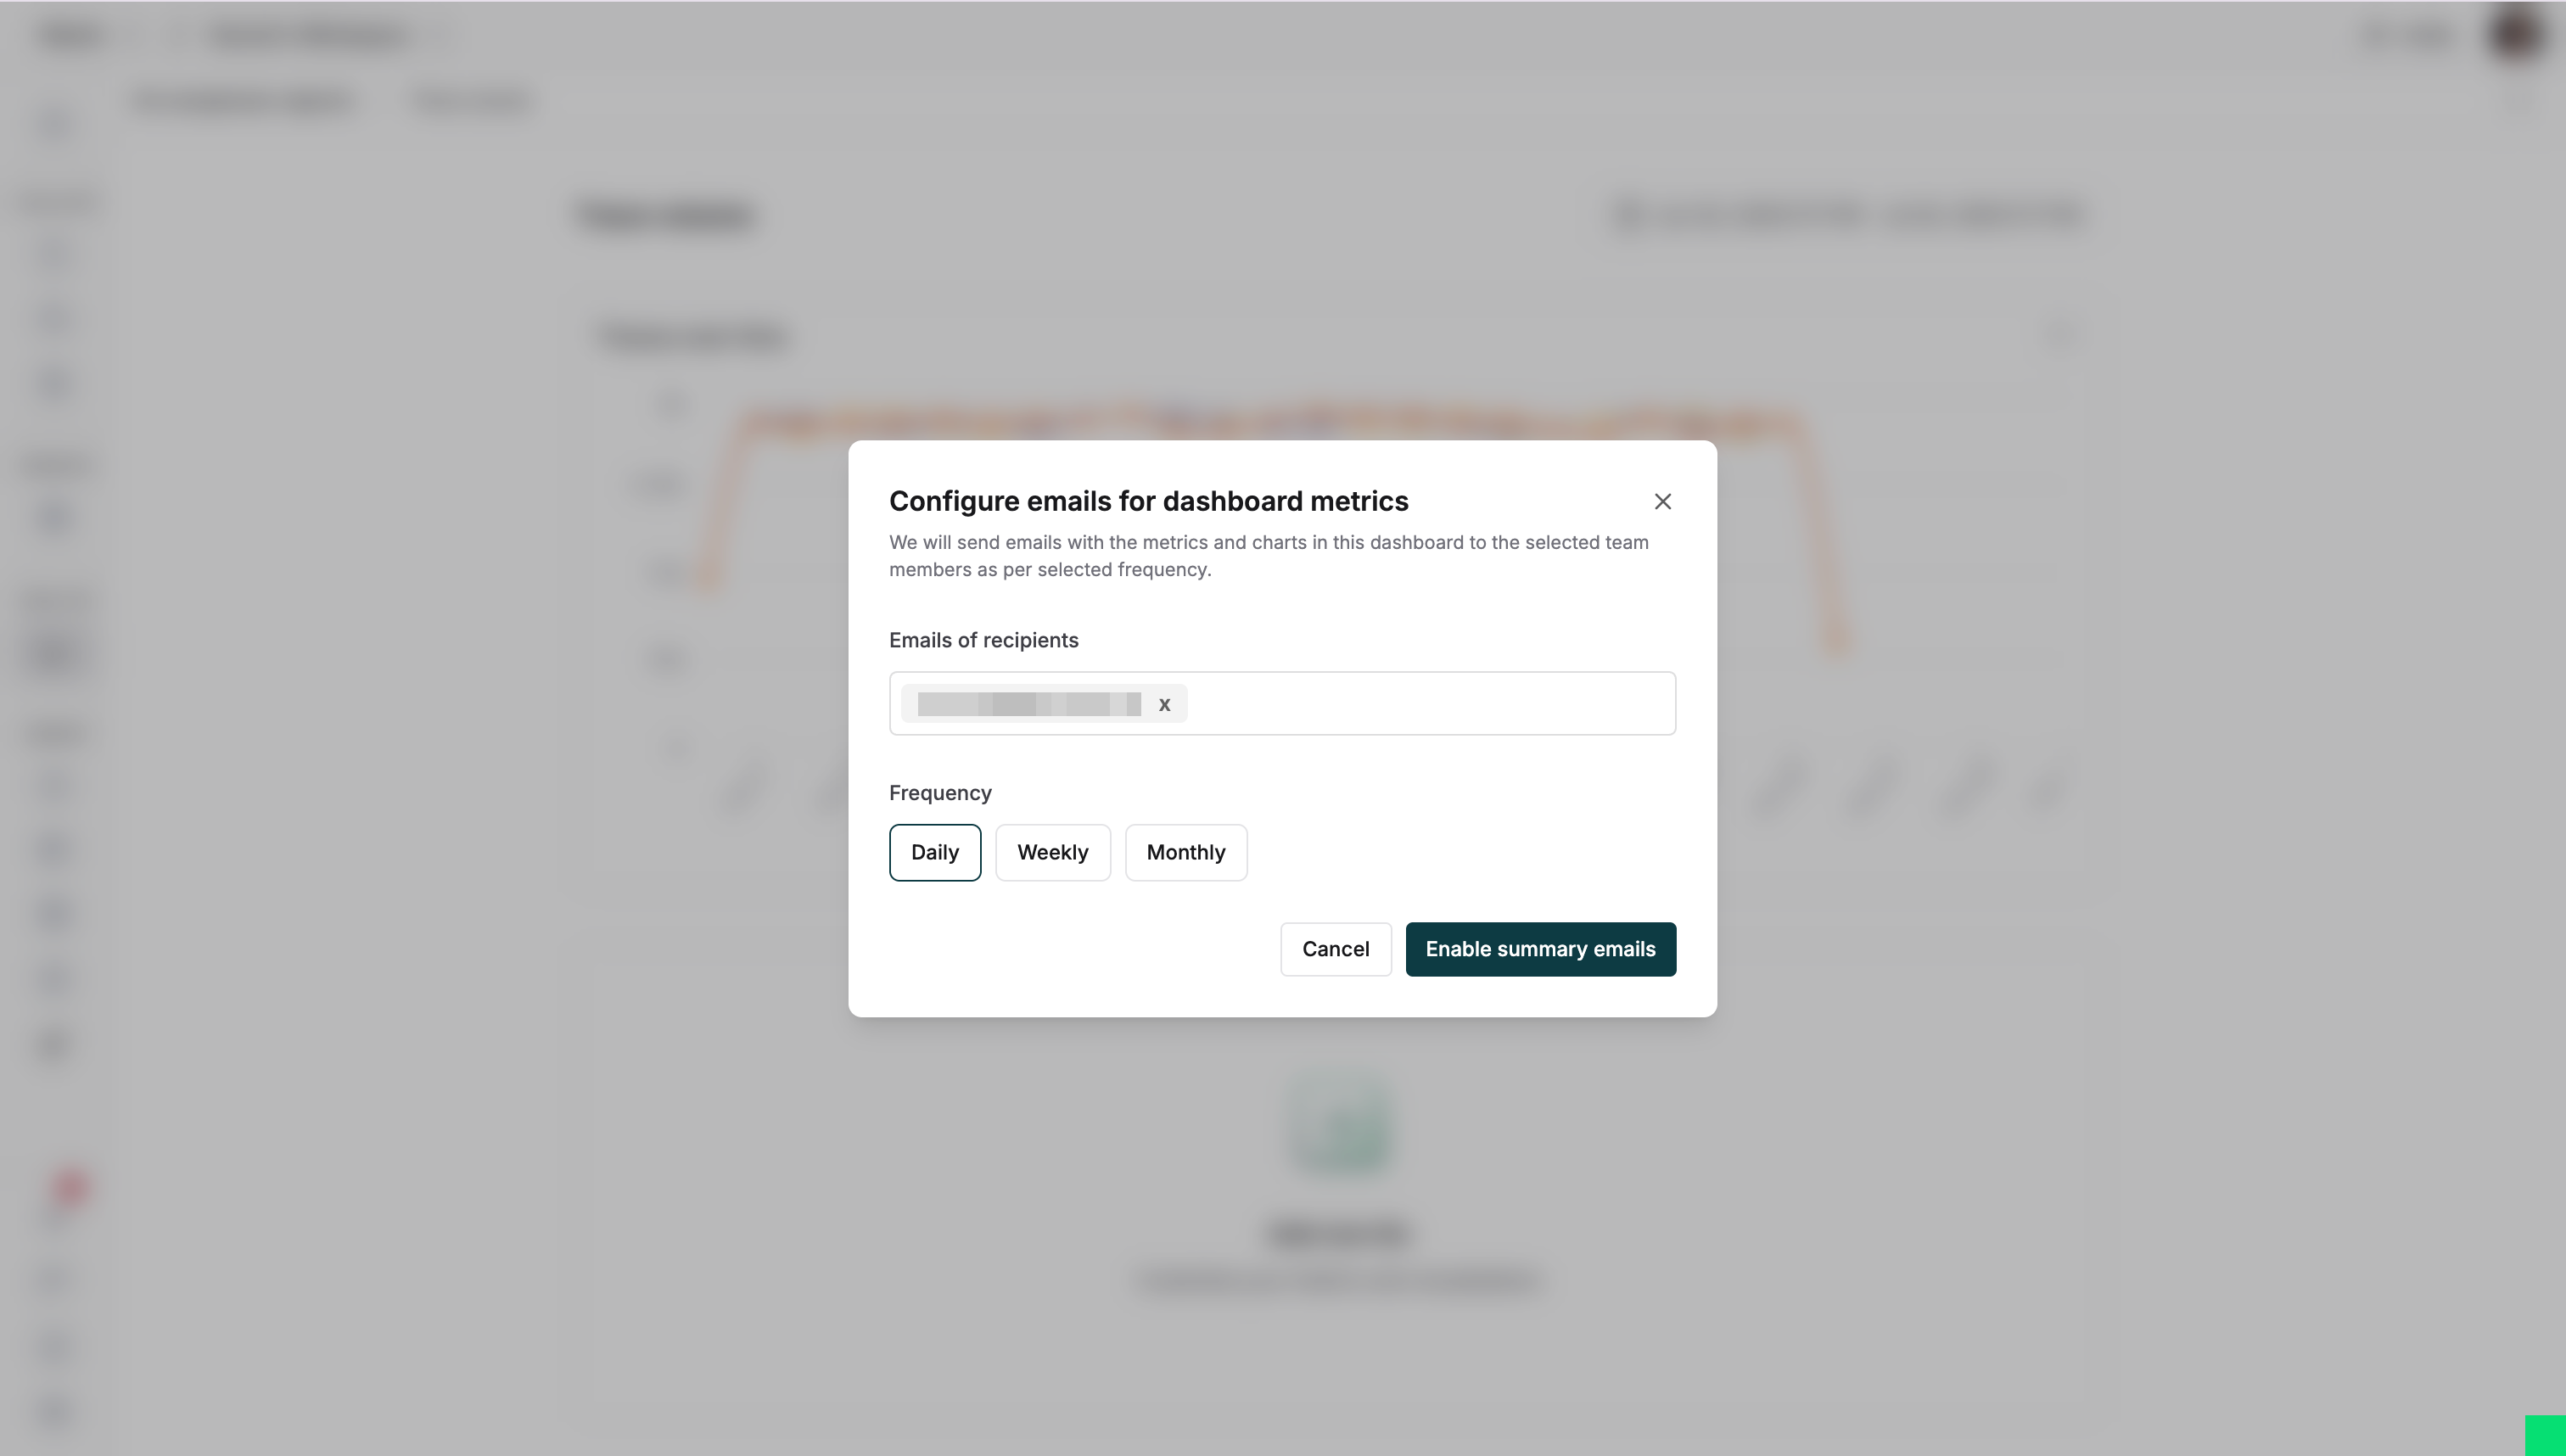
 ## Summary emails
Get dashboard updates directly in your inbox:
1. Click the three-dot menu and select "Configure summary emails"
## Summary emails
Get dashboard updates directly in your inbox:
1. Click the three-dot menu and select "Configure summary emails"
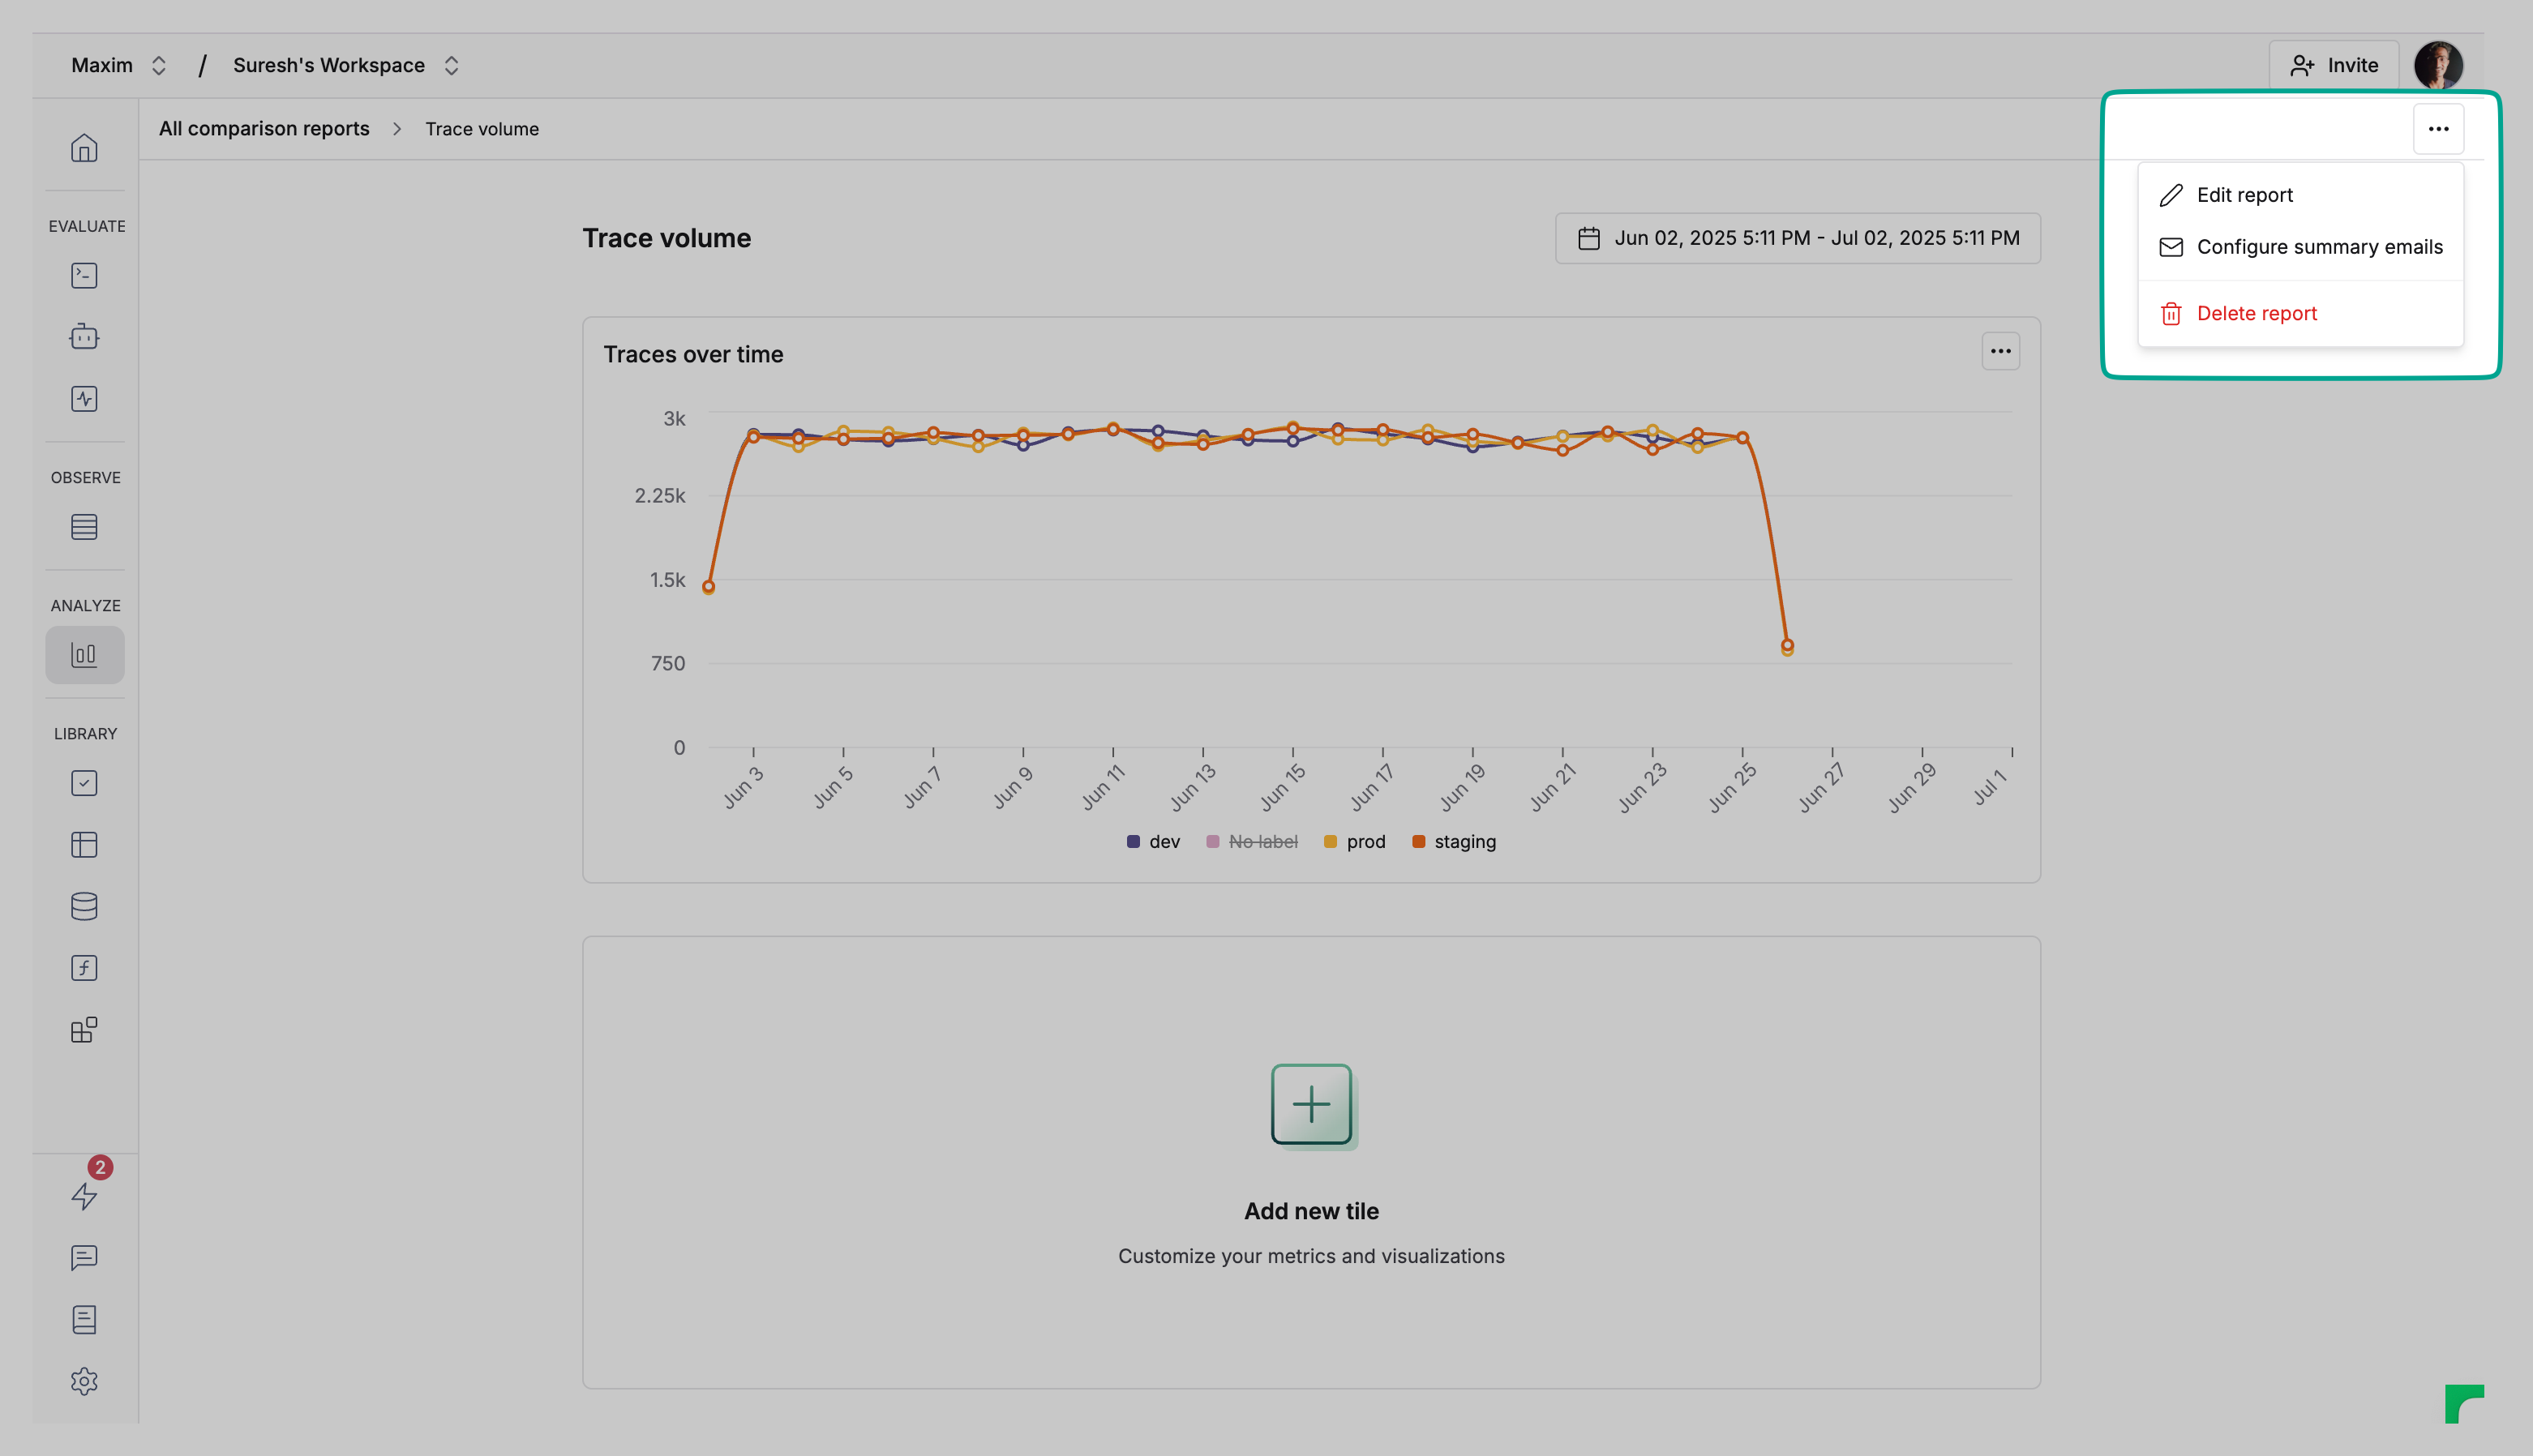 2. Set recipients and frequency for dashboard snapshots